
Ethnicity, Language and Immigration Thematic Series
Key facts on the French language in Alberta in 2021
Skip to text
Text begins
This fact sheet gives an overview of the situation of French in Alberta in 2021. It begins by providing information on the changes in the number and proportion of the population who can have a conversation in French, whose first official language spoken is French, whose mother tongue is French, and who speak French at home or use French at work. Next, it presents information on French‑language instruction in primary and secondary schools, on French spoken among recent and established immigrants, as well as on the mobility and place of birth of individuals whose first official language spoken is French. Additional data on these topics can be found in the appendix.
The information presented in this fact sheet comes from the Census of Population. To learn more about census concepts and the historical comparability of data, please refer to the 2021 Census of Population Languages Reference Guide and the Instruction in the Minority Official Language Reference Guide.
Start of text boxHighlights
- In 2021, 261,435 Albertans could conduct a conversation in French. This number rose steadily from 1991 to 2016 (+92,340), but fell from 2016 to 2021 (-7,175). The demographic weight of this population stood at 6.6% or higher from 1991 to 2016, before falling to 6.2% in 2021.
- In 2021, 75,460 people (1.8% of the population) spoke French at least regularly at home. Among those with French as one of their mother tongues, half (49.7%) spoke French regularly at home.
- In 2021, 21,770 workers living in the province (1.1%) used French at least regularly at work. Most of them worked in educational services (30.6%) or public administration (11.9%).
- Nearly 1 in 20 immigrants (4.7%) could have a conversation in French in 2021. This proportion was lower than that for the non-immigrant population (6.8%).
- Nearly three in four Albertans (74.6%) whose only first official language spoken in 2021 was French were born outside the province.
- Between 2016 and 2021, for the first time since the 1986-to-1991 period, the net interprovincial migration of the Alberta population with French as its only first official language spoken was negative.
Ability to conduct a conversation in French
Data table for Chart 1
| Knowledge of official languages | 1991 | 1996 | 2001 | 2006 | 2011 | 2016 | 2021 |
|---|---|---|---|---|---|---|---|
| number | |||||||
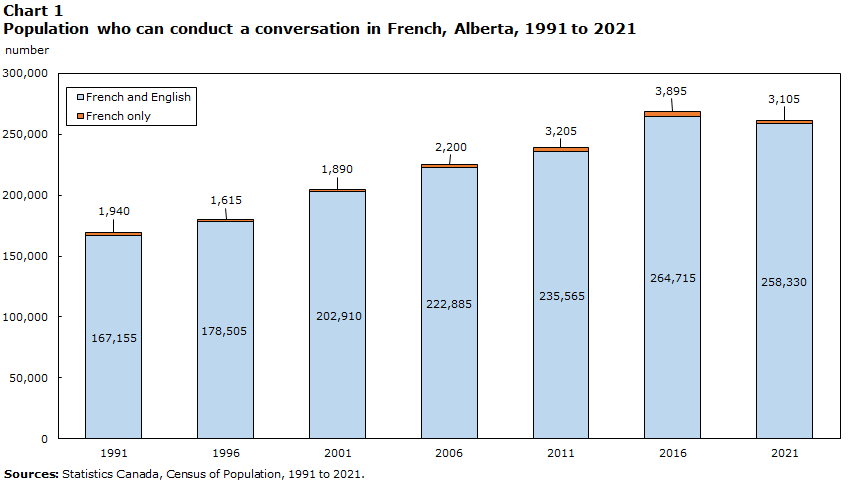
| French and English | 167,155 | 178,505 | 202,910 | 222,885 | 235,565 | 264,715 | 258,330 |
| French only | 1,940 | 1,615 | 1,890 | 2,200 | 3,205 | 3,895 | 3,105 |
| Sources: Statistics Canada, Census of Population, 1991 to 2021. | |||||||
- In 2021, 261,435 Albertans could have a conversation in French. Almost all (98.8%, or 258,330 people) could also do so in English.
- In 2021, the number of people who could have a conversation in French was higher than in 1991 (+92,340), but was down from 2016 (-7,175). This was the first time a decline in this number was observed in a census in Alberta.
- In 2021, 6.2% of Albertans could have a conversation in French. This was a 50-year low. From 1991 to 2016, the demographic weight of this population stood at 6.6% or higher.
- From 1991 to 2021, the number of Albertans who could have a conversation in French rose among residents who did not learn French first at home in their childhood (+69,085). Among these residents, the proportion of people able to speak French edged down from 4.7% in 1991 to 4.5% in 2021.
Description for Map 1
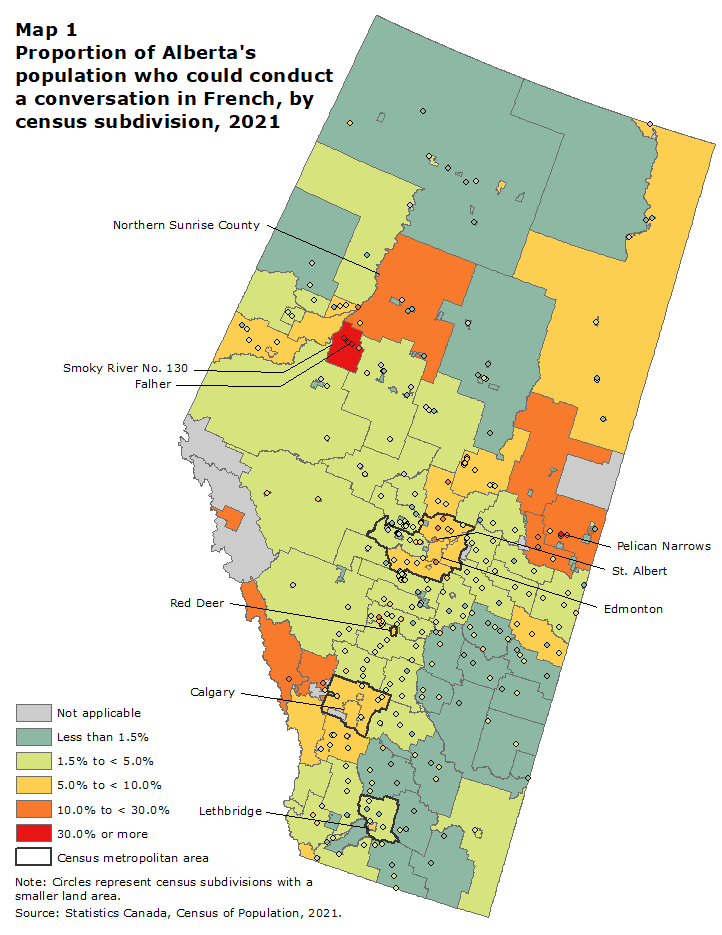
This map shows the proportion of the population able to conduct a conversation in French in each census subdivision in Alberta in 2021.
In this map we use 6 distinct colours to signify different values. Grey is used to represent areas for which no data are available. There are 36 census subdivisions in this group.
Teal is used to represent areas in which less than 1.5% of the population is able to conduct a conversation in French. There are 113 census subdivisions in this group.
Green is used to represent areas in which 1.5% to less than 5% of the population is able to conduct a conversation in French. There are 186 census subdivisions in this group.
Yellow is used to represent areas in which 5% to less than 10% of the population is able to conduct a conversation in French. There are 56 census subdivisions in this group.
Orange is used to represent areas in which 10% to less than 30% of the population is able to conduct a conversation in French. There are 27 census subdivisions in this group.
Red is used to represent areas in which 30% or more of the population is able to conduct a conversation in French. There are 5 census subdivisions in this group.
The boundaries of census subdivisions have been delimited by a gray line or by circles for those with smaller land area. Their colour was assigned according to the table below.
| Census Subdivision | Population knowing FrenchData Table for Map 1 Note 1 | |
|---|---|---|
| Code | Name | percentage |
| 4819046 | Falher | 52.8 |
| 4819041 | Smoky River No. 130 | 50.0 |
| 4819048 | Girouxville | 46.4 |
| 4819044 | Donnelly | 45.6 |
| 4812013 | Pelican Narrows | 31.3 |
| 4808027 | Sunbreaker Cove | 23.1 |
| 4817026 | Northern Sunrise County | 23.1 |
| 4812011 | Bonnyville Beach | 21.4 |
| 4811069 | Legal | 21.1 |
| 4815033 | Jasper | 20.6 |
| 4815032 | Improvement District No. 9 Banff | 20.4 |
| 4813047 | Sunset Beach | 20.0 |
| 4812020 | Horseshoe Bay | 18.8 |
| 4815023 | Canmore | 18.4 |
| 4819042 | McLennan | 18.1 |
| 4812014 | St. Paul County No. 19 | 17.8 |
| 4812018 | St. Paul | 17.8 |
| 4815015 | Bighorn No. 8 | 16.7 |
| 4815030 | Waiparous | 16.7 |
| 4811013 | Beaumont | 14.4 |
| 4813049 | Island Lake | 14.3 |
| 4815035 | Banff | 13.6 |
| 4817836 | Kapawe'no First Nation 150B | 12.5 |
| 4812002 | Cold Lake | 12.3 |
| 4812004 | Bonnyville No. 87 | 12.1 |
| 4819038 | Peace River | 11.8 |
| 4812037 | Lac la Biche County | 11.7 |
| 4813057 | West Baptiste | 11.1 |
| 4811062 | St. Albert | 10.6 |
| 4811068 | Morinville | 10.3 |
| 4812009 | Bonnyville | 10.3 |
| 4813033 | Larkspur | 10.0 |
| 4813017 | Sunrise Beach | 9.7 |
| 4815013 | Kananaskis | 9.7 |
| 4806019 | Cochrane | 9.1 |
| 4807032 | Alliance | 9.1 |
| 4814019 | Hinton | 8.5 |
| 4808013 | Norglenwold | 8.2 |
| 4813061 | Whispering Hills | 8.0 |
| 4808025 | Half Moon Bay | 7.7 |
| 4819012 | Grande Prairie | 7.7 |
| 4811059 | Sturgeon County | 7.6 |
| 4819049 | Birch Hills County | 7.6 |
| 4806012 | Okotoks | 7.4 |
| 4806021 | Airdrie | 7.3 |
| 4806014 | Rocky View County | 7.1 |
| 4808023 | Birchcliff | 7.1 |
| 4811007 | Norris Beach | 7.1 |
| 4813055 | South Baptiste | 7.1 |
| 4803016 | Cowley | 7.0 |
| 4811052 | Strathcona County | 6.7 |
| 4811061 | Edmonton | 6.7 |
| 4806016 | Calgary | 6.6 |
| 4803003 | Improvement District No. 4 Waterton | 6.5 |
| 4811038 | Seba Beach | 6.5 |
| 4811066 | Bon Accord | 6.5 |
| 4813048 | Athabasca | 6.5 |
| 4813044 | Athabasca County | 6.3 |
| 4813051 | Island Lake South | 6.3 |
| 4815027 | Ghost Lake | 6.3 |
| 4808012 | Sylvan Lake | 6.2 |
| 4811064 | Gibbons | 6.1 |
| 4816037 | Wood Buffalo | 6.1 |
| 4811049 | Spruce Grove | 6.0 |
| 4814024 | Edson | 6.0 |
| 4806001 | Foothills County | 5.9 |
| 4808042 | Parkland Beach | 5.9 |
| 4811012 | Leduc County | 5.9 |
| 4819071 | Peace No. 135 | 5.9 |
| 4811016 | Leduc | 5.8 |
| 4811048 | Stony Plain | 5.8 |
| 4811056 | Fort Saskatchewan | 5.8 |
| 4806031 | Cremona | 5.7 |
| 4807027 | White Sands | 5.7 |
| 4810014 | Hay Lakes | 5.5 |
| 4817039 | Nampa | 5.5 |
| 4808011 | Red Deer | 5.4 |
| 4805011 | Arrowwood | 5.3 |
| 4807054 | Wainwright | 5.3 |
| 4802012 | Lethbridge | 5.2 |
| 4803014 | Pincher Creek | 5.2 |
| 4808031 | Lacombe | 5.2 |
| 4810039 | Lloydminster (Part) | 5.2 |
| 4813028 | Westlock County | 5.2 |
| 4819006 | Grande Prairie County No. 1 | 5.2 |
| 4817097 | Rainbow Lake | 5.1 |
| 4807049 | Wainwright No. 61 | 5.0 |
| 4817837 | John D'Or Prairie 215 | 5.0 |
| 4803011 | Pincher Creek No. 9 | 4.9 |
| 4810018 | Tofield | 4.9 |
| 4811034 | Parkland County | 4.9 |
| 4811046 | Spring Lake | 4.9 |
| 4813030 | Whitecourt | 4.9 |
| 4808005 | Jarvis Bay | 4.8 |
| 4813045 | Mewatha Beach | 4.8 |
| 4813010 | Silver Sands | 4.7 |
| 4806009 | Turner Valley | 4.6 |
| 4806011 | Black Diamond | 4.6 |
| 4807021 | Big Valley | 4.5 |
| 4808029 | Blackfalds | 4.5 |
| 4810066 | Bruderheim | 4.5 |
| 4811005 | Poplar Bay | 4.5 |
| 4815045 | Ranchland No. 66 | 4.5 |
| 4819011 | Wembley | 4.5 |
| 4802002 | Coutts | 4.4 |
| 4812012 | Glendon | 4.4 |
| 4817021 | High Prairie | 4.4 |
| 4819074 | Grimshaw | 4.4 |
| 4806006 | High River | 4.3 |
| 4808028 | Gull Lake | 4.3 |
| 4817855 | Desmarais | 4.3 |
| 4806026 | Crossfield | 4.2 |
| 4814003 | Yellowhead County | 4.2 |
| 4809015 | Rocky Mountain House | 4.1 |
| 4810059 | Andrew | 4.1 |
| 4807004 | Czar | 4.0 |
| 4812016 | Elk Point | 4.0 |
| 4813008 | Ross Haven | 4.0 |
| 4813029 | Woodlands County | 4.0 |
| 4813053 | Bondiss | 4.0 |
| 4817076 | Northern Lights County | 4.0 |
| 4806017 | Chestermere | 3.9 |
| 4810011 | Camrose | 3.9 |
| 4813011 | Sunset Point | 3.9 |
| 4802013 | Coalhurst | 3.8 |
| 4805002 | Carmangay | 3.8 |
| 4806022 | Irricana | 3.8 |
| 4810064 | Lamont | 3.8 |
| 4812024 | Vilna | 3.8 |
| 4801006 | Medicine Hat | 3.7 |
| 4805018 | Strathmore | 3.7 |
| 4807038 | Heisler | 3.7 |
| 4808001 | Red Deer County | 3.7 |
| 4813031 | Westlock | 3.7 |
| 4817024 | Swan Hills | 3.7 |
| 4817029 | Slave Lake | 3.7 |
| 4819014 | Sexsmith | 3.7 |
| 4806029 | Carstairs | 3.6 |
| 4806034 | Olds | 3.6 |
| 4813019 | Barrhead | 3.6 |
| 4813032 | Clyde | 3.6 |
| 4817027 | Big Lakes County | 3.6 |
| 4811802 | Pigeon Lake 138A | 3.5 |
| 4819072 | Berwyn | 3.5 |
| 4802009 | Stirling | 3.4 |
| 4802034 | Brooks | 3.4 |
| 4811011 | Millet | 3.4 |
| 4813001 | Lac Ste. Anne County | 3.4 |
| 4815007 | Crowsnest Pass | 3.4 |
| 4818015 | Greenview No. 16 | 3.4 |
| 4805034 | Delia | 3.3 |
| 4805044 | Acme | 3.3 |
| 4806008 | Longview | 3.3 |
| 4807051 | Chauvin | 3.3 |
| 4802004 | Milk River | 3.2 |
| 4802016 | Barons | 3.2 |
| 4808034 | Alix | 3.2 |
| 4810038 | Paradise Valley | 3.2 |
| 4803026 | Nanton | 3.1 |
| 4806028 | Mountain View County | 3.1 |
| 4807036 | Forestburg | 3.1 |
| 4807056 | Irma | 3.1 |
| 4811008 | Ma-Me-O Beach | 3.1 |
| 4811018 | Devon | 3.1 |
| 4813005 | Val Quentin | 3.1 |
| 4817064 | Hines Creek | 3.1 |
| 4801003 | Cypress County | 3.0 |
| 4802008 | Raymond | 3.0 |
| 4808009 | Penhold | 3.0 |
| 4809002 | Clearwater County | 3.0 |
| 4810003 | Rosalind | 3.0 |
| 4811024 | Warburg | 3.0 |
| 4818018 | Valleyview | 3.0 |
| 4819058 | Spirit River | 3.0 |
| 4804019 | Youngstown | 2.9 |
| 4805004 | Champion | 2.9 |
| 4805036 | Munson | 2.9 |
| 4808008 | Innisfail | 2.9 |
| 4808022 | Lacombe County | 2.9 |
| 4810021 | Holden | 2.9 |
| 4810041 | Kitscoty | 2.9 |
| 4810061 | Mundare | 2.9 |
| 4811002 | Wetaskiwin | 2.9 |
| 4803004 | Cardston | 2.8 |
| 4805021 | Standard | 2.8 |
| 4806036 | Sundre | 2.8 |
| 4810016 | Beaver County | 2.8 |
| 4810042 | Vermilion | 2.8 |
| 4810044 | Marwayne | 2.8 |
| 4813036 | Thorhild County | 2.8 |
| 4817033 | Lesser Slave River No. 124 | 2.8 |
| 4808004 | Delburne | 2.7 |
| 4810031 | Innisfree | 2.7 |
| 4810034 | Mannville | 2.7 |
| 4811019 | Calmar | 2.7 |
| 4812815 | Cold Lake 149B | 2.7 |
| 4805012 | Wheatland County | 2.6 |
| 4806024 | Beiseker | 2.6 |
| 4807044 | Sedgewick | 2.6 |
| 4808024 | Eckville | 2.6 |
| 4811001 | Wetaskiwin County No. 10 | 2.6 |
| 4813018 | Barrhead County No. 11 | 2.6 |
| 4813046 | Boyle | 2.6 |
| 4817093 | High Level | 2.6 |
| 4805022 | Rockyford | 2.5 |
| 4805026 | Drumheller | 2.5 |
| 4810001 | Camrose County | 2.5 |
| 4812029 | Smoky Lake | 2.5 |
| 4816821 | Gregoire Lake 176 | 2.5 |
| 4801018 | Redcliff | 2.4 |
| 4802036 | Duchess | 2.4 |
| 4804022 | Consort | 2.4 |
| 4805038 | Morrin | 2.4 |
| 4806032 | Didsbury | 2.4 |
| 4807006 | Hughenden | 2.4 |
| 4808026 | Bentley | 2.4 |
| 4810002 | Bashaw | 2.4 |
| 4810058 | Lamont County | 2.4 |
| 4811065 | Redwater | 2.4 |
| 4819059 | Saddle Hills County | 2.4 |
| 4802019 | Coaldale | 2.3 |
| 4803022 | Claresholm | 2.3 |
| 4808039 | Ponoka | 2.3 |
| 4810012 | Bittern Lake | 2.3 |
| 4810036 | Vermilion River County | 2.3 |
| 4813006 | West Cove | 2.3 |
| 4819054 | Spirit River No. 133 | 2.3 |
| 4805048 | Three Hills | 2.2 |
| 4807029 | Donalda | 2.2 |
| 4819068 | Fairview | 2.2 |
| 4805006 | Vulcan | 2.1 |
| 4805046 | Linden | 2.1 |
| 4809010 | Caroline | 2.1 |
| 4810019 | Ryley | 2.1 |
| 4810028 | Vegreville | 2.1 |
| 4811031 | Drayton Valley | 2.1 |
| 4812022 | Smoky Lake County | 2.1 |
| 4818002 | Fox Creek | 2.1 |
| 4803001 | Cardston County | 2.0 |
| 4805042 | Carbon | 2.0 |
| 4808006 | Bowden | 2.0 |
| 4808038 | Ponoka County | 2.0 |
| 4810022 | Viking | 2.0 |
| 4810026 | Minburn County No. 27 | 2.0 |
| 4810062 | Chipman | 2.0 |
| 4811023 | Golden Days | 2.0 |
| 4817848 | Bushe River 207 | 2.0 |
| 4819009 | Beaverlodge | 2.0 |
| 4803018 | Willow Creek No. 26 | 1.9 |
| 4807039 | Daysland | 1.9 |
| 4807048 | Hardisty | 1.9 |
| 4808044 | Rimbey | 1.9 |
| 4810048 | Two Hills County No. 21 | 1.9 |
| 4810051 | Myrnam | 1.9 |
| 4819066 | Fairview No. 136 | 1.9 |
| 4802011 | Lethbridge County | 1.8 |
| 4803002 | Magrath | 1.8 |
| 4803006 | Glenwood | 1.8 |
| 4803024 | Stavely | 1.8 |
| 4807012 | Coronation | 1.8 |
| 4807026 | Stettler | 1.8 |
| 4808002 | Elnora | 1.8 |
| 4811032 | Brazeau County | 1.8 |
| 4813016 | Sandy Beach | 1.8 |
| 4819008 | Hythe | 1.8 |
| 4819056 | Rycroft | 1.8 |
| 4802039 | Bassano | 1.7 |
| 4804014 | Oyen | 1.7 |
| 4813002 | Mayerthorpe | 1.7 |
| 4813012 | Alberta Beach | 1.7 |
| 4813014 | Onoway | 1.6 |
| 4816810 | Fort Mckay 174 | 1.6 |
| 4802023 | Barnwell | 1.5 |
| 4805041 | Kneehill County | 1.5 |
| 4807019 | Stettler County No. 6 | 1.5 |
| 4811021 | Thorsby | 1.5 |
| 4812810 | Cold Lake 149 | 1.5 |
| 4817031 | Opportunity No. 17 | 1.5 |
| 4802006 | Warner | 1.4 |
| 4802014 | Nobleford | 1.4 |
| 4802031 | Newell County | 1.4 |
| 4802038 | Rosemary | 1.4 |
| 4803019 | Fort Macleod | 1.4 |
| 4805031 | Starland County | 1.4 |
| 4817829 | Sucker Creek 150A | 1.4 |
| 4802001 | Warner County No. 5 | 1.3 |
| 4802018 | Picture Butte | 1.3 |
| 4804011 | Hanna | 1.3 |
| 4805001 | Vulcan County | 1.3 |
| 4807014 | Castor | 1.3 |
| 4807052 | Edgerton | 1.3 |
| 4808032 | Clive | 1.3 |
| 4812828 | Beaver Lake 131 | 1.3 |
| 4817078 | Manning | 1.3 |
| 4804020 | Special Area No. 4 | 1.2 |
| 4807031 | Flagstaff County | 1.2 |
| 4810009 | Bawlf | 1.2 |
| 4802022 | Taber | 1.1 |
| 4804004 | Special Area No. 2 | 1.1 |
| 4807002 | Provost | 1.1 |
| 4807042 | Killam | 1.1 |
| 4810052 | Two Hills | 1.1 |
| 4811804 | Enoch Cree Nation | 1.1 |
| 4817853 | Little Buffalo | 1.1 |
| 4801014 | Bow Island | 1.0 |
| 4804001 | Acadia No. 34 | 1.0 |
| 4805049 | Trochu | 1.0 |
| 4807001 | Provost No. 52 | 1.0 |
| 4807011 | Paintearth County No. 18 | 1.0 |
| 4817860 | Loon Lake 235 | 1.0 |
| 4804012 | Special Area No. 3 | 0.9 |
| 4811026 | Breton | 0.9 |
| 4811805 | Alexander 134 | 0.9 |
| 4801009 | Foremost | 0.8 |
| 4802029 | Vauxhall | 0.8 |
| 4809809 | Sunchild 202 | 0.8 |
| 4817062 | Clear Hills | 0.8 |
| 4817856 | Woodland Cree 226 | 0.8 |
| 4801008 | Forty Mile County No. 8 | 0.6 |
| 4812802 | Unipouheos 121 | 0.6 |
| 4817828 | Drift Pile River 150 | 0.6 |
| 4802021 | Taber | 0.5 |
| 4812808 | White Fish Lake 128 | 0.5 |
| 4817095 | Mackenzie County | 0.5 |
| 4817845 | Hay Lake 209 | 0.5 |
| 4803802 | Blood 148 | 0.4 |
| 4811801 | Ermineskin 138 | 0.4 |
| 4818816 | Sturgeon Lake 154 | 0.4 |
| 4803801 | Piikani 147 | 0.3 |
| 4808811 | Samson 137 | 0.2 |
| 4817835 | Fox Lake 162 | 0.2 |
| 4803008 | Hill Spring | 0.0 |
| 4804006 | Empress | 0.0 |
| 4804021 | Veteran | 0.0 |
| 4805008 | Lomond | 0.0 |
| 4805009 | Milo | 0.0 |
| 4805019 | Hussar | 0.0 |
| 4805802 | Siksika 146 | 0.0 |
| 4807008 | Amisk | 0.0 |
| 4807016 | Halkirk | 0.0 |
| 4807028 | Rochon Sands | 0.0 |
| 4807046 | Lougheed | 0.0 |
| 4808813 | Montana 139 | 0.0 |
| 4809806 | O'Chiese 203 | 0.0 |
| 4810006 | Edberg | 0.0 |
| 4810805 | Makaoo (Part) 120 | 0.0 |
| 4811004 | Grandview | 0.0 |
| 4811006 | Crystal Springs | 0.0 |
| 4811009 | Silver Beach | 0.0 |
| 4811020 | Sundance Beach | 0.0 |
| 4811803 | Louis Bull 138B | 0.0 |
| 4811806 | Wabamun 133A | 0.0 |
| 4812026 | Waskatenau | 0.0 |
| 4812804 | Puskiakiwenin 122 | 0.0 |
| 4812811 | Kehewin 123 | 0.0 |
| 4812813 | Cold Lake 149A | 0.0 |
| 4812840 | Heart Lake 167 | 0.0 |
| 4813003 | Nakamun Park | 0.0 |
| 4813007 | Yellowstone | 0.0 |
| 4813013 | Birch Cove | 0.0 |
| 4813015 | South View | 0.0 |
| 4813811 | Alexis 133 | 0.0 |
| 4816051 | Improvement District No. 24 Wood Buffalo | 0.0 |
| 4816817 | Janvier 194 | 0.0 |
| 4816822 | Gregoire Lake 176A | 0.0 |
| 4816850 | Allison Bay 219 | 0.0 |
| 4816852 | Dog Head 218 | 0.0 |
| 4817817 | Jean Baptiste Gambler 183 | 0.0 |
| 4817818 | Wabasca 166 | 0.0 |
| 4817819 | Wabasca 166A | 0.0 |
| 4817821 | Wabasca 166B | 0.0 |
| 4817822 | Wabasca 166C | 0.0 |
| 4817823 | Wabasca 166D | 0.0 |
| 4817824 | Utikoomak Lake 155 | 0.0 |
| 4817827 | Utikoomak Lake 155A | 0.0 |
| 4817831 | Swan River 150E | 0.0 |
| 4817832 | Sawridge 150G | 0.0 |
| 4817838 | Tall Cree 173 | 0.0 |
| 4817840 | Tall Cree 173A | 0.0 |
| 4817842 | Boyer 164 | 0.0 |
| 4817843 | Child Lake 164A | 0.0 |
| 4817849 | Upper Hay River 212 | 0.0 |
| 4817857 | Woodland Cree 228 | 0.0 |
| 4817859 | Fort Vermilion 173B | 0.0 |
| 4817865 | Kapawe'no First Nation 229 | 0.0 |
| 4819815 | Horse Lakes 152B | 0.0 |
| 4819826 | Duncan's 151A | 0.0 |
|
||
- In 2021, in 299 of Alberta’s 387 municipalities,Note less than 5% of the population could conduct a conversation in French. Conversely, in 19 municipalities, 15% or more of the population knew French.
- The municipalities with a population of more than 500 that had the highest proportion of people who spoke French were all in the northern part of the province: Falher (52.8%), Smoky River No. 130 (50.0%) and Northern Sunrise County (23.1%).
- The municipalities that had the highest number of people who knew French were Calgary (86,180), Edmonton (67,240) and St. Albert (7,170), a municipality in the Edmonton census metropolitain area (CMA) .
French as the first official language spoken

Data table for Chart 2
| First official language spoken | 1991 | 1996 | 2001 | 2006 | 2011 | 2016 | 2021 |
|---|---|---|---|---|---|---|---|
| number | |||||||
| French only | 50,565 | 49,390 | 55,645 | 58,575 | 65,105 | 71,535 | 64,440 |
| French and English | 5,430 | 6,220 | 6,355 | 8,420 | 12,530 | 16,605 | 15,525 |
| Sources: Statistics Canada, Census of Population, 1991 to 2021. | |||||||
- In 2021, 64,440 Albertans (1.5% of the population) had French as their only first official language spoken and 15,525 residents (0.4%) had French and English as their first official languages spoken.
- In 2021, the number of people with French as their only first official language spoken was higher than in 1991 (+13,875), but down compared with 2016 (-7,095). Before this drop, this number had risen consistently from 1996 to 2016 (+22,145).
- From 1991 to 2021, the demographic weight of the population whose only first official language spoken is French fell (from 2.0% to 1.5%). In 2021, this was the lowest proportion ever observed in a census in Alberta.
- From 1991 to 2021, the number of Albertans with French and English as their first official languages spoken almost tripled, from 5,430 to 15,525.
French as a mother tongue
Data table for Chart 3
| Mother tongue | 1991 | 1996 | 2001 | 2006 | 2011 | 2016 | 2021 |
|---|---|---|---|---|---|---|---|
| number | |||||||
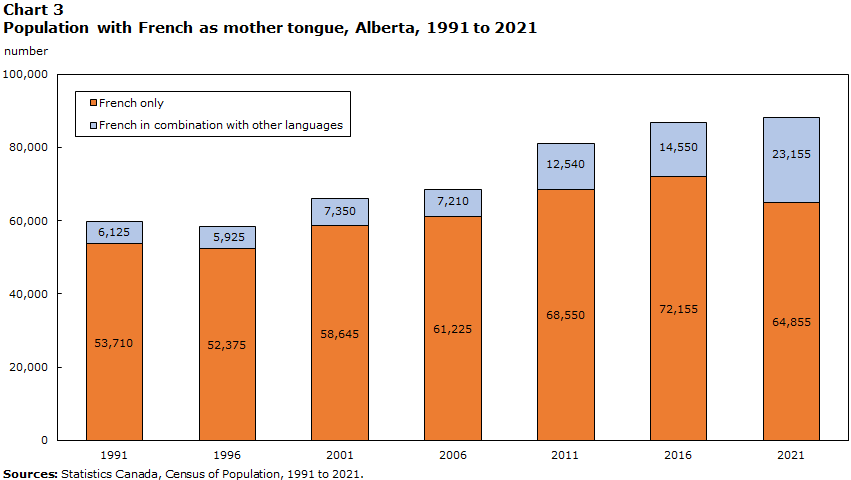
| French only | 53,710 | 52,375 | 58,645 | 61,225 | 68,550 | 72,155 | 64,855 |
| French in combination with other languages | 6,125 | 5,925 | 7,350 | 7,210 | 12,540 | 14,550 | 23,155 |
| Sources: Statistics Canada, Census of Population, 1991 to 2021. | |||||||
- In 2021, 88,010 Albertans had French as one of their mother tongues, up from 1991 (+28,170) and 2016 (+1,305). However, their demographic weight fell from 2.4% in 1991 to 2.1% in 2021.
- In 2021, 73.7% of these residents (64,855 people) had French as their only mother tongue, while 26.3% (23,155 people) had French as their mother tongue along with other languages (mainly English).
- Among people who were married or in a common-law relationship and who had French as one of their mother tongues, nearly a third (32.5%) were in a relationship with another person whose mother tongue is French.
French spoken at home
Data table for Chart 4
| Language spoken most often at home | 1991 | 1996 | 2001 | 2006 | 2011 | 2016 | 2021 |
|---|---|---|---|---|---|---|---|
| number | |||||||
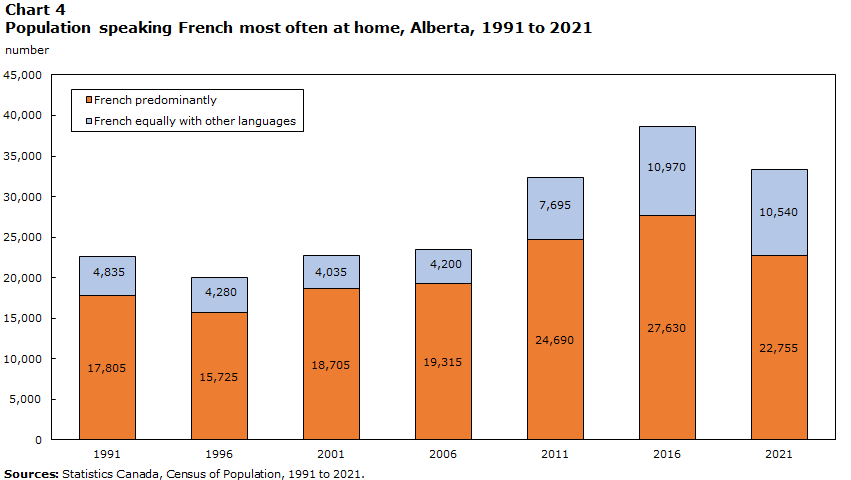
| French predominantly | 17,805 | 15,725 | 18,705 | 19,315 | 24,690 | 27,630 | 22,755 |
| French equally with other languages | 4,835 | 4,280 | 4,035 | 4,200 | 7,695 | 10,970 | 10,540 |
| Sources: Statistics Canada, Census of Population, 1991 to 2021. | |||||||
- In 2021, 75,460 Albertans (1.8% of the population) spoke French at least regularly at home.
- Of these, less than half (44.1%, or 33,295 people) spoke French most often at home, predominantly or equally with other languages. This was down from 2016 (-5,310), but higher than in 1991 (+10,650).
- Moreover, 42,165 people (55.9%) spoke French at home as a secondary language while speaking another language more often (generally English).
- Among people with French as their mother tongue, alone or with other languages:
- Roughly half (49.7%, or 43,780 people) spoke French at least regularly at home in 2021. However, this rate varied by age, ranging from 77.8% among those under age 15 to 38.3% among those aged 45 and older.
- Close to a third (32.0%, or 28,120 people) spoke French most often at home, predominantly or equally with other languages in 2021. Compared with 1991, their number increased (+7,860), but their proportion decreased (from 33.9% to 32.0%).
- Among Alberta residents whose mother tongue is not French, 31,680 (0.8%) spoke French regularly at home.
- The vast majority of these residents (83.7%, or 26,510 people) spoke French at home as a secondary language while speaking another language more often (generally English).
French used at work
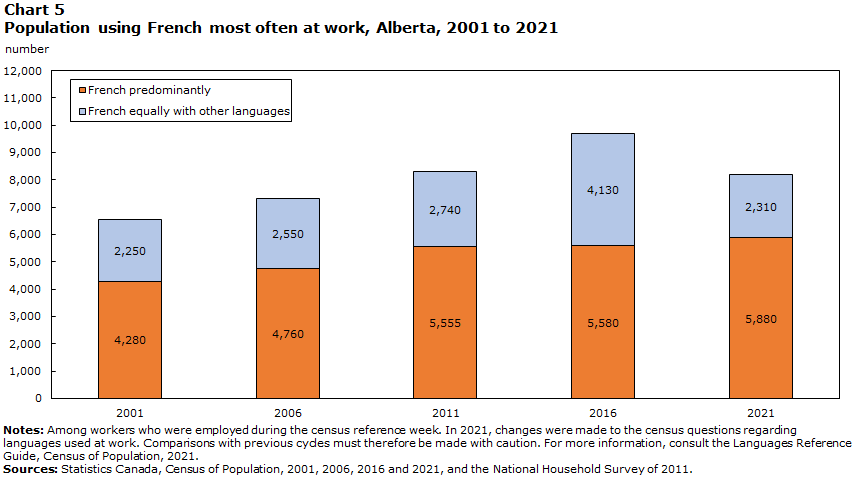
Data table for Chart 5
| Language used most often at work | 2001 | 2006 | 2011 | 2016 | 2021 |
|---|---|---|---|---|---|
| number | |||||
| French predominantly | 4,280 | 4,760 | 5,555 | 5,580 | 5,880 |
| French equally with other languages | 2,250 | 2,550 | 2,740 | 4,130 | 2,310 |
|
Notes: Among workers who were employed during the census reference week. In 2021, changes were made to the census questions regarding languages used at work. Comparisons with previous cycles must therefore be made with caution. For more information, consult the Languages Reference Guide, Census of Population, 2021. Sources: Statistics Canada, Census of Population, 2001, 2006, 2016 and 2021, and the National Household Survey of 2011. |
|||||
- In 2021, 21,770 Albertans used French at least regularly at work. This represents 1.1% of the province’s workers.Note
- In Alberta, 8,190 people used French most often at work, predominantly or equally with other languages, accounting for 0.4% of the province’s workers.
- The number of workers who used French most often at work rose from 6,530 in 2001 to 9,710 in 2016, then fell from 2016 to 2021 (-1,520).
- In 2021, among workers who used French at least regularly at work, most worked in educational services (6,655 people, or 30.6%), public administration (2,600 people, or 11.9%) or health care and social assistance (2,045 people, or 9.4%).Note
- Among workers who spoke French most often at home, predominantly or equally with other languages, 38.3% also used French regularly at work in 2021.
- Nearly two in five workers (38.7%) who used French regularly at work lived in the Edmonton CMA and more than a third (36.3%) lived in the Calgary CMA.
Instruction in French at the primary and secondary levels
- In 2021, 67,145 (6.9%) of the 971,390 children under 18 living in the province were eligibleNote for instruction in French at the primary and secondary levels.
- Nearly two in five eligible children (37.4%, or 25,140) lived in the Edmonton CMA.
- A similar proportion of eligible children (35.7%, or 23,980) lived in the Calgary CMA.
- In Alberta, 105,565 people attended or had already attended a regular French program in a French-language school in Canada, representing 2.7% of the population aged 5 and older.
- Of those who had never attended a French-language school, 187,705 (4.8%) had attended a French immersion program in an English-language school.
- Among school-aged childrenNote who were eligible for instruction in French, 24,675 (49.6%) were attending or had already attended a regular French program in a French-language school in Canada.
French among immigrants
- In 2021, the proportions of recentNote immigrants and establishedNote immigrants living in Alberta who could have a conversation in French (3.5% and 5.0%, respectively) were lower than the proportion for the non-immigrant population (6.8%).
- The proportion of immigrants who spoke French at least regularly at home (1.9%) was similar to that of the non-immigrant population (1.7%).
- The proportion of immigrants who had French as their only first official language spoken (1.3%) was slightly below that of the non-immigrant population (1.6%). However, the proportion of immigrants who had French and English as their first official languages spoken (1.1%) was higher than the proportion of the non-immigrant population (0.1%).
Mobility and birthplace of the French-speaking population

Data table for Chart 6
| Place of birth | Percent |
|---|---|
| Alberta | 25.4 |
| Quebec | 30.2 |
| New Brunswick |
5.6 |
| Ontario | 8.4 |
| Elsewhere in Canada | 8.0 |
| Outside Canada | 22.5 |
| Source: Statistics Canada, Census of Population, 2021. | |
- In 2021, among Albertans whose only first official language spoken is French, roughly a quarter (25.4%, or 16,200 people) were born in the province.
- Just over half (52.1%, or 33,280 people) were born in another province or territory, with the majority coming from Quebec (30.2%, or 19,250 people), Ontario (8.4%, or 5,375 people) or New Brunswick (5.6%, or 3,575 people).
- More than one in five (22.5%, or 14,345 people) were born abroad, mainly in Africa (13.5%), specifically in the Democratic Republic of the Congo (2.7%), Cameroon (1.8%) or Côte d’Ivoire (1.4%), or in metropolitan France (3.8%).
- From 2016 to 2021, the net interprovincial migration of the Alberta population whose only first official language spoken is French was negative (-3,515).
- While 5,865 people with French as their only first official language spoken moved to Alberta from another province or territory from 2016 to 2021, 9,380 people left the province during the same period, with most settling in Quebec (50.2%) or Ontario (19.8%).
- For the first time since the 1986-to-1991 period, the net interprovincial migration of the Alberta population with French as its only first official language spoken was negative.
Appendix
| Indicator | 1991 | 1996 | 2001 | 2006 | 2011 | 2016 | 2021 |
|---|---|---|---|---|---|---|---|
| percent | |||||||
| French as first official language spokenTable 1 Note 1 | 2.2 | 2.1 | 2.1 | 2.1 | 2.2 | 2.2 | 1.9 |
| French only | 2.0 | 1.9 | 1.9 | 1.8 | 1.8 | 1.8 | 1.5 |
| French and English | 0.2 | 0.2 | 0.2 | 0.3 | 0.3 | 0.4 | 0.4 |
| Knowledge of FrenchTable 1 Note 2 | 6.7 | 6.7 | 7.0 | 6.9 | 6.6 | 6.7 | 6.2 |
| French only | 0.1 | 0.1 | 0.1 | 0.1 | 0.1 | 0.1 | 0.1 |
| French and English | 6.6 | 6.7 | 6.9 | 6.8 | 6.5 | 6.6 | 6.1 |
| French as mother tongue | 2.4 | 2.2 | 2.2 | 2.1 | 2.2 | 2.2 | 2.1 |
| French only | 2.1 | 2.0 | 2.0 | 1.9 | 1.9 | 1.8 | 1.5 |
| French in combination with other languages | 0.2 | 0.2 | 0.2 | 0.2 | 0.3 | 0.4 | 0.5 |
| French spoken most often at home | 0.9 | 0.7 | 0.8 | 0.7 | 0.9 | 1.0 | 0.8 |
| French predominantly | 0.7 | 0.6 | 0.6 | 0.6 | 0.7 | 0.7 | 0.5 |
| French equally with other languages | 0.2 | 0.2 | 0.1 | 0.1 | 0.2 | 0.3 | 0.2 |
| French used most often at workTable 1 Note 3 | Note ..: not available for a specific reference period | Note ..: not available for a specific reference period | 0.4 | 0.4 | 0.4 | 0.5 | 0.4 |
| French predominantly | Note ..: not available for a specific reference period | Note ..: not available for a specific reference period | 0.3 | 0.3 | 0.3 | 0.3 | 0.3 |
| French equally with other languages | Note ..: not available for a specific reference period | Note ..: not available for a specific reference period | 0.1 | 0.1 | 0.1 | 0.2 | 0.1 |
.. not available for a specific reference period
|
|||||||
| FrequencyTable 2 Note 2 | French used at workTable 2 Note 1 | French spoken at home | ||
|---|---|---|---|---|
| number | percent | number | percent | |
| Total population | 2,030,730 | 100.0 | 4,221,835 | 100.0 |
| Only | 3,140 | 0.2 | 15,490 | 0.4 |
| Mostly | 2,740 | 0.1 | 7,265 | 0.2 |
| Equally | 2,310 | 0.1 | 10,540 | 0.2 |
| Regularly | 13,580 | 0.7 | 42,165 | 1.0 |
| No mention | 2,008,960 | 98.9 | 4,146,375 | 98.2 |
|
||||
| Selection of industry sectors | Use of French at work | |||
|---|---|---|---|---|
| At least regularlyTable 3 Note 2 | Most often | |||
| number | percent | number | percent | |
| Total | 21,770 | 100.0 | 8,190 | 100.0 |
| Construction | 1,105 | 5.1 | 430 | 5.3 |
| Retail trade | 1,080 | 5.0 | 175 | 2.1 |
| Transportation and warehousing | 885 | 4.1 | 210 | 2.6 |
| Finance and insurance | 765 | 3.5 | 190 | 2.3 |
| Professional, scientific and technical services | 1,615 | 7.4 | 465 | 5.7 |
| Administrative and support, waste management and remediation services | 810 | 3.7 | 265 | 3.2 |
| Educational services | 6,655 | 30.6 | 4,385 | 53.5 |
| Health care and social assistance | 2,045 | 9.4 | 535 | 6.5 |
| Other services (except public administration) | 760 | 3.5 | 295 | 3.6 |
| Public administration | 2,600 | 11.9 | 425 | 5.2 |
| Other sectors | 3,460 | 15.9 | 810 | 9.9 |
|
||||
| Age group | Mother tongue | |||||
|---|---|---|---|---|---|---|
| Total | FrenchTable 4 Note 1 | Other languages | ||||
| number | percent | number | percent | number | percent | |
| Total | 75,460 | 1.8 | 43,780 | 49.7 | 31,680 | 0.8 |
| 0 to 14 years | 18,415 | 2.3 | 8,630 | 77.8 | 9,790 | 1.2 |
| 15 to 44 years | 33,270 | 1.9 | 18,850 | 54.8 | 14,415 | 0.8 |
| 45 years and older | 23,780 | 1.4 | 16,305 | 38.3 | 7,480 | 0.5 |
|
||||||
| Immigration status and period of immigration | Knowledge of FrenchTable 5 Note 1 | French spoken at homeTable 5 Note 1 | First official language spoken | |||||
|---|---|---|---|---|---|---|---|---|
| French only | French and English | |||||||
| number | percent | number | percent | number | percent | number | percent | |
| Total | 260,415 | 6.2 | 73,580 | 1.8 | 63,820 | 1.5 | 15,190 | 0.4 |
| Non-immigrants | 212,390 | 6.8 | 53,070 | 1.7 | 49,935 | 1.6 | 4,460 | 0.1 |
| Immigrants | 45,325 | 4.7 | 18,890 | 1.9 | 12,605 | 1.3 | 10,235 | 1.1 |
| Recent immigrantsTable 5 Note 2 | 6,805 | 3.5 | 3,695 | 1.9 | 2,800 | 1.4 | 1,550 | 0.8 |
| Established immigrantsTable 5 Note 3 | 38,515 | 5.0 | 15,200 | 2.0 | 9,800 | 1.3 | 8,690 | 1.1 |
| 2011 to 2015 | 9,270 | 4.8 | 4,370 | 2.3 | 2,910 | 1.5 | 2,430 | 1.3 |
| 2001 to 2010 | 14,375 | 6.0 | 6,070 | 2.5 | 3,640 | 1.5 | 4,235 | 1.8 |
| 1991 to 2000 | 5,655 | 4.5 | 2,350 | 1.9 | 1,555 | 1.2 | 1,180 | 0.9 |
| 1980 to 1990 | 3,495 | 3.8 | 1,055 | 1.2 | 655 | 0.7 | 480 | 0.5 |
| Before 1980 | 5,725 | 4.5 | 1,355 | 1.1 | 1,045 | 0.8 | 365 | 0.3 |
| Non-permanent residents | 2,700 | 4.2 | 1,615 | 2.5 | 1,280 | 2.0 | 490 | 0.8 |
|
||||||||
| Census Metropolitan Area | Knowledge of FrenchTable 6 Note 1 | French spoken at homeTable 6 Note 1 | First official language spoken | |||||
|---|---|---|---|---|---|---|---|---|
| French only | French and English | |||||||
| number | percent | number | percent | number | percent | number | percent | |
| Total - Province | 261,440 | 6.2 | 75,465 | 1.8 | 64,440 | 1.5 | 15,525 | 0.4 |
| Calgary | 98,455 | 6.7 | 26,615 | 1.8 | 19,495 | 1.3 | 7,100 | 0.5 |
| Edmonton | 96,805 | 6.9 | 30,405 | 2.2 | 25,175 | 1.8 | 6,550 | 0.5 |
| Lethbridge | 5,590 | 4.6 | 1,295 | 1.1 | 905 | 0.7 | 235 | 0.2 |
| Red Deer | 5,310 | 5.4 | 1,280 | 1.3 | 1,110 | 1.1 | 200 | 0.2 |
|
||||||||
- Date modified: