
Ethnicity, Language and Immigration Thematic Series
Key facts on the French language in Manitoba in 2021
Skip to text
Text begins
This fact sheet gives an overview of the situation of French in Manitoba in 2021. It begins by providing information on the changes in the number and proportion of the population who can have a conversation in French, whose first official language spoken is French, whose mother tongue is French, and who speak French at home or use French at work. Next, it presents information on French‑language instruction in primary and secondary schools, on French spoken among recent and established immigrants, as well as on the mobility and place of birth of individuals whose first official language spoken is French. Additional data on these topics can be found in the appendix.
The information presented in this fact sheet comes from the Census of Population. To learn more about census concepts and the historical comparability of data, please refer to the 2021 Census of Population Languages Reference Guide and the Instruction in the Minority Official Language Reference Guide.
Highlights
- In 2021, 112,115 Manitobans could have a conversation in French. This is up from 2016 (+2,175) and 1991 (+11,410). However, the demographic weight of this population dropped from 9.3% in 1991 to 8.4% in 2021.
- In 2021, 37,750 people (2.8% of the population) spoke French at least regularly at home. Among those with French as one of their mother tongues, more than half (55.0%) spoke French regularly at home.
- In Manitoba, 16,395 workers (2.6%) used French at least regularly at work in 2021. Many of them worked in educational services (32.2%) or in health care and social assistance (14.4%).
- About 1 in 25 immigrants (4.1%) could have a conversation in French in 2021. This proportion was lower than that of the non-immigrant population (9.8%).
- Nearly three in four Manitobans (74.4%) whose only first official language spoken was French in 2021 were born in that province.
Ability to conduct a conversation in French

Data table for Chart 1
| Knowledge of official languages | 1991 | 1996 | 2001 | 2006 | 2011 | 2016 | 2021 |
|---|---|---|---|---|---|---|---|
| number | |||||||
| French and English | 98,800 | 103,140 | 102,840 | 103,525 | 103,140 | 108,455 | 110,435 |
| French only | 1,905 | 1,495 | 1,245 | 1,930 | 1,490 | 1,480 | 1,685 |
| Sources: Statistics Canada, Census of Population, 1991 to 2021. | |||||||
- In 2021, 112,115 Manitobans could have a conversation in French. Almost all (98.5%, or 110,435 people) could also do so in English.
- The number of people in the province who could conduct a conversation in French has been rising since 1991 (+11,410). From 2016 to 2021, this number has continued to grow (+2,175), reaching an all-time high in 2021.
- In 2021, 8.4% of the Manitoban population could have a conversation in French, a 30-year low. The demographic weight of this population has fallen consistently since the peak observed in 1996 (9.5%).
- From 1991 to 2021, the number and proportion of Manitobans able to conduct a conversation in French increased among Manitobans who did not learn French first at home in their childhood: while 52,105 (5.1%) could have a conversation in French in 1991, this rose to 70,330 (5.5%) in 2021.

Description for Map 1
This map shows the proportion of the population able to conduct a conversation in French in each census subdivision in Manitoba in 2021.
In this map we use 6 distinct colours to signify different values. Grey is used to represent areas for which no data are available. There are 25 census subdivisions in this group.
Teal is used to represent areas in which less than 5% of the population is able to conduct a conversation in French. There are 150 census subdivisions in this group.
Green is used to represent areas in which 5% to less than 10% of the population is able to conduct a conversation in French. There are 40 census subdivisions in this group.
Yellow is used to represent areas in which 10% to less than 25% of the population is able to conduct a conversation in French. There are 13 census subdivisions in this group.
Orange is used to represent areas in which 25% to less than 50% of the population is able to conduct a conversation in French. There are 10 census subdivisions in this group.
Red is used to represent areas in which 50% or more of the population is able to conduct a conversation in French. There is 1 census subdivision in this group.
The boundaries of census subdivisions have been delimited by a gray line or by circles for those with smaller land area. Their colour was assigned according to the table below.
| Census Subdivision | Population knowing FrenchData Table for Map 1 Note 1 |
|---|---|
| percentage | |
| St-Pierre-Jolys | 59.9 |
| Montcalm | 43.4 |
| De Salaberry | 41.2 |
| Lorne | 41.2 |
| Ste. Anne | 35.2 |
| Ritchot | 33.5 |
| Ellice-Archie | 33.5 |
| St. Laurent | 28.8 |
| Ste. Rose | 28.1 |
| Grey | 26.4 |
| Taché | 25.2 |
| Ste. Anne | 23.2 |
| Norfolk-Treherne | 21.2 |
| La Broquerie | 17.5 |
| Victoria Beach | 15.9 |
| Powerview-Pine Falls | 14.4 |
| Alexander | 13.9 |
| St. François Xavier | 13.8 |
| Cartier | 13.0 |
| Cornwallis | 11.7 |
| Piney | 11.4 |
| Buffalo Point 36 | 11.4 |
| Morris | 10.3 |
| Niverville | 10.2 |
| Winnipeg | 9.8 |
| Lakeshore | 9.7 |
| Division No. 17, Unorganized | 9.5 |
| Reynolds | 9.3 |
| Springfield | 9.3 |
| Emerson | 9.1 |
| Macdonald | 9.0 |
| Headingley | 8.3 |
| East St. Paul | 8.1 |
| McCreary | 7.6 |
| Stonewall | 7.5 |
| Pinawa | 7.3 |
| Victoria | 7.2 |
| Lac du Bonnet | 7.1 |
| Beausejour | 7.1 |
| Division No. 1, Unorganized | 6.9 |
| Brokenhead | 6.7 |
| Division No. 23, Unorganized | 6.7 |
| Morris | 6.6 |
| West St. Paul | 6.5 |
| Division No. 18, Unorganized, East Part | 6.5 |
| The Pas | 6.1 |
| Portage la Prairie | 6.0 |
| St. Clements | 6.0 |
| Dauphin | 6.0 |
| Thompson | 5.9 |
| Lac du Bonnet | 5.8 |
| Morden | 5.8 |
| Churchill | 5.8 |
| Dufferin | 5.7 |
| Dunnottar | 5.6 |
| Division No. 21, Unorganized | 5.6 |
| Portage la Prairie | 5.5 |
| Kelsey | 5.5 |
| Stuartburn | 5.4 |
| Flin Flon (Part) | 5.4 |
| Argyle | 5.2 |
| Oakland-Wawanesa | 5.2 |
| Selkirk | 5.2 |
| Whitehead | 5.1 |
| Brandon | 4.9 |
| St. Andrews | 4.9 |
| Harrison Park | 4.9 |
| Carman | 4.8 |
| Rockwood | 4.8 |
| Winnipeg Beach | 4.5 |
| Steinbach | 4.4 |
| Dauphin | 4.4 |
| Woodlands | 4.2 |
| Gimli | 4.2 |
| Hanover | 4.1 |
| Altona | 4.0 |
| Sifton | 4.0 |
| Elton | 3.9 |
| Russell-Binscarth | 3.9 |
| Prairie View | 3.8 |
| Rossburn | 3.7 |
| Pembina | 3.6 |
| Clanwilliam | 3.5 |
| Whitemouth | 3.4 |
| Prairie Lakes | 3.4 |
| Minnedosa | 3.4 |
| Mountain (South) | 3.4 |
| Black Sturgeon | 3.4 |
| Riverdale | 3.3 |
| Fisher | 3.3 |
| Division No. 19, Unorganized | 3.2 |
| Snow Lake | 3.2 |
| Coldwell | 3.1 |
| North Cypress-Langford | 3.0 |
| Yellowhead | 3.0 |
| Armstrong | 3.0 |
| Division No. 22, Unorganized | 3.0 |
| Gillam | 3.0 |
| Swan Valley West | 2.9 |
| Leaf Rapids | 2.9 |
| Rosser | 2.8 |
| Riding Mountain West | 2.8 |
| Swan River | 2.8 |
| Glenboro-South Cypress | 2.7 |
| Roland | 2.6 |
| Louise | 2.6 |
| Teulon | 2.6 |
| Alonsa | 2.5 |
| West Interlake | 2.5 |
| Souris-Glenwood | 2.4 |
| North Norfolk | 2.4 |
| Thompson | 2.3 |
| Virden | 2.3 |
| Oakview | 2.3 |
| Hillsburg-Roblin-Shell River | 2.3 |
| Wallace-Woodworth | 2.2 |
| Carberry | 2.2 |
| Minto-Odanah | 2.2 |
| Gilbert Plains | 2.2 |
| Grandview | 2.2 |
| Pipestone | 2.1 |
| Hamiota | 2.1 |
| Grahamdale | 2.0 |
| Killarney- Turtle Mountain | 1.9 |
| Grassland | 1.9 |
| Minitonas-Bowsman | 1.9 |
| Boissevain-Morton | 1.8 |
| Mossey River | 1.8 |
| Rhineland | 1.7 |
| Winkler | 1.7 |
| Deloraine-Winchester | 1.7 |
| Fort Alexander 3 | 1.7 |
| Rosedale | 1.6 |
| Ethelbert | 1.6 |
| Brenda-Waskada | 1.5 |
| Stanley | 1.4 |
| Bifrost-Riverton | 1.4 |
| Two Borders | 1.3 |
| Glenella | 1.3 |
| Neepawa | 1.3 |
| Rolling River 67 | 1.3 |
| Arborg | 1.2 |
| Moose Lake 31A | 1.2 |
| Cartwright-Roblin | 1.1 |
| Brokenhead 4 | 1.1 |
| Dog Creek 46 | 1.1 |
| Melita | 1.0 |
| Black River 9 | 1.0 |
| Roseau River 2 | 0.9 |
| Hole or Hollow Water 10 | 0.9 |
| Mountain (North) | 0.9 |
| Lynn Lake | 0.9 |
| WestLake-Gladstone | 0.8 |
| Waywayseecappo First Nation | 0.7 |
| Pine Creek 66A | 0.7 |
| God's Lake 23 | 0.7 |
| Nelson House 170 | 0.6 |
| Obushkudayang | 0.5 |
| Cross Lake 19A | 0.5 |
| Wasagamack | 0.5 |
| Sandy Bay 5 | 0.4 |
| Long Plain 6 | 0.4 |
| Berens River 13 | 0.4 |
| Norway House 17 | 0.4 |
| Split Lake 171 | 0.4 |
| Peguis 1B | 0.3 |
| Cross Lake 19 | 0.3 |
| Opaskwayak Cree Nation 21E | 0.2 |
| St. Theresa Point | 0.1 |
| Roseau Rapids 2A | 0.0 |
| Canupawakpa Dakota First Nation (Oak Lake 59) | 0.0 |
| Sioux Valley Dakota Nation | 0.0 |
| Dakota Plains 6A | 0.0 |
| Dakota Tipi 1 | 0.0 |
| Birdtail Creek 57 | 0.0 |
| Keeseekoowenin 61 | 0.0 |
| Rolling River 67B | 0.0 |
| Gambler 63 (Part) | 0.0 |
| Valley River 63A | 0.0 |
| Ebb and Flow 52 | 0.0 |
| Little Saskatchewan 48 | 0.0 |
| Fairford 50 | 0.0 |
| Shoal River 65B | 0.0 |
| Bloodvein 12 | 0.0 |
| Fisher River 44 | 0.0 |
| Fisher River 44A | 0.0 |
| Jackhead 43 | 0.0 |
| Dauphin River 48A | 0.0 |
| The Narrows 49 | 0.0 |
| Crane River 51 | 0.0 |
| Waterhen 45 | 0.0 |
| Shoal River Indian Reserve 65A | 0.0 |
| Wuskwi Sipihk First Nation 2 | 0.0 |
| Division No. 20, Unorganized, South Part | 0.0 |
| Grand Rapids | 0.0 |
| Grand Rapids 33 | 0.0 |
| Chemawawin 2 | 0.0 |
| Opaskwayak Cree Nation 21A | 0.0 |
| Opaskwayak Cree Nation 21B | 0.0 |
| Opaskwayak Cree Nation 21I | 0.0 |
| Moose Lake 31D | 0.0 |
| Red Sucker Lake 1976A | 0.0 |
| Garden Hill First Nation | 0.0 |
| God's River 86A | 0.0 |
| Red Sucker Lake 1976 | 0.0 |
| Ilford | 0.0 |
| York Landing | 0.0 |
| Cross Lake 19E | 0.0 |
| Mooseocoot | 0.0 |
| A Kwis Ki Mahka | 0.0 |
| Fox Lake 2 | 0.0 |
| South Indian Lake | 0.0 |
| O-Pipon-Na-Piwin Cree Nation 1 | 0.0 |
| Lac Brochet 197A | 0.0 |
|
|
- In 2021, in 150 of Manitoba’s 214 municipalities,Note less than 5% of the population could conduct a conversation in French. Conversely, in 13 municipalities, 20% or more of the population could speak French.
- The municipalities with a population of more than 500 that had the largest proportion of people who knew French were all south of the provincial capital, Winnipeg: St-Pierre-Jolys (59.9%), Montcalm (43.4%) and De Salaberry (41.2%).
- The municipalities that had the largest number of people who knew French are all in the Winnipeg census metropolitan area (CMA): Winnipeg (72,955), Taché (3,005) and Ritchot (2,505).
French as first official language spoken

Data table for Chart 2
| First official language spoken | 1991 | 1996 | 2001 | 2006 | 2011 | 2016 | 2021 |
|---|---|---|---|---|---|---|---|
| number | |||||||
| French only | 46,665 | 45,570 | 42,410 | 42,130 | 39,995 | 39,205 | 36,195 |
| French and English | 2,265 | 2,010 | 1,940 | 1,985 | 2,740 | 3,545 | 4,365 |
| Sources: Statistics Canada, Census of Population, 1991 to 2021. | |||||||
- In 2021, 36,195 Manitobans had French as their only first official language spoken (2.7% of the population) and 4,365 had French and English as their first official languages spoken (0.3% of the population).
- From 1991 to 2021, the number of people who had French as their first official language spoken fell steadily (-10,470), as did their demographic weight, which decreased from 4.3% to 2.7%. In 2021, both the number and proportion were the lowest ever recorded in a census in Manitoba.
- The number of Manitobans with French and English as their first official languages spoken increased from 1991 to 2021 (+2,100).
French as a mother tongue
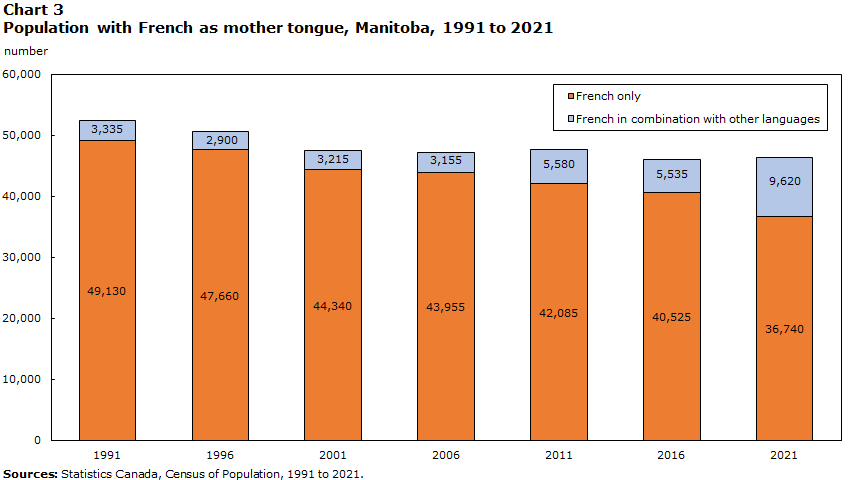
Data table for Chart 3
| Mother tongue | 1991 | 1996 | 2001 | 2006 | 2011 | 2016 | 2021 |
|---|---|---|---|---|---|---|---|
| number | |||||||
| French only | 49,130 | 47,660 | 44,340 | 43,955 | 42,085 | 40,525 | 36,740 |
| French in combination with other languages | 3,335 | 2,900 | 3,215 | 3,155 | 5,580 | 5,535 | 9,620 |
| Sources: Statistics Canada, Census of Population, 1991 to 2021. | |||||||
- In 2021, 46,360 Manitobans (3.5% of the population) had French as one of their mother tongues, down from 1991 (52,465 people, or 4.9%). Compared with 2016, the number of people rose slightly (+300), but their proportion continued to fall (from 3.7% to 3.5%).
- In 2021, 79.2% of these residents (36,740 people) had French as their only mother tongue and 20.8% (9,620 people) had French as their mother tongue along with other languages (mainly English).
- Among people who were married or in a common-law union and who had French as one of their mother tongues, roughly two in five (40.1%) were in a relationship with another person whose mother tongue is French.
French spoken at home

Data table for Chart 4
| Language spoken most often at home | 1991 | 1996 | 2001 | 2006 | 2011 | 2016 | 2021 |
|---|---|---|---|---|---|---|---|
| number | |||||||
| French predominantly | 23,545 | 22,015 | 19,685 | 19,515 | 17,950 | 16,870 | 14,715 |
| French equally with other languages | 3,025 | 2,255 | 2,440 | 2,035 | 3,600 | 4,390 | 5,285 |
| Sources: Statistics Canada, Census of Population, 1991 to 2021. | |||||||
- In 2021, 37,750 Manitobans (2.8% of the population) spoke French at least regularly at home.
- Of these, more than half (53.0%, or 19,995 people) spoke French most often at home, predominantly or equally with other languages. This number was down from 1991 (-6,575) and 2016 (-1,260).
- Moreover, 17,755 people (47.0%) spoke French at home as a secondary language while speaking another language more often (generally English).
- Among people with French as their mother tongue, alone or with other languages:
- More than half (55.0%, or 25,480 people) spoke French at least regularly at home in 2021. However, this rate varied by age, ranging from 82.1% among those under age 15 to 45.0% among those aged 45 and older.
- Nearly two in five (38.5%, or 17,845 people) spoke French most often at home, predominantly or equally with other languages, down from 1991 (48.1%, or 25,260 people).
- Among Manitoba residents whose mother tongue is not French, 12,275 (1.0%) spoke French regularly at home.
- The vast majority of these residents (82.4%, or 10,120 people) spoke French at home as a secondary language and while speaking another language more often (generally English).
French used at work

Data table for Chart 5
| Language used most often at work | 2001 | 2006 | 2011 | 2016 | 2021 |
|---|---|---|---|---|---|
| number | |||||
| French predominantly | 5,610 | 6,415 | 5,265 | 5,685 | 6,060 |
| French equally with other languages | 1,555 | 1,540 | 1,945 | 2,375 | 1,920 |
|
Notes: Among workers who were employed during the census reference week. In 2021, changes were made to the census questions regarding languages used at work. Comparisons with previous cycles must therefore be made with caution. For more information, consult the Languages Reference Guide, Census of Population, 2021. Sources: Statistics Canada, Census of Population, 2001, 2006, 2016 and 2021, and the National Household Survey of 2011. |
|||||
- In 2021, 16,395 Manitobans used French at least regularly at work. This represents 2.6% of the province’s workers.Note
- In Manitoba, 7,975 people used French most often at work in 2021, predominantly or equally with other languages, accounting for 1.3% of the province’s workers.
- The number of workers who used French most often at work rose from 2001 (+810), but remained relatively stable from 2016 to 2021 (-80).
- In 2021, among workers who use French at least regularly at work, most worked in educational services (5,285 people, or 32.2%), health care and social assistance (2,365 people, or 14.4%), or public administration (2,170 people, or 13.2%).Note
- Among workers who spoke French most often at home, predominantly or equally with other languages, 63.8% also used it regularly at work in 2021.
- In 2021, just over three in four workers (75.1%) who used French regularly at work lived in the Winnipeg CMA.
Instruction in French at the primary and secondary levels
- In 2021, 30,470 (10.1%) of the 302,080 children under 18 living in the province were eligibleNote for instruction in French at the primary and secondary levels.
- Just over 7 in 10 eligible children (70.8%, or 21,580 children) lived in the Winnipeg CMA.
- In Manitoba, 54,070 people attended or had already attended a regular French program in a French-language school in Canada, representing 4.4% of the population aged 5 and older.
- Of those who had never attended a French-language school, 75,380 (6.2%) had attended a French immersion program in an English-language school.
- Among school-aged childrenNote who were eligible for instruction in French, 14,755 (64.0%) were attending or had already attended a regular French program in a French-language school in Canada.
French among immigrants
- In 2021, the proportions of recentNote immigrants and establishedNote immigrants living in Manitoba who could have a conversation in French (4.4% and 4.0%, respectively) were lower than the proportion among the non-immigrant population (9.8%).
- The proportions of recent immigrants and established immigrants who spoke French at least regularly at home (2.8% and 1.8%, respectively) were lower than for the non-immigrant population (3.1%).
- The proportion of immigrants who had French as their only first official language spoken (1.4%) was lower than that of the non-immigrant population (3.1%). However, the proportion of immigrants who had French and English as their first official languages spoken (0.8%) was higher than the proportion for the non-immigrant population (0.2%).
Mobility and birthplace of the French-speaking population

Data table for Chart 6
| Place of birth | Percent |
|---|---|
| Manitoba | 74.4 |
| Quebec | 6.9 |
| Ontario | 2.8 |
| Saskatchewan | 1.7 |
| Elsewhere in Canada | 2.4 |
| Outside Canada | 11.8 |
| Source: Statistics Canada, Census of Population, 2021. | |
- In 2021, among Manitobans whose only first official language spoken is French, about three-quarters (74.4%, or 26,530 people) were born in the province.
- Nearly one in seven (13.8%, or 4,905 people) were born in another province or territory, with the majority coming from Quebec (6.9%, or 2,455 people) or Ontario (2.8%, or 990 people).
- Close to one in eight (11.8%, or 4,220 people) were born abroad, specifically in Africa (7.8%), including the Democratic Republic of the Congo (2.2%), or in metropolitan France (2.4%).
- From 2016 to 2021, the net interprovincial migration of the Manitoba population whose only first official language spoken is French was negative (-900).
- While 1,215 people with French as their only first official language spoken moved to Manitoba from another province or territory from 2016 to 2021, 2,115 people left the province during the same period, with the majority settling in Quebec (39.5%) or Ontario (25.3%).
Appendix
| Indicator | 1991 | 1996 | 2001 | 2006 | 2011 | 2016 | 2021 |
|---|---|---|---|---|---|---|---|
| percent | |||||||
| French as first official language spokenTable 1 Note 1 | 4.5 | 4.3 | 4.0 | 3.9 | 3.6 | 3.4 | 3.1 |
| French only | 4.3 | 4.1 | 3.8 | 3.7 | 3.4 | 3.1 | 2.7 |
| French and English | 0.2 | 0.2 | 0.2 | 0.2 | 0.2 | 0.3 | 0.3 |
| Knowledge of FrenchTable 1 Note 2 | 9.3 | 9.5 | 9.4 | 9.3 | 8.8 | 8.7 | 8.4 |
| French only | 0.2 | 0.1 | 0.1 | 0.2 | 0.1 | 0.1 | 0.1 |
| French and English | 9.2 | 9.4 | 9.3 | 9.1 | 8.6 | 8.6 | 8.3 |
| French as mother tongue | 4.9 | 4.6 | 4.3 | 4.2 | 4.0 | 3.7 | 3.5 |
| French only | 4.6 | 4.3 | 4.0 | 3.9 | 3.5 | 3.2 | 2.8 |
| French in combination with other languages | 0.3 | 0.3 | 0.3 | 0.3 | 0.5 | 0.4 | 0.7 |
| French spoken most often at home | 2.5 | 2.2 | 2.0 | 1.9 | 1.8 | 1.7 | 1.5 |
| French predominantly | 2.2 | 2.0 | 1.8 | 1.7 | 1.5 | 1.3 | 1.1 |
| French equally with other languages | 0.3 | 0.2 | 0.2 | 0.2 | 0.3 | 0.3 | 0.4 |
| French used most often at workTable 1 Note 3 | Note ..: not available for a specific reference period | Note ..: not available for a specific reference period | 1.3 | 1.4 | 1.2 | 1.3 | 1.3 |
| French predominantly | Note ..: not available for a specific reference period | Note ..: not available for a specific reference period | 1.0 | 1.1 | 0.9 | 0.9 | 1.0 |
| French equally with other languages | Note ..: not available for a specific reference period | Note ..: not available for a specific reference period | 0.3 | 0.3 | 0.3 | 0.4 | 0.3 |
.. not available for a specific reference period
|
|||||||
| FrequencyTable 2 Note 2 | French used at workTable 2 Note 1 | French spoken at home | ||
|---|---|---|---|---|
| number | percent | number | percent | |
| Total population | 625,115 | 100.0 | 1,326,810 | 100.0 |
| Only | 3,285 | 0.5 | 9,840 | 0.6 |
| Mostly | 2,775 | 0.4 | 4,875 | 0.3 |
| Equally | 1,920 | 0.3 | 5,285 | 0.3 |
| Regularly | 8,410 | 1.3 | 17,755 | 0.7 |
| No mention | 608,725 | 97.4 | 1,289,060 | 98.1 |
|
||||
| Selection of industry sectors | Use of French at work | |||
|---|---|---|---|---|
| At least regularlyTable 3 Note 2 | Most often | |||
| number | percent | number | percent | |
| Total | 16,395 | 100.0 | 7,975 | 100.0 |
| Agriculture, forestry, fishing and hunting | 465 | 2.8 | 300 | 3.8 |
| Retail trade | 895 | 5.5 | 250 | 3.1 |
| Transportation and warehousing | 515 | 3.1 | 170 | 2.1 |
| Finance and insurance | 915 | 5.6 | 410 | 5.1 |
| Professional, scientific and technical services | 500 | 3.0 | 110 | 1.4 |
| Administrative and support, waste management and remediation services | 570 | 3.5 | 275 | 3.4 |
| Educational services | 5,285 | 32.2 | 4,015 | 50.3 |
| Health care and social assistance | 2,365 | 14.4 | 980 | 12.3 |
| Other services (except public administration) | 510 | 3.1 | 210 | 2.6 |
| Public administration | 2,170 | 13.2 | 485 | 6.1 |
| Other sectors | 2,205 | 13.4 | 785 | 9.8 |
|
||||
| Age group | Mother tongue | |||||
|---|---|---|---|---|---|---|
| Total | FrenchTable 4 Note 1 | Other languages | ||||
| number | percent | number | percent | number | percent | |
| Total | 37,750 | 2.8 | 25,480 | 55.0 | 12,275 | 1.0 |
| 0 to 14 years | 9,760 | 3.9 | 5,245 | 82.1 | 4,515 | 1.8 |
| 15 to 44 years | 14,350 | 2.7 | 8,895 | 60.1 | 5,450 | 1.1 |
| 45 years and older | 13,650 | 2.5 | 11,340 | 45.0 | 2,310 | 0.4 |
|
||||||
| Immigration status and period of immigration | Knowledge of FrenchTable 5 Note 1 | French spoken at homeTable 5 Note 1 | First official language spoken | |||||
|---|---|---|---|---|---|---|---|---|
| French only | French and English | |||||||
| number | percent | number | percent | number | percent | number | percent | |
| Total | 111,785 | 8.6 | 37,465 | 2.9 | 35,650 | 2.7 | 4,335 | 0.3 |
| Non-immigrants | 99,810 | 9.8 | 31,345 | 3.1 | 31,545 | 3.1 | 1,810 | 0.2 |
| Immigrants | 10,580 | 4.1 | 5,290 | 2.1 | 3,490 | 1.4 | 2,160 | 0.8 |
| Recent immigrantsTable 5 Note 2 | 2,540 | 4.4 | 1,635 | 2.8 | 1,120 | 1.9 | 665 | 1.1 |
| Established immigrantsTable 5 Note 3 | 8,035 | 4.0 | 3,660 | 1.8 | 2,370 | 1.2 | 1,495 | 0.8 |
| 2011 to 2015 | 2,395 | 4.6 | 1,325 | 2.5 | 760 | 1.5 | 610 | 1.2 |
| 2001 to 2010 | 2,770 | 4.2 | 1,370 | 2.1 | 825 | 1.3 | 610 | 0.9 |
| 1991 to 2000 | 820 | 3.8 | 350 | 1.6 | 265 | 1.2 | 115 | 0.5 |
| 1980 to 1990 | 585 | 2.8 | 205 | 1.0 | 105 | 0.5 | 80 | 0.4 |
| Before 1980 | 1,480 | 3.8 | 410 | 1.1 | 425 | 1.1 | 85 | 0.2 |
| Non-permanent residents | 1,400 | 4.1 | 830 | 2.4 | 615 | 1.8 | 365 | 1.1 |
|
||||||||
- Date modified: