
Ethnicity, Language and Immigration Thematic Series
Key facts on the French language in Nunavut in 2021
Skip to text
Text begins
This fact sheet gives an overview of the situation of French in the NunavutNote in 2021. It begins by providing information on the changes in the number and proportion of the population who can have a conversation in French, whose first official language spoken is French, whose mother tongue is French, and who speak French at home or use French at work. Next, it presents information on French-language instruction in primary and secondary schools, French spoken among recent and established immigrants, and the mobility and place of birth of individuals whose first official language spoken is French. Additional data on these topics can be found in the appendix.
The information in this fact sheet is taken from the Census of Population. To learn more about the census concepts and the historical comparability of data, please refer to the 2021 Census of Population Languages Reference Guide and the Instruction in the Minority Official Language Reference Guide.
Start of text boxHighlights
- In 2021, 1,450 Nunavut residents could conduct a conversation in French. This number was down from 2016 (-130), but higher than in 1991 (+635). The demographic weight of these residents rose from 3.8% in 1991 to 4.4% in 2016, then fell to 4.0% in 2021.
- In 2021, 705 people (1.9% of the population) spoke French at least regularly at home. Among those with French as one of their mother tongues, nearly three-quarters (73.9%) spoke French regularly at home.
- In 2021, 295 workers living in the territory (2.5%) spoke French at least regularly at work. Many of them worked in public administration (37.3%), educational services (10.2%) or health care and social assistance (10.2%).
- In 2021, one in six immigrants (16.7%) could have a conversation in French. This proportion was higher among immigrants admitted before 2016 (18.4%) than among those admitted between 2016 and 2021 (10.4%).
- Around 7 in 10 Nunavut residents (72.2%) whose first official language spoken was French in 2021 were born in Canada, but outside Nunavut.
Ability to conduct a conversation in French
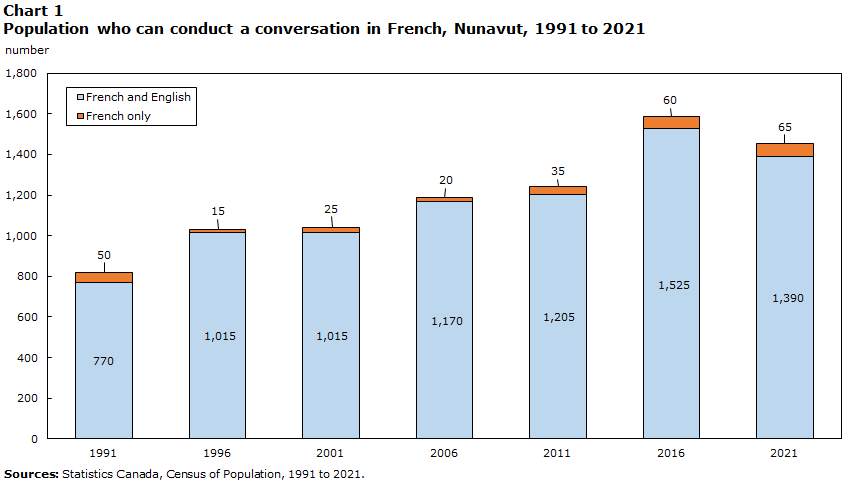
Data table for Chart 1
| Knowledge of official languages | 1991 | 1996 | 2001 | 2006 | 2011 | 2016 | 2021 |
|---|---|---|---|---|---|---|---|
| number | |||||||
| French and English | 770 | 1,015 | 1,015 | 1,170 | 1,205 | 1,525 | 1,390 |
| French only | 50 | 15 | 25 | 20 | 35 | 60 | 65 |
| Sources: Statistics Canada, Census of Population, 1991 to 2021. | |||||||
- In 2021, 1,450 Nunavut residents could have a conversation in French. Almost all (95.9%, or 1,390 people) could also do so in English.
- The number of people who could conduct a conversation in French increased steadily from 1991 to 2016 (+765), before falling during the last period between censuses (-130).
- In 2021, 4.0% of the population could conduct a conversation in French. This is higher than the proportion observed in 1991 (3.8%), but lower than in 2016 (4.4%).
- Among those who first learned a language other than French in childhood, the proportion who could have a conversation in French increased from 1.9% in 1991 to 2.3% in 2021.

Description for Map 1
This map shows the proportion of the population able to conduct a conversation in French in each census subdivision in Nunavut in 2021.
In this map we use 6 distinct colours to signify different values. Grey is used to represent areas for which no data are available. There are 6 census subdivisions in this group.
Teal is used to represent areas in which less than 1.5% of the population is able to conduct a conversation in French. There are 19 census subdivisions in this group.
Green is used to represent areas in which 1.5% to less than 5% of the population is able to conduct a conversation in French. There are 5 census subdivisions in this group.
Yellow is used to represent areas in which 5% to less than 10% of the population is able to conduct a conversation in French. There are no census subdivision in this group.
Orange is used to represent areas in which 10% to less than 15% of the population is able to conduct a conversation in French. There are no census subdivision in this group.
Red is used to represent areas in which 15% or more of the population is able to conduct a conversation in French. There is 1 census subdivision in this group.
The boundaries of census subdivisions have been delimited by a gray line or by circles for those with smaller land area. Their colour was assigned according to the table below.
| Census Subdivision | Population knowing FrenchMap 1 Note 1 |
|---|---|
| percentage | |
| Grise Fiord | 0.0 |
| Whale Cove | 0.0 |
| Naujaat | 0.4 |
| Clyde River | 0.4 |
| Kugaaruk | 0.5 |
| Hall Beach | 0.6 |
| Arviat | 0.7 |
| Pond Inlet | 1.0 |
| Coral Harbour | 1.0 |
| Sanikiluaq | 1.0 |
| Arctic Bay | 1.0 |
| Taloyoak | 1.1 |
| Kugluktuk | 1.1 |
| Gjoa Haven | 1.1 |
| Kimmirut | 1.2 |
| Baker Lake | 1.2 |
| Igloolik | 1.2 |
| Chesterfield Inlet | 1.3 |
| Cape Dorset | 1.4 |
| Pangnirtung | 1.7 |
| Qikiqtarjuaq | 1.7 |
| Rankin Inlet | 1.9 |
| Cambridge Bay | 2.3 |
| Resolute | 2.8 |
| Iqaluit | 15.2 |
|
|
- In 2021, in all 25 municipalitiesNote of Nunavut (except Iqaluit), less than 3% of residents could conduct a conversation in French.
- The municipalities with a population of more than 500 that had the highest proportion of people who spoke French were the capital, Iqaluit (15.2%), Cambridge Bay (2.3%) and Rankin Inlet (1.9%).
- The municipalities with a population of more than 500 that had the highest number of French speakers were Iqaluit (1,110), Rankin Inlet (55) and Cambridge Bay (40).
French as the first official language spoken

Data table for Chart 2
| First official language spoken | 1991 | 1996 | 2001 | 2006 | 2011 | 2016 | 2021 |
|---|---|---|---|---|---|---|---|
| number | |||||||
| French only | 415 | 395 | 385 | 385 | 450 | 585 | 575 |
| French and English | 30 | 55 | 60 | 75 | 55 | 90 | 95 |
| Sources: Statistics Canada, Census of Population, 1991 to 2021. | |||||||
- In 2021, 575 residents of Nunavut (1.6% of the population) had French as their only first official language spoken, and 95 residents (0.3%) had English and French as their first official languages spoken.
- The number of residents with French as their only first official language spoken fell between 1991 and 2006 (-30), then rose from 2006 to 2016 (+200) and remained fairly stable during the last period between censuses (-10). In contrast, the demographic weight of this population was lower in 2021 (1.6%) than in 1991 (2.0%).
- The number of people in Nunavut with English and French as their first official languages spoken increased from 1991 to 2021 (+65).
French as a mother tongue
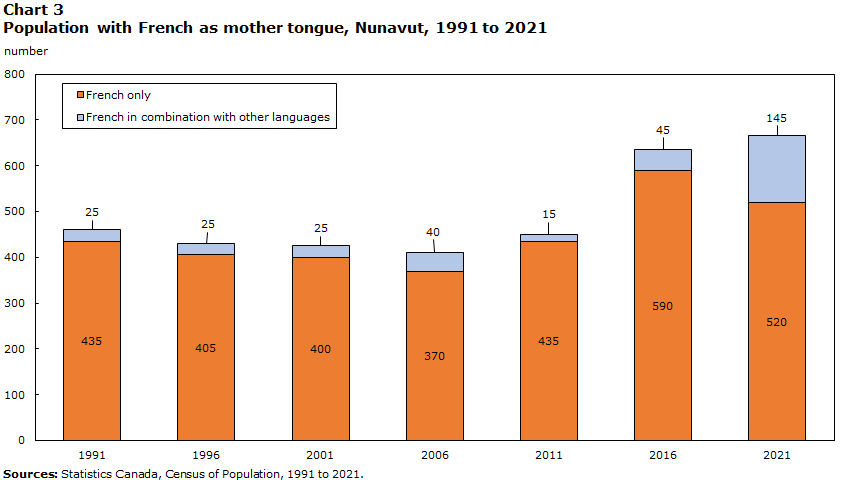
Data table for Chart 3
| Mother tongue | 1991 | 1996 | 2001 | 2006 | 2011 | 2016 | 2021 |
|---|---|---|---|---|---|---|---|
| number | |||||||
| French only | 435 | 405 | 400 | 370 | 435 | 590 | 520 |
| French in combination with other languages | 25 | 25 | 25 | 40 | 15 | 45 | 145 |
| Sources: Statistics Canada, Census of Population, 1991 to 2021. | |||||||
- In 2021, 665 Nunavut residents had French as one of their mother tongues, up from 1991 (+205) and 2016 (+25).
- In 2021, 78.2% of these residents (520 people) had French as their only mother tongue, while 21.8% (145 people) had French along with other languages (mainly English).
- From 1991 to 2011, the proportion of the population with French as one of their mother tongues decreased from 2.2% to 1.4%. It recovered thereafter, with the proportion totalling 1.8% in 2021.
- For just under two in five (39.3%) people who had French as one of their mother tongues and who were married or in a common-law relationship, French was also the mother tongue of their spouse or partner.
French spoken at home
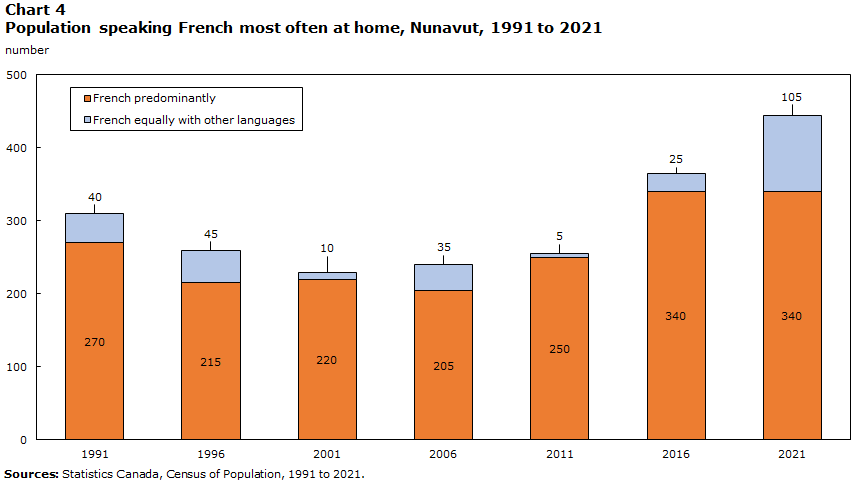
Data table for Chart 4
| Language spoken most often at home | 1991 | 1996 | 2001 | 2006 | 2011 | 2016 | 2021 |
|---|---|---|---|---|---|---|---|
| number | |||||||
| French predominantly | 270 | 215 | 220 | 205 | 250 | 340 | 340 |
| French equally with other languages | 40 | 45 | 10 | 35 | 5 | 25 | 105 |
| Sources: Statistics Canada, Census of Population, 1991 to 2021. | |||||||
- In 2021, 705 residents of Nunavut (1.9% of the population) spoke French at least regularly at home.
- Of these, close to two-thirds (63.1%, or 445 people) spoke French most often at home, predominantly or equally with other languages, up from 1991 (+135) and 2016 (+75).
- Moreover, 260 people (36.9%) spoke French regularly at home, in addition to their main language (generally English).
- Among people with French as their mother tongue, alone or with other languages:
- Almost three-quarters (73.9%, or 495 people) spoke French at least regularly at home in 2021. However, this rate varied by age, ranging from 87.5% among those under age 15 to 66.7% among those aged 45 and older.
- Three in five people (60.2%, or 400 people) spoke French most often at home, alone or equally with other languages. The proportion was down from 1991 (63.0%), but the number of speakers was up (+110).
- Among Nunavut residents whose mother tongue is not French, 215 (0.6%) spoke French on a regular basis at home.
- The large majority (79.1%, or 170 people) spoke French at home as a secondary language and spoke another language more often (generally English).
French used at work
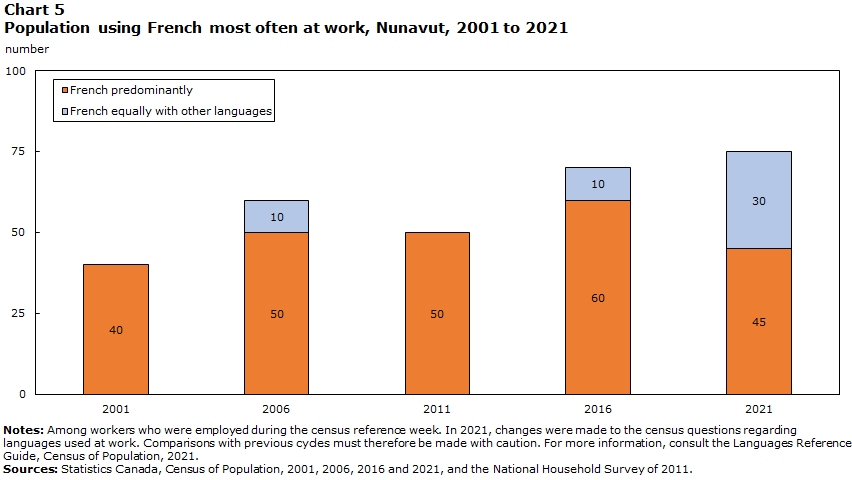
Data table for Chart 5
| Language used most often at work | 2001 | 2006 | 2011 | 2016 | 2021 |
|---|---|---|---|---|---|
| number | |||||
| French predominantly | 40 | 50 | 50 | 60 | 45 |
| French equally with other languages | 0 | 10 | 0 | 10 | 30 |
|
Notes: Among workers who were employed during the census reference week. In 2021, changes were made to the census questions regarding languages used at work. Comparisons with previous cycles must therefore be made with caution. For more information, consult the Languages Reference Guide, Census of Population, 2021. Sources: Statistics Canada, Census of Population, 2001, 2006, 2016 and 2021, and the National Household Survey of 2011. |
|||||
- In 2021, 295 Nunavut residents used French at least regularly at work, accounting for 2.5% of the territory’s workers.Note
- In Nunavut, 75 people, or 0.6% of the territory’s workers, used French most often at work, predominantly or equally with other languages.
- The number of people who used French most often at work increased from 40 in 2001 to 75 in 2021.
- In 2021, among workers who used French at least regularly at work, most worked in public administration (37.3%, or 110 people), educational services (10.2%, or 30 people) or health care and social assistance (10.2%, or 30 people).Note
- Among those who spoke French most often at home, predominantly or equally with other languages, 49.1% also used French regularly at work.
Instruction in French in primary and secondary schools
- In 2021, 535 (3.8%) of the 14,180 children under 18 living in the territory were eligibleNote for instruction in French.
- In Nunavut, 855 people were attending or had already attended a regular French program in a French-language school in Canada, representing 2.7% of the population aged 5 and older.
- Of those who had never attended a French-language school, 590 (1.8%) had instead attended a French immersion program in an English-language school.
- Among school-aged childrenNote who were eligible for instruction in French, 220 (61.1%) were attending or had already attended a regular French program in a French-language school in Canada.
French among immigrants
- In 2021, the proportions of recentNote and establishedNote immigrants living in Nunavut who could conduct a conversation in French (10.4% and 18.4%, respectively) were higher than the proportion of the non-immigrant population (3.5%).
- The proportion of immigrants who spoke French at least regularly at home (9.4%) was higher than the proportion for the non-immigrant population (1.7%).
- The proportion of immigrants who had French as their only first official language spoken (7.2%) was higher than for the non-immigrant population (1.4%). The same was true for the proportions of immigrants and non-immigrants who had English and French as their first official languages spoken (2.4% and 0.2%, respectively).
Mobility and birthplace of the French-speaking population

Data table for Chart 6
| Place of birth | Percent |
|---|---|
| Nunavut | 12.2 |
| Quebec | 49.6 |
| New Brunswick |
6.1 |
| Ontario | 10.4 |
| Elsewhere in Canada | 6.1 |
| Outside Canada | 15.7 |
| Source: Statistics Canada, Census of Population, 2021. | |
- In 2021, among Nunavut residents whose only first official language spoken is French, roughly one in eight (12.2%, or 70 people) were born in the territory.
- More than two-thirds (72.2%, or 415 people) were born in another province or territory, with many of them coming from Quebec (49.6%, or 285 people), Ontario (10.4%, or 60 people) or New Brunswick (6.1%, or 40 people).
- More than one in seven (15.7%, or 90 people) were born abroad.
- From 2016 to 2021, the net interprovincial migration of the Nunavut population whose only first official language spoken is French was slightly negative (-20).
- While 235 people with French as their only first official language spoken settled in Nunavut from another province or territory from 2016 to 2021, 255 people left the territory during the same period.
Appendix
| Indicator | 1991 | 1996 | 2001 | 2006 | 2011 | 2016 | 2021 |
|---|---|---|---|---|---|---|---|
| percent | |||||||
| French as first official language spokenTable 1 Note 1 | 2.1 | 1.8 | 1.6 | 1.6 | 1.6 | 1.9 | 1.8 |
| French only | 2.0 | 1.6 | 1.4 | 1.3 | 1.4 | 1.6 | 1.6 |
| French and English | 0.1 | 0.2 | 0.2 | 0.3 | 0.2 | 0.3 | 0.3 |
| Knowledge of FrenchTable 1 Note 2 | 3.8 | 4.2 | 3.9 | 4.0 | 3.9 | 4.4 | 4.0 |
| French only | 0.2 | 0.1 | 0.1 | 0.1 | 0.1 | 0.2 | 0.2 |
| French and English | 3.6 | 4.1 | 3.8 | 4.0 | 3.8 | 4.3 | 3.8 |
| French as mother tongue | 2.2 | 1.8 | 1.6 | 1.4 | 1.4 | 1.8 | 1.8 |
| French only | 2.1 | 1.6 | 1.5 | 1.2 | 1.4 | 1.7 | 1.4 |
| French in combination with other languages | 0.1 | 0.1 | 0.1 | 0.2 | 0.0 | 0.1 | 0.4 |
| French spoken most often at home | 1.5 | 1.1 | 0.9 | 0.8 | 0.8 | 1.0 | 1.2 |
| French predominantly | 1.3 | 0.9 | 0.8 | 0.7 | 0.8 | 1.0 | 0.9 |
| French equally with other languages | 0.2 | 0.2 | 0.0 | 0.1 | 0.0 | 0.1 | 0.3 |
| French used most often at workTable 1 Note 3 | Note ..: not available for a specific reference period | Note ..: not available for a specific reference period | 0.4 | 0.6 | 0.5 | 0.5 | 0.6 |
| French predominantly | Note ..: not available for a specific reference period | Note ..: not available for a specific reference period | 0.4 | 0.5 | 0.5 | 0.5 | 0.4 |
| French equally with other languages | Note ..: not available for a specific reference period | Note ..: not available for a specific reference period | 0.0 | 0.1 | 0.0 | 0.1 | 0.2 |
.. not available for a specific reference period
|
|||||||
| FrequencyTable 2 Note 2 | French used at workTable 2 Note 1 | French spoken at home | ||
|---|---|---|---|---|
| number | percent | number | percent | |
| Total population | 11,945 | 100.0 | 36,645 | 100.0 |
| Only | 25 | 0.2 | 235 | 0.6 |
| Mostly | 20 | 0.2 | 105 | 0.3 |
| Equally | 25 | 0.2 | 110 | 0.3 |
| Regularly | 225 | 1.9 | 260 | 0.7 |
| No mention | 11,650 | 97.5 | 35,935 | 98.1 |
|
||||
| Selection of industry sectors | Use of French at work | |||
|---|---|---|---|---|
| At least regularlyTable 3 Note 2 | Most often | |||
| number | percent | number | percent | |
| Total | 295 | 100.0 | 75 | 100.0 |
| Utilities | 10 | 3.4 | 0 | 0.0 |
| Construction | 10 | 3.4 | 10 | 13.3 |
| Retail trade | 20 | 6.8 | 0 | 0.0 |
| Transportation and warehousing | 15 | 5.1 | 0 | 0.0 |
| Real estate and rental and leasing | 0 | 0.0 | 0 | 0.0 |
| Administrative and support, waste management and remediation services | 10 | 3.4 | 10 | 13.3 |
| Educational services | 30 | 10.2 | 15 | 20.0 |
| Health care and social assistance | 30 | 10.2 | 10 | 13.3 |
| Accommodation and food services | 10 | 3.4 | 0 | 0.0 |
| Public administration | 110 | 37.3 | 15 | 20.0 |
| Other sectors | 50 | 16.9 | 0 | 0.0 |
|
||||
| Age group | Mother tongue | |||||
|---|---|---|---|---|---|---|
| Total | FrenchTable 4 Note 1 | Other languages | ||||
| number | percent | number | percent | number | percent | |
| Total | 705 | 1.9 | 495 | 73.9 | 215 | 0.6 |
| 0 to 14 years | 195 | 1.6 | 140 | 87.5 | 50 | 0.4 |
| 15 to 44 years | 330 | 2.0 | 225 | 70.3 | 105 | 0.7 |
| 45 years and older | 185 | 2.2 | 130 | 66.7 | 60 | 0.7 |
|
||||||
| Immigration status and period of immigration | Knowledge of FrenchTable 5 Note 1 | French spoken at homeTable 5 Note 1 | First official language spoken | |||||
|---|---|---|---|---|---|---|---|---|
| French only | French and English | |||||||
| number | percent | number | percent | number | percent | number | percent | |
| Total | 1,450 | 4.0 | 710 | 1.9 | 575 | 1.6 | 95 | 0.3 |
| Non-immigrants | 1,245 | 3.5 | 590 | 1.7 | 490 | 1.4 | 75 | 0.2 |
| Immigrants | 195 | 16.7 | 110 | 9.4 | 75 | 7.2 | 25 | 2.4 |
| Recent immigrantsTable 5 Note 2 | 25 | 10.4 | 15 | 6.3 | 10 | 4.2 | 0 | 0.0 |
| Established immigrantsTable 5 Note 3 | 170 | 18.4 | 95 | 10.3 | 65 | 7.0 | 20 | 2.2 |
| 2011 to 2015 | 50 | 24.4 | 40 | 19.5 | 30 | 15.0 | 10 | 5.0 |
| 2001 to 2010 | 70 | 17.3 | 40 | 9.9 | 30 | 7.5 | 10 | 2.5 |
| Before 2001 | 45 | 14.1 | 15 | 4.7 | 0 | 0.0 | 0 | 0.0 |
| Non-permanent residents | 10 | 13.3 | 10 | 13.3 | 0 | 0.0 | 0 | 0.0 |
|
||||||||
- Date modified: