
Ethnicity, Language and Immigration Thematic Series
Key facts on the French language in the Northwest Territories in 2021
Correction notice
Corrections have been made to this product, please take note of the following changes: data regarding the interprovincial migration of the population who had French as their only first official language spoken have been revised.
Skip to text
Text begins
This fact sheet gives an overview of the situation of French in the Northwest TerritoriesNote in 2021. It begins by providing information on the changes in the number and proportion of the population who can have a conversation in French, whose first official language spoken is French, whose mother tongue is French, and who speak French at home or use French at work. Next, it presents information on French-language instruction in primary and secondary schools, French spoken among recent and established immigrants, and the mobility and place of birth of individuals whose first official language spoken is French. Additional data on these topics can be found in the appendix.
The information in this fact sheet is taken from the Census of Population. To learn more about the census concepts and the historical comparability of data, please refer to the 2021 Census of Population Languages Reference Guide and the Instruction in the Minority Official Language Reference Guide.
Start of text boxHighlights
- In the Northwest Territories, the number and proportion of residents who could have a conversation in French or who used French most often at work reached all-time highs in 2021.
- Just over 1 in 10 people (10.8%, or 4,395 people) could conduct a conversation in French in 2021.
- In 2021, 1,470 people (3.6% of the population) spoke French at least regularly at home. Among those with French as one of their mother tongues, two-thirds (67.0%) spoke French regularly at home.
- In 2021, 595 workers living in the territory (2.9%) spoke French at least regularly at work. Many of them worked in public administration (37.8%) or educational services (29.4%).
- Roughly 1 in 11 immigrants (8.7%) could have a conversation in French in 2021. This proportion was higher among immigrants admitted before 2016 (9.2%) than among immigrants admitted between 2016 and 2021 (6.2%).
- In 2021, more than 7 in 10 territory residents (71.3%) whose only first official language spoken was French were born in Canada, but outside the Northwest Territories.
Ability to conduct a conversation in French

Data table for Chart 1
| Knowledge of official languages | 1991 | 1996 | 2001 | 2006 | 2011 | 2016 | 2021 |
|---|---|---|---|---|---|---|---|
| number | |||||||
| French and English | 2,725 | 3,025 | 3,130 | 3,665 | 3,715 | 4,275 | 4,295 |
| French only | 35 | 30 | 40 | 55 | 50 | 65 | 100 |
| Sources: Statistics Canada, Census of Population, 1991 to 2021. | |||||||
- In 2021, 4,395 residents of the Northwest Territories (10.8% of the population) could have a conversation in French. Almost all (97.7%, or 4,295 people) could also do so in English.
- The number of people who could conduct a conversation in French was higher than in 1991 (+1,635) and 2016 (+55). The 2021 figure was the highest ever observed in a census.
- From 1991 to 2021, the proportion of the population who can conduct a conversation in French also increased (from 7.6% to 10.8%). In 2021, this was the highest percentage ever observed in a census.
- This upward trend since 1991 is driven by the growth of the population with French as one of their mother tongues (+395) and by the increase in bilingualism among people who first learned English in childhood. Of these people, 2,750 (8.9%) could have a conversation in French in 2021, up from 1,565 (5.8%) in 1991.

Description for Map 1
This map shows the proportion of the population able to conduct a conversation in French in each census subdivision in Northwest Territories in 2021.
In this map we use 6 distinct colours to signify different values. Grey is used to represent areas for which no data are available. There are 8 census subdivisions in this group.
Teal is used to represent areas in which less than 1.5% of the population is able to conduct a conversation in French. There are 15 census subdivisions in this group.
Green is used to represent areas in which 1.5% to less than 5% of the population is able to conduct a conversation in French. There are 10 census subdivisions in this group.
Yellow is used to represent areas in which 5% to less than 10% of the population is able to conduct a conversation in French. There are 6 census subdivisions in this group.
Orange is used to represent areas in which 10% to less than 15% of the population is able to conduct a conversation in French. There are 2 census subdivisions in this group.
Red is used to represent areas in which 15% or more of the population is able to conduct a conversation in French. There is 1 census subdivision in this group.
The boundaries of census subdivisions have been delimited by a gray or by circles for those with a smaller land area. Their colour was assigned according to the table below.
| Census Subdivision | Population knowing FrenchMap title Note 1 |
|---|---|
| percentage | |
| Tsiigehtchic | 0.0 |
| Fort McPherson | 0.0 |
| Colville Lake | 0.0 |
| Gamètì | 0.0 |
| Nahanni Butte | 0.0 |
| Jean Marie River | 0.0 |
| Hay River Dene 1 | 0.0 |
| Wrigley | 0.0 |
| Dettah | 0.0 |
| Aklavik | 0.9 |
| Whatì | 0.9 |
| Fort Resolution | 1.2 |
| Ulukhaktok | 1.2 |
| Tulita | 1.3 |
| Behchokò | 1.4 |
| Tuktoyaktuk | 1.6 |
| Paulatuk | 1.7 |
| Déline | 1.8 |
| Fort Liard | 2.2 |
| Fort Providence | 2.4 |
| Fort Good Hope | 3.0 |
| Fort Simpson | 3.2 |
| Wekweètì | 4.5 |
| Sachs Harbour | 4.8 |
| Sambaa K'e | 5.3 |
| Inuvik | 6.0 |
| Lutselk'e | 6.1 |
| Enterprise | 6.7 |
| Fort Smith | 7.7 |
| Norman Wells | 8.1 |
| Hay River | 10.4 |
| Region 6, Unorganized | 14.8 |
| Yellowknife | 17.1 |
|
|
- In 2021, in 24 of the Northwest Territories’ 33 municipalities,Note less than 5% of the population could have a conversation in French.
- The municipalities with a population of more than 500 that had the highest proportion of people who spoke French were the capital, Yellowknife (17.1%), Hay River, located on the shore of Great Slave Lake (10.4%), and Norman Wells (8.1%).
- The municipalities with a population of more than 500 that had the highest number of French speakers were Yellowknife (3,430), Hay River (325) and Inuvik (185).
French as the first official language spoken

Data table for Chart 2
| First official language spoken | 1991 | 1996 | 2001 | 2006 | 2011 | 2016 | 2021 |
|---|---|---|---|---|---|---|---|
| number | |||||||
| French only | 925 | 920 | 875 | 950 | 1,030 | 1,165 | 1,135 |
| French and English | 65 | 65 | 80 | 110 | 100 | 150 | 155 |
| Sources: Statistics Canada, Census of Population, 1991 to 2021. | |||||||
- In 2021, 1,135 Northwest Territories residents (2.8% of the population) had French as their only first official language spoken, and 155 residents (0.4%) had English and French as their first official languages spoken.
- From 1991 to 2001, the number of residents with French as their only first official language spoken declined (-50), but rose from 2001 to 2016 (+270). This population remained fairly stable between 2016 and 2021 (-30).
- The number of Northwest Territories residents with English and French as their first official languages spoken increased from 1991 to 2021 (+90).
French as a mother tongue

Data table for Chart 3
| Mother tongue | 1991 | 1996 | 2001 | 2006 | 2011 | 2016 | 2021 |
|---|---|---|---|---|---|---|---|
| number | |||||||
| French only | 940 | 955 | 950 | 975 | 1,080 | 1,175 | 1,130 |
| French in combination with other languages | 135 | 100 | 105 | 60 | 85 | 185 | 345 |
| Sources: Statistics Canada, Census of Population, 1991 to 2021. | |||||||
- In 2021, 1,470 Northwest Territories residents had French as one of their mother tongues, up from 1991 (+395) and 2016 (+105).
- In 2021, 76.9% of these residents (1,130 people) had French as their only mother tongue, while 23.5% (345 people) had French as a mother tongue along with other languages (mainly English).
- From 1991 to 2006, the proportion of the population with French as one of their mother tongues edged down from 3.0% to 2.5%. It recovered thereafter, with the proportion rising to 3.6% in 2021.
- For roughly two in five (39.7%) people who had French as one of their mother tongues and who were married or in a common-law relationship, French was also the mother tongue of their spouse or partner.
French spoken at home

Data table for Chart 4
| Language spoken most often at home | 1991 | 1996 | 2001 | 2006 | 2011 | 2016 | 2021 |
|---|---|---|---|---|---|---|---|
| number | |||||||
| French predominantly | 340 | 335 | 360 | 445 | 550 | 630 | 615 |
| French equally with other languages | 95 | 75 | 60 | 30 | 55 | 165 | 205 |
| Sources: Statistics Canada, Census of Population, 1991 to 2021. | |||||||
- In 2021, 1,470 Northwest Territories residents (3.6% of the population) spoke French at least regularly at home.
- More than half of these residents (55.8%, or 820 people) spoke French most often at home, predominantly or equally with other languages. This was up from 1991 (+380), but remained fairly stable from 2016 to 2021 (+25).
- Moreover, 650 people (44.2%) spoke French regularly at home in addition to their main language (usually English).
- Among people with French as their mother tongue, alone or with other languages:
- Two-thirds (67.0%, or 985 people) spoke it at least regularly at home in 2021. However, this rate varied by age, ranging from 86.4% among those under age 15 to 47.9% among those aged 45 and older.
- Half (49.7%, or 730 people) spoke French most often at home, predominantly or equally with other languages. This was up from 1991 (37.2%, or 400 people).
- Among residents of the Northwest Territories whose mother tongue is not French, 480 (1.2%) spoke French at least regularly at home.
- The vast majority (81.3%, or 390 people) spoke French at home as a secondary language while speaking another language more often (usually English).
French used at work
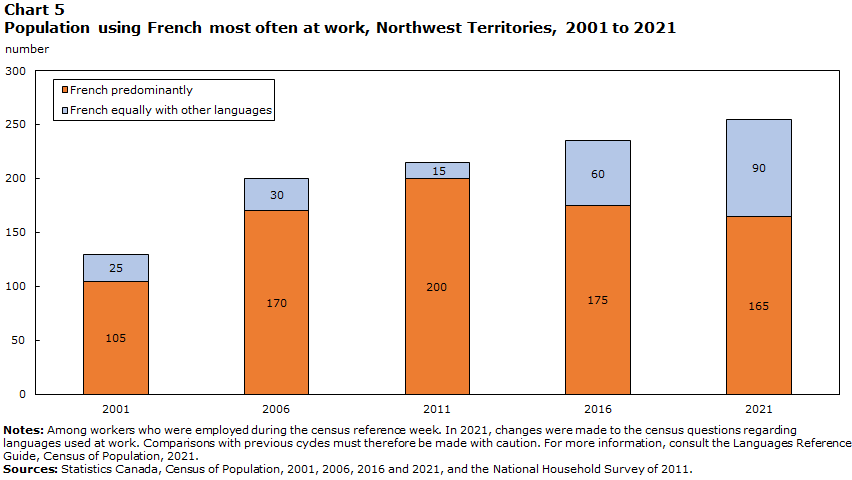
Data table for Chart 5
| Language used most often at work | 2001 | 2006 | 2011 | 2016 | 2021 |
|---|---|---|---|---|---|
| number | |||||
| French predominantly | 105 | 170 | 200 | 175 | 165 |
| French equally with other languages | 25 | 30 | 15 | 60 | 90 |
|
Notes: Among workers who were employed during the census reference week. In 2021, changes were made to the census questions regarding languages used at work. Comparisons with previous cycles must therefore be made with caution. For more information, consult the Languages Reference Guide, Census of Population, 2021. Sources: Statistics Canada, Census of Population, 2001, 2006, 2016 and 2021, and the National Household Survey of 2011. |
|||||
- In 2021, 595 residents of the Northwest Territories used French at least regularly at work, accounting for 2.9% of the territory’s workers.Note
- In the Northwest Territories, 260 people, or 1.2% of the territory’s workers, used French most often at work, predominantly or equally with other languages.
- The number of people who used French most often at work increased from 130 in 2001 to 260 in 2021.
- In 2021, among workers who used French at least regularly at work, most worked in public administration (37.8%, or 225 people), educational services (175 people, or 29.4%) or retail trade (4.2%, or 25 people).Note
- Among those who spoke French most often at home, predominantly or with other languages, 52.0% also used French regularly at work.
- Among workers who used French regularly at work, 8 in 10 (81.5%) lived in Yellowknife.
Instruction in French in primary and secondary schools
- In 2021, 1,110 (10.9%) of the 10,195 children under 18 living in the territory were eligibleNote for instruction in French.
- More than 7 in 10 (73.0%, or 810 children) lived in Yellowknife.
- In the Northwest Territories, 1,775 people were attending or had already attended a regular French program in a French-language school in Canada, representing 4.7% of the population aged 5 and older.
- Of those who had never attended a French-language school, 2,970 (7.9%) had actually attended a French immersion program in an English-language school.
- Among school-aged childrenNote who were eligible for instruction in French, 525 (66.9%) were attending or had already attended a regular French program in a French-language school in Canada.
French among immigrants
- In 2021, the proportions of recentNote and establishedNote immigrants living in the Northwest Territories who could conduct a conversation in French (6.2% and 9.2%, respectively) were lower than the proportion of the non-immigrant population (11.2%).
- The proportions of immigrants and non-immigrants who spoke French at least regularly at home were similar (3.7% and 4.0%, respectively).
- The proportion of immigrants with French as their only first official language spoken (2.5%) was lower than the proportion for the non-immigrant population (3.1%). However, the proportion of immigrants who had English and French as their first official languages spoken (1.4%) was higher than that of the non-immigrant population (0.4%).
Mobility and birthplace of the French-speaking population

Data table for Chart 6
| Place of birth | Percent |
|---|---|
| Northwest Territories | 18.4 |
| Quebec | 43.9 |
| New Brunswick |
7.0 |
| Ontario | 11.1 |
| Elsewhere in Canada | 9.4 |
| Outside Canada | 10.2 |
| Source: Statistics Canada, Census of Population, 2021. | |
- In 2021, among Northwest Territories residents whose only first official language spoken is French, nearly one in five (18.4%, or 225 people) were born in the territory.
- More than 7 in 10 people (71.3%, or 870 people) were born in another province or territory, with large proportions coming from Quebec (43.9%, or 535 people), Ontario (11.1%, or 135 people) or New Brunswick (7.0%, or 85 people).
- Roughly 1 in 10 (10.2%, or 125 people) were born abroad, mainly in metropolitan France (4.1%) or Africa (4.5%).
- From 2016 to 2021, the net interprovincial migration of the Northwest Territories population whose only first official language spoken is French was close to zero (-10 people).
- While 390 people with French as their only first official language spoken settled in the Northwest Territories from another province or territory from 2016 to 2021, 400 people left the territory during the same period.
Appendix
| Indicator | 1991 | 1996 | 2001 | 2006 | 2011 | 2016 | 2021 |
|---|---|---|---|---|---|---|---|
| percent | |||||||
| French as first official language spokenTable 1 Note 1 | 2.7 | 2.5 | 2.6 | 2.6 | 2.8 | 3.2 | 3.2 |
| French only | 2.6 | 2.3 | 2.4 | 2.3 | 2.5 | 2.8 | 2.8 |
| French and English | 0.2 | 0.2 | 0.2 | 0.3 | 0.3 | 0.4 | 0.4 |
| Knowledge of FrenchTable 1 Note 2 | 7.6 | 7.7 | 8.5 | 9.1 | 9.2 | 10.5 | 10.8 |
| French only | 0.1 | 0.1 | 0.1 | 0.1 | 0.1 | 0.2 | 0.2 |
| French and English | 7.5 | 7.7 | 8.4 | 8.9 | 9.1 | 10.3 | 10.6 |
| French as mother tongue | 3.0 | 2.7 | 2.8 | 2.5 | 2.8 | 3.3 | 3.6 |
| French only | 2.6 | 2.4 | 2.6 | 2.4 | 2.6 | 2.8 | 2.8 |
| French in combination with other languages | 0.4 | 0.3 | 0.3 | 0.1 | 0.2 | 0.4 | 0.9 |
| French spoken most often at home | 1.2 | 1.0 | 1.1 | 1.2 | 1.5 | 1.9 | 2.0 |
| French predominantly | 0.9 | 0.8 | 1.0 | 1.1 | 1.3 | 1.5 | 1.5 |
| French equally with other languages | 0.3 | 0.2 | 0.2 | 0.1 | 0.1 | 0.4 | 0.5 |
| French used most often at workTable 1 Note 3 | Note ..: not available for a specific reference period | Note ..: not available for a specific reference period | 0.7 | 0.9 | 1.0 | 1.1 | 1.2 |
| French predominantly | Note ..: not available for a specific reference period | Note ..: not available for a specific reference period | 0.6 | 0.8 | 0.9 | 0.8 | 0.8 |
| French equally with other languages | Note ..: not available for a specific reference period | Note ..: not available for a specific reference period | 0.1 | 0.1 | 0.1 | 0.3 | 0.4 |
.. not available for a specific reference period
|
|||||||
| FrequencyTable 2 Note 2 | French used at workTable 2 Note 1 | French spoken at home | ||
|---|---|---|---|---|
| number | percent | number | percent | |
| Total population | 20,600 | 100.0 | 40,545 | 100.0 |
| Only | 95 | 0.5 | 440 | 1.1 |
| Mostly | 75 | 0.4 | 170 | 0.4 |
| Equally | 90 | 0.4 | 205 | 0.5 |
| Regularly | 335 | 1.6 | 645 | 1.6 |
| No mention | 20,005 | 97.1 | 39,075 | 96.4 |
|
||||
| Selection of industry sectors | Use of French at work | |||
|---|---|---|---|---|
| At least regularlyTable 3 Note 2 | Most often | |||
| number | percent | number | percent | |
| Total | 595 | 100.0 | 260 | 100.0 |
| Mining, quarrying, and oil and gas extraction | 0 | 0.0 | 0 | 0.0 |
| Construction | 10 | 1.7 | 0 | 0.0 |
| Retail trade | 25 | 4.2 | 10 | 3.8 |
| Transportation and warehousing | 15 | 2.5 | 0 | 0.0 |
| Professional, scientific and technical services | 20 | 3.4 | 10 | 3.8 |
| Administrative and support, waste management and remediation services | 10 | 1.7 | 0 | 0.0 |
| Educational services | 175 | 29.4 | 135 | 51.9 |
| Health care and social assistance | 40 | 6.7 | 15 | 5.8 |
| Accommodation and food services | 10 | 1.7 | 0 | 0.0 |
| Public administration | 225 | 37.8 | 60 | 23.1 |
| Other sectors | 75 | 12.6 | 30 | 11.5 |
|
||||
| Age group | Mother tongue | |||||
|---|---|---|---|---|---|---|
| Total | FrenchTable 4 Note 1 | Other languages | ||||
| number | percent | number | percent | number | percent | |
| Total | 1,470 | 3.6 | 985 | 67.0 | 480 | 1.2 |
| 0 to 14 years | 435 | 5.1 | 255 | 86.4 | 175 | 2.1 |
| 15 to 44 years | 720 | 4.1 | 505 | 72.1 | 215 | 1.3 |
| 45 years and older | 315 | 2.2 | 230 | 47.9 | 90 | 0.6 |
|
||||||
| Immigration status and period of immigration | Knowledge of FrenchTable 5 Note 1 | French spoken at homeTable 5 Note 1 | First official language spoken | |||||
|---|---|---|---|---|---|---|---|---|
| French only | French and English | |||||||
| number | percent | number | percent | number | percent | number | percent | |
| Total | 4,445 | 11.0 | 1,640 | 4.1 | 1,220 | 3.0 | 250 | 0.6 |
| Non-immigrants | 4,025 | 11.2 | 1,445 | 4.0 | 1,100 | 3.1 | 150 | 0.4 |
| Immigrants | 360 | 8.7 | 155 | 3.7 | 90 | 2.5 | 50 | 1.4 |
| Recent immigrantsTable 5 Note 2 | 50 | 6.2 | 30 | 3.7 | 25 | 3.1 | 10 | 1.2 |
| Established immigrantsTable 5 Note 3 | 305 | 9.2 | 130 | 3.9 | 70 | 2.1 | 50 | 1.5 |
| 2011 to 2015 | 45 | 5.6 | 15 | 1.9 | 15 | 1.9 | 10 | 1.3 |
| 2001 to 2010 | 110 | 10.8 | 65 | 6.4 | 40 | 3.9 | 30 | 2.9 |
| 1991 to 2000 | 35 | 5.6 | 15 | 2.4 | 0 | 0.0 | 0 | 0.0 |
| 1980 to 1990 | 35 | 10.6 | 10 | 3.0 | 10 | 3.0 | 0 | 0.0 |
| Before 1980 | 80 | 14.2 | 15 | 2.7 | 10 | 1.8 | 10 | 1.8 |
| Non-permanent residents | 60 | 14.6 | 40 | 9.8 | 20 | 4.9 | 40 | 9.8 |
|
||||||||
- Date modified: