
Ethnicity, Language and Immigration Thematic Series
Key facts on the French language in Yukon in 2021
Skip to text
Text begins
This fact sheet gives an overview of the situation of French in Yukon in 2021. It begins by providing information on the changes in the number and proportion of the population who can have a conversation in French, whose first official language spoken is French, whose mother tongue is French, and who speak French at home or use French at work. Next, it presents information on French-language instruction in primary and secondary schools, French spoken among recent and established immigrants, and the mobility and place of birth of individuals whose first official language spoken is French. Additional data on these topics can be found in the appendix.
The information in this fact sheet is taken from the Census of Population. To learn more about the census concepts and the historical comparability of data, please refer to the 2021 Census of Population Languages Reference Guide and the Instruction in the Minority Official Language Reference Guide.
Start of text boxHighlights
- In Yukon, the number and proportion of people who could have a conversation in French, whose mother tongue is French, who spoke French most often at home, or who had French as their only first official language spoken reached all-time highs in 2021.
- Around one in seven Yukon residents (14.4%, or 5,745 people) could conduct a conversation in French in 2021.
- In 2021, 2,205 people (5.5% of the population) spoke French at least regularly at home. Among those with French as one of their mother tongues, more than two-thirds (70.7%) spoke French regularly at home.
- In 2021, 830 workers living in the territory (3.8%) used French at least regularly at work. Many worked in educational services (28.9%) or public administration (26.5%).
- In 2021, 1 in 10 immigrants (10.2%) could conduct a conversation in French, a lower proportion than that of the non-immigrant population (15.3%).
- In 2021, approximately 7 in 10 Yukon residents (70.3%) whose only first official language spoken was French were born in Canada, but outside Yukon.
Ability to conduct a conversation in French

Data table for Chart 1
| Knowledge of official languages | 1991 | 1996 | 2001 | 2006 | 2011 | 2016 | 2021 |
|---|---|---|---|---|---|---|---|
| number | |||||||
| French and English | 2,570 | 3,210 | 2,895 | 3,445 | 4,420 | 4,900 | 5,660 |
| French only | 25 | 50 | 45 | 105 | 90 | 90 | 85 |
| Sources: Statistics Canada, Census of Population, 1991 to 2021. | |||||||
- In 2021, 5,745 Yukon residents (14.4% of the population) could have a conversation in French. Almost all (98.5%, or 5,660 people) could also do so in English.
- The number of people who were able to have a conversation in French has more than doubled since 1991 (from 2,595 to 5,745). From 2016 to 2021, it continued to rise (+755), reaching a record high.
- From 1991 to 2021, the proportion of the population who can conduct a conversation in French also increased (from 9.4% to 14.4%). In 2021, this was the highest percentage ever observed in a census.
- This upward trend since 1991 was driven by the growth of the population with French as one of their mother tongues (+1,330) and by the increase in bilingualism among people who first learned English in childhood. Of these people, 3,190 (10.0%) could have a conversation in French in 2021, up from 1,585 (6.5%) in 1991.
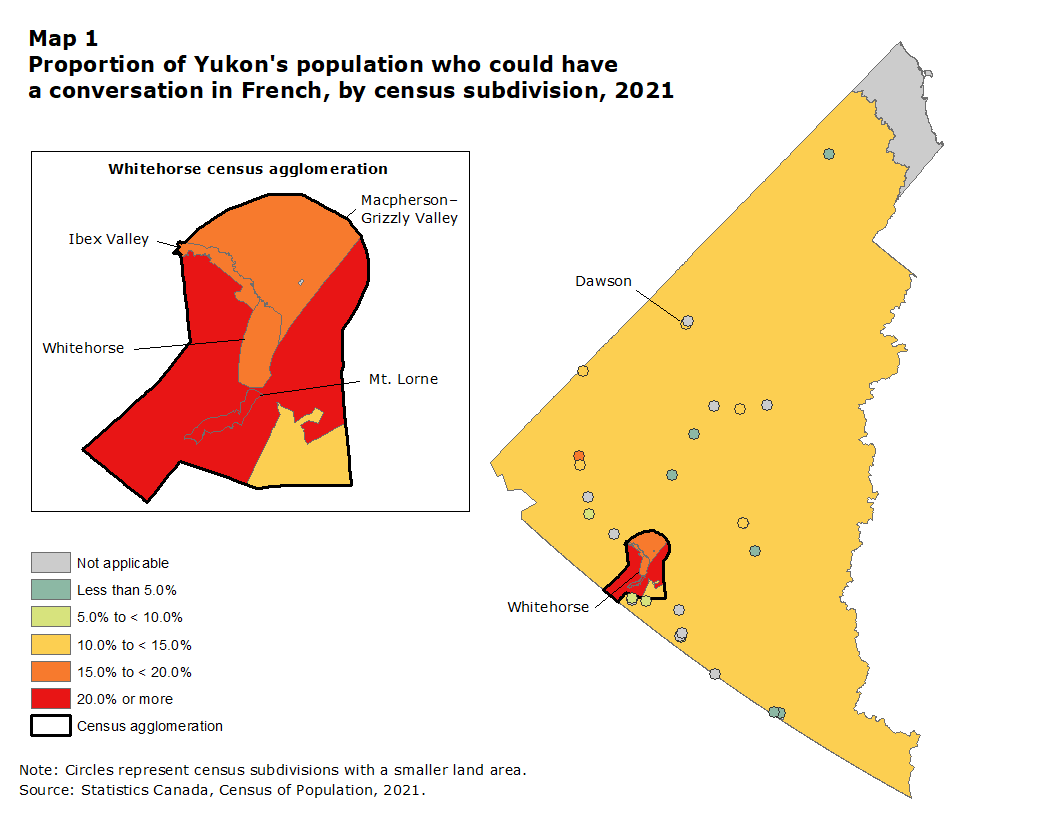
Description for Map 1
This map shows the proportion of the population able to conduct a conversation in French in each census subdivision in Yukon in 2021.
In this map we use 6 distinct colours to signify different values. Grey is used to represent areas for which no data are available. There are 12 census subdivisions in this group.
Teal is used to represent areas in which less than 5% of the population is able to conduct a conversation in French. There are 6 census subdivisions in this group.
Green is used to represent areas in which 5% to less than 10% of the population is able to conduct a conversation in French. There are 4 census subdivisions in this group.
Yellow is used to represent areas in which 10% to less than 15% of the population is able to conduct a conversation in French. There are 7 census subdivisions in this group.
Orange is used to represent areas in which 15% to less than 20% of the population is able to conduct a conversation in French. There are 4 census subdivisions in this group.
Red is used to represent areas in which 20% or more of the population is able to conduct a conversation in French. There are 2 census subdivisions in this group.
The borders of the census agglomeration of Whitehorse are identified by a bold black line.
The boundaries of census subdivisions have been delineated by a gray line or by circles for those with a smaller land area. Their colour was assigned according to the table below.
| Census Subdivision | Population knowing FrenchMap table 1 Note 1 | |
|---|---|---|
| Code | Name | percentage |
| 6001032 | Upper Liard | 0.0 |
| 6001041 | Pelly Crossing | 1.6 |
| 6001043 | Old Crow | 2.1 |
| 6001037 | Ross River | 2.8 |
| 6001012 | Carmacks | 3.4 |
| 6001003 | Watson Lake | 3.5 |
| 6001006 | Teslin | 6.3 |
| 6001048 | Carcross | 6.3 |
| 6001036 | Tagish | 6.5 |
| 6001018 | Haines Junction | 8.6 |
| 6001022 | Mayo | 10.8 |
| 6001004 | Faro | 11.4 |
| 6001045 | Yukon, Unorganized | 12.4 |
| 6001049 | Destruction Bay | 12.5 |
| 6001029 | Dawson | 12.7 |
| 6001058 | Marsh Lake | 12.8 |
| 6001042 | Beaver Creek | 13.3 |
| 6001055 | Ibex Valley | 15.2 |
| 6001039 | Burwash Landing | 15.4 |
| 6001059 | Macpherson - Grizzly Valley | 15.6 |
| 6001009 | Whitehorse | 15.9 |
| 6001060 | Whitehorse, Unorganized | 23.2 |
| 6001044 | Mt. Lorne | 26.9 |
|
||
- In 2021, in 17 of Yukon’s 23 municipalities,Note more than 5% of the population could conduct a conversation in French.
- The municipalities with a population of more than 500 that had the highest proportion of people who spoke French were the capital, Whitehorse (15.9%), Macpherson-Grizzly Valley (15.6%) and Ibex Valley (15.2%). All these municipalities are in the Whitehorse census agglomeration (CA).
- The municipalities with a population of more than 500 that had the highest number of French speakers were Whitehorse (4,425), Macpherson-Grizzly Valley (240) and Dawson (200).
French as the first official language spoken

Data table for Chart 2
| First official language spoken | 1991 | 1996 | 2001 | 2006 | 2011 | 2016 | 2021 |
|---|---|---|---|---|---|---|---|
| number | |||||||
| French only | 835 | 1,080 | 850 | 1,120 | 1,420 | 1,575 | 1,815 |
| French and English | 30 | 70 | 60 | 120 | 125 | 125 | 170 |
| Sources: Statistics Canada, Census of Population, 1991 to 2021. | |||||||
- In 2021, 1,815 Yukon residents (4.6% of the population) had French as their only first official language spoken, and 170 residents (0.4%) had English and French as their first official languages spoken.
- From 1991 to 2021, the number of residents with French as their only first official language spoken rose (+980). Their demographic weight also increased from 3.0% to 4.6%. In 2021, both the number and proportion were the highest ever observed in a census.
- The number of Yukon residents with English and French as their first official languages spoken also rose from 1991 to 2021 (+140).
French as a mother tongue

Data table for Chart 3
| Mother tongue | 1991 | 1996 | 2001 | 2006 | 2011 | 2016 | 2021 |
|---|---|---|---|---|---|---|---|
| number | |||||||
| French only | 865 | 1,110 | 890 | 1,105 | 1,455 | 1,565 | 1,785 |
| French in combination with other languages | 80 | 120 | 90 | 125 | 175 | 250 | 490 |
| Sources: Statistics Canada, Census of Population, 1991 to 2021. | |||||||
- In 2021, 2,275 Yukon residents (5.7% of the population) had French as one of their mother tongues, up from 1991 (945 people, or 3.4%) and 2016 (1,815 people, or 5.1%). In 2021, this number and proportion were the highest ever observed in a census.
- In 2021, 78.5% of these residents (1,785 people) had French as their only mother tongue, while 21.5% (490 people) had French as a mother tongue along with other languages (mainly English).
- For just over two in five (42.3%) people who had French as one of their mother tongues and who were married or in a common-law relationship, French was also the mother tongue of their spouse or partner.
French spoken at home
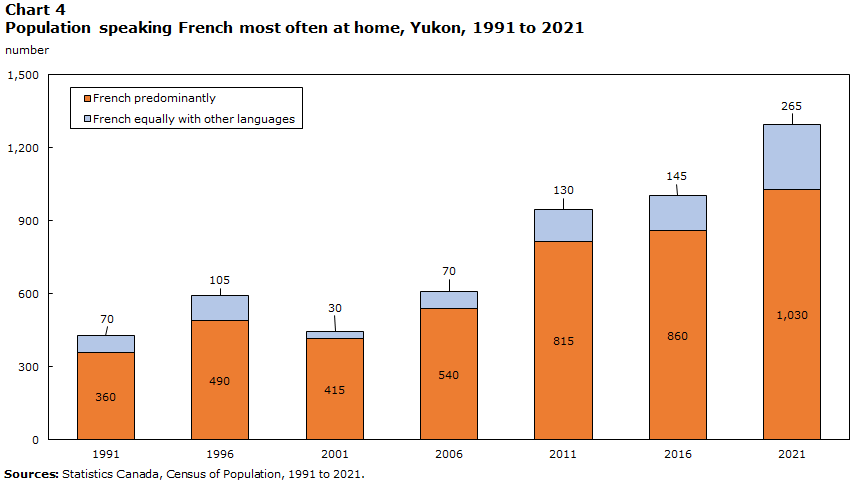
Data table for Chart 4
| Language spoken most often at home | 1991 | 1996 | 2001 | 2006 | 2011 | 2016 | 2021 |
|---|---|---|---|---|---|---|---|
| number | |||||||
| French predominantly | 360 | 490 | 415 | 540 | 815 | 860 | 1,030 |
| French equally with other languages | 70 | 105 | 30 | 70 | 130 | 145 | 265 |
| Sources: Statistics Canada, Census of Population, 1991 to 2021. | |||||||
- In 2021, 2,205 residents of Yukon (5.5% of the population) spoke French at least regularly at home.
- Almost three in five of these residents (58.7%, or 1,295 people) spoke French most often at home, predominantly or equally with other languages. This was up from 1991 (+1,260) and 2016 (+290).
- Moreover, 910 people (41.3%) spoke French regularly at home in addition to their main language (usually English).
- Among people with French as their mother tongue, alone or with other languages:
- More than two-thirds (70.7%, or 1,605 people) spoke it at least regularly at home in 2021. However, this rate varied by age, ranging from 86.6% among those under age 15 to 59.8% among those aged 45 and older.
- Just over half (52.4%, or 1,190 people) spoke French most often at home, predominantly or equally with other languages, up from 1991 (44.1%, or 415 people).
- Among Yukon residents whose mother tongue is not French, 600 (1.6%) spoke French at least regularly at home.
- The vast majority (82.5%, or 495 people) spoke French at home as a secondary language while speaking another language more often (usually English).
French used at work

Data table for Chart 5
| Language used most often at work | 2001 | 2006 | 2011 | 2016 | 2021 |
|---|---|---|---|---|---|
| number | |||||
| French predominantly | 105 | 170 | 150 | 245 | 255 |
| French equally with other languages | 60 | 30 | 50 | 70 | 75 |
|
Notes: Among workers who were employed during the census reference week. In 2021, changes were made to the census questions regarding languages used at work. Comparisons with previous cycles must therefore be made with caution. For more information, consult the Languages Reference Guide, Census of Population, 2021. Sources: Statistics Canada, Census of Population, 2001, 2006, 2016 and 2021, and the National Household Survey of 2011. |
|||||
- In 2021, 830 Yukon residents used French at least regularly at work, accounting for 3.8% of the territory’s workers.Note
- In Yukon, 330 people, or 1.5% of the territory’s workers, used French most often at work, predominantly or equally with other languages.
- The number of people who used French most often at work increased from 160 in 2001 to 330 in 2021.
- In 2021, among workers who used French at least regularly at work, most worked in educational services (28.9%, or 240 people), public administration (26.5%, or 220 people) or health care and social assistance (10.2%, or 85 people).Note
- Among those who spoke French most often at home, predominantly or with other languages, 52.0% also used French regularly at work.
- Among workers who regularly used French at work, close to 9 in 10 (89.8%) lived in the Whitehorse CA.
Instruction in French in primary and secondary schools
- In 2021, 1,155 (14.1%) of the 8,205 children under 18 living in the territory were eligibleNote for instruction in French.
- Almost 9 in 10 eligible children (86.1%, or 995 children) lived in the Whitehorse CA.
- In Yukon, 2,475 people were attending or had already attended a regular French program in a French-language school in Canada, representing 6.6% of the population aged 5 and older.
- Of those who had never attended a French-language school, 3,260 (8.7%) had actually attended a French immersion program in an English-language school.
- Among school-aged childrenNote who were eligible for instruction in French, 580 (71.6%) were attending or had already attended a regular French program in a French-language school in Canada.
French among immigrants
- In 2021, the proportions of recentNote and establishedNote immigrants living in Yukon who could conduct a conversation in French (11.6% and 9.9%, respectively) were lower than the proportion of the non-immigrant population (15.3%).
- The proportion of recent immigrants who spoke French at least regularly at home (7.1%) was higher than the one of the non-immigrant population (5.8%). The opposite was observed for the proportion of established immigrants (4.5%).
- The proportion of immigrants with French as their only first official language spoken (4.8%) was similar to the proportion for the non-immigrant population (4.4%). However, the proportion of immigrants who had English and French as their first official languages spoken (2.0%) was higher than that of the non-immigrant population (0.2%).
Mobility and birthplace of the French-speaking population

Data table for Chart 6
| Place of birth | Percent |
|---|---|
| Yukon | 12.6 |
| Quebec | 49.7 |
| Ontario | 7.4 |
| Alberta | 4.9 |
| Elsewhere in Canada | 8.6 |
| Outside Canada | 17.1 |
| Source: Statistics Canada, Census of Population, 2021. | |
- In 2021, among Yukon residents whose only first official language spoken is French, one in eight (12.6%, or 220 people) were born in the territory.
- Approximately 7 in 10 (70.3%, or 1,235 people) were born in another province or territory, with large proportions coming from Quebec (49.7%, or 865 people), Ontario (7.4%, or 125 people) or Alberta (4.9%, or 85 people).
- More than 1 in 6 (17.1%, or 300 people) were born abroad, mainly in metropolitan France (11.7%).
- From 2016 to 2021, the net interprovincial migration of the Yukon population whose only first official language spoken is French was positive (+45).
- While 330 people with French as their only first official language spoken settled in Yukon from another province or territory from 2016 to 2021, 285 people left the territory during the same period.
Appendix
| Indicator | 1991 | 1996 | 2001 | 2006 | 2011 | 2016 | 2021 |
|---|---|---|---|---|---|---|---|
| percent | |||||||
| French as first official language spokenTable 1 Note 1 | 3.1 | 3.8 | 3.2 | 4.1 | 4.6 | 4.8 | 5.0 |
| French only | 3.0 | 3.5 | 3.0 | 3.7 | 4.2 | 4.4 | 4.6 |
| French and English | 0.1 | 0.2 | 0.2 | 0.4 | 0.4 | 0.4 | 0.4 |
| Knowledge of FrenchTable 1 Note 2 | 9.4 | 10.6 | 10.3 | 11.8 | 13.4 | 14.0 | 14.4 |
| French only | 0.1 | 0.2 | 0.2 | 0.3 | 0.3 | 0.3 | 0.2 |
| French and English | 9.3 | 10.5 | 10.2 | 11.4 | 13.1 | 13.8 | 14.2 |
| French as mother tongue | 3.4 | 4.0 | 3.4 | 4.1 | 4.8 | 5.1 | 5.7 |
| French only | 3.1 | 3.6 | 3.1 | 3.7 | 4.3 | 4.4 | 4.5 |
| French in combination with other languages | 0.3 | 0.4 | 0.3 | 0.4 | 0.5 | 0.7 | 1.2 |
| French spoken most often at home | 1.6 | 2.0 | 1.6 | 2.0 | 2.8 | 2.8 | 3.3 |
| French predominantly | 1.3 | 1.6 | 1.5 | 1.8 | 2.4 | 2.4 | 2.6 |
| French equally with other languages | 0.3 | 0.3 | 0.1 | 0.2 | 0.4 | 0.4 | 0.7 |
| French used most often at workTable 1 Note 3 | Note ..: not available for a specific reference period | Note ..: not available for a specific reference period | 1.0 | 1.2 | 1.0 | 1.6 | 1.5 |
| French predominantly | Note ..: not available for a specific reference period | Note ..: not available for a specific reference period | 0.7 | 1.0 | 0.8 | 1.2 | 1.2 |
| French equally with other languages | Note ..: not available for a specific reference period | Note ..: not available for a specific reference period | 0.4 | 0.2 | 0.3 | 0.4 | 0.3 |
.. not available for a specific reference period
|
|||||||
| FrequencyTable 2 Note 2 | French used at workTable 2 Note 1 | French spoken at home | ||
|---|---|---|---|---|
| number | percent | number | percent | |
| Total population | 21,905 | 100.0 | 39,840 | 100.0 |
| Only | 175 | 0.8 | 740 | 1.9 |
| Mostly | 85 | 0.4 | 295 | 0.7 |
| Equally | 75 | 0.3 | 265 | 0.7 |
| Regularly | 500 | 2.3 | 910 | 2.3 |
| No mention | 21,075 | 96.2 | 37,635 | 94.5 |
|
||||
| Selection of industry sectors | Use of French at work | |||
|---|---|---|---|---|
| At least regularlyTable 3 Note 2 | Most often | |||
| number | percent | number | percent | |
| Total | 830 | 100.0 | 330 | 100.0 |
| Mining, quarrying, and oil and gas extraction | 10 | 1.2 | 0 | 0.0 |
| Construction | 40 | 4.8 | 15 | 4.5 |
| Retail trade | 40 | 4.8 | 0 | 0.0 |
| Transportation and warehousing | 10 | 1.2 | 0 | 0.0 |
| Professional, scientific and technical services | 25 | 3.0 | 15 | 4.5 |
| Educational services | 240 | 28.9 | 160 | 48.5 |
| Health care and social assistance | 85 | 10.2 | 30 | 9.1 |
| Arts, entertainment and recreation | 40 | 4.8 | 0 | 0.0 |
| Accommodation and food services | 25 | 3.0 | 10 | 3.0 |
| Public administration | 220 | 26.5 | 35 | 10.6 |
| Other sectors | 100 | 12.0 | 65 | 19.7 |
|
||||
| Age group | Mother tongue | |||||
|---|---|---|---|---|---|---|
| Total | FrenchTable 4 Note 1 | Other languages | ||||
| number | percent | number | percent | number | percent | |
| Total | 2,205 | 5.5 | 1,605 | 70.7 | 600 | 1.6 |
| 0 to 14 years | 565 | 8.3 | 355 | 86.6 | 205 | 3.2 |
| 15 to 44 years | 1,015 | 6.2 | 755 | 72.2 | 265 | 1.7 |
| 45 years and older | 625 | 3.8 | 490 | 59.8 | 135 | 0.9 |
|
||||||
| Immigration status and period of immigration | Knowledge of FrenchTable 5 Note 1 | French spoken at homeTable 5 Note 1 | First official language spoken | |||||
|---|---|---|---|---|---|---|---|---|
| French only | French and English | |||||||
| number | percent | number | percent | number | percent | number | percent | |
| Total | 5,735 | 14.5 | 2,265 | 5.7 | 1,750 | 4.4 | 195 | 0.5 |
| Non-immigrants | 5,090 | 15.3 | 1,925 | 5.8 | 1,475 | 4.4 | 75 | 0.2 |
| Immigrants | 550 | 10.2 | 275 | 5.1 | 205 | 4.8 | 85 | 2.0 |
| Recent immigrantsTable 5 Note 2 | 130 | 11.6 | 80 | 7.1 | 60 | 5.3 | 25 | 2.2 |
| Established immigrantsTable 5 Note 3 | 420 | 9.9 | 190 | 4.5 | 160 | 3.8 | 50 | 1.2 |
| 2011 to 2015 | 75 | 7.3 | 30 | 2.9 | 25 | 2.4 | 25 | 2.4 |
| 2001 to 2010 | 155 | 14.7 | 95 | 9.0 | 70 | 6.6 | 30 | 2.8 |
| 1991 to 2000 | 75 | 11.0 | 35 | 5.1 | 35 | 5.1 | 10 | 1.5 |
| 1980 to 1990 | 35 | 9.0 | 15 | 3.8 | 10 | 2.6 | 10 | 2.6 |
| Before 1980 | 75 | 6.8 | 25 | 2.3 | 10 | 0.9 | 0 | 0.0 |
| Non-permanent residents | 100 | 10.8 | 70 | 7.6 | 55 | 5.9 | 35 | 3.8 |
|
||||||||
- Date modified: