
Ethnicity, Language and Immigration Thematic Series
Key facts on the French language in Nova Scotia in 2021
Skip to text
Text begins
This fact sheet gives an overview of the situation of French in Nova Scotia in 2021. First, it provides information on the changes in the number and proportion of people in the population who can conduct a conversation in French, whose first official language spoken is French, whose mother tongue is French, who speak French at home or use French at work. Next, it presents information on French-language instruction in elementary and secondary schools, on French spoken among recent and established immigrants, as well as on the mobility and place of birth of individuals whose first official language spoken is French. Additional data on these topics can be found in the appendix.
The information presented in this fact sheet comes from the Census of Population. To learn more about census concepts and the historical comparability of data, please refer to the 2021 Census of Population Languages Reference Guide and the Instruction in the Minority Official Language Reference Guide.
Highlights
- In 2021, 99,540 residents of Nova Scotia were able to conduct a conversation in French. This was up from the numbers recorded in 1991 (+21,495) and in 2016 (+3,455). The relative proportion of these residents also increased from 8.8% in 1991 to 10.6% in 2006, then fell to 10.4% in 2021.
- In 2021, 28,635 people (3.0% of the population) spoke French at least regularly at home. Among those with French as one of their mother tongues, more than half (56.6%) spoke French regularly at home.
- In 2021, 13,880 workers living in the province used French at least regularly at work (3.3%). A large proportion of these people worked in educational services (22.9%) or public administration (18.8%).
- Almost 1 in 11 immigrants (8.8%) could conduct a conversation in French. This proportion was higher among immigrants admitted before 2016 (10.3%) than among immigrants admitted between 2016 and 2021 (5.2%).
- Nearly three in five (57.1%) Nova Scotians whose only first official language spoken was French in 2021 were born in that province.
Ability to conduct a conversation in French

Data table for Chart 1
| Knowledge of official languages | 1991 | 1996 | 2001 | 2006 | 2011 | 2016 | 2021 |
|---|---|---|---|---|---|---|---|
| number | |||||||
| French and English | 76,465 | 83,985 | 90,265 | 95,015 | 93,435 | 95,380 | 98,940 |
| French only | 1,580 | 1,370 | 790 | 1,005 | 875 | 705 | 600 |
| Sources: Statistics Canada, Census of Population, 1991 to 2021. | |||||||
- In 2021, 99,540 residents of Nova Scotia could conduct a conversation in French. Almost all (99.4%, or 98,940 people) could also do so in English.
- The number of people who can have a conversation in French has increased since 1991 (+21,495) and continued to rise from 2016 to 2021 (+3,455).
- The proportion of the population who can conduct a conversation in French has increased over the past 30 years, rising from 8.8% in 1991 to 10.4% in 2021. However, this proportion is still lower than the peak reached in 2006 (10.6%).
- This upward trend since 1991 is mainly driven by the increase in bilingualism among individuals who learned English first during their childhood. Among people with English as their mother tongue, 39,435 (4.8%) were able to have a conversation in French in 1991, a number which rose to 62,945 (7.4%) in 2021.
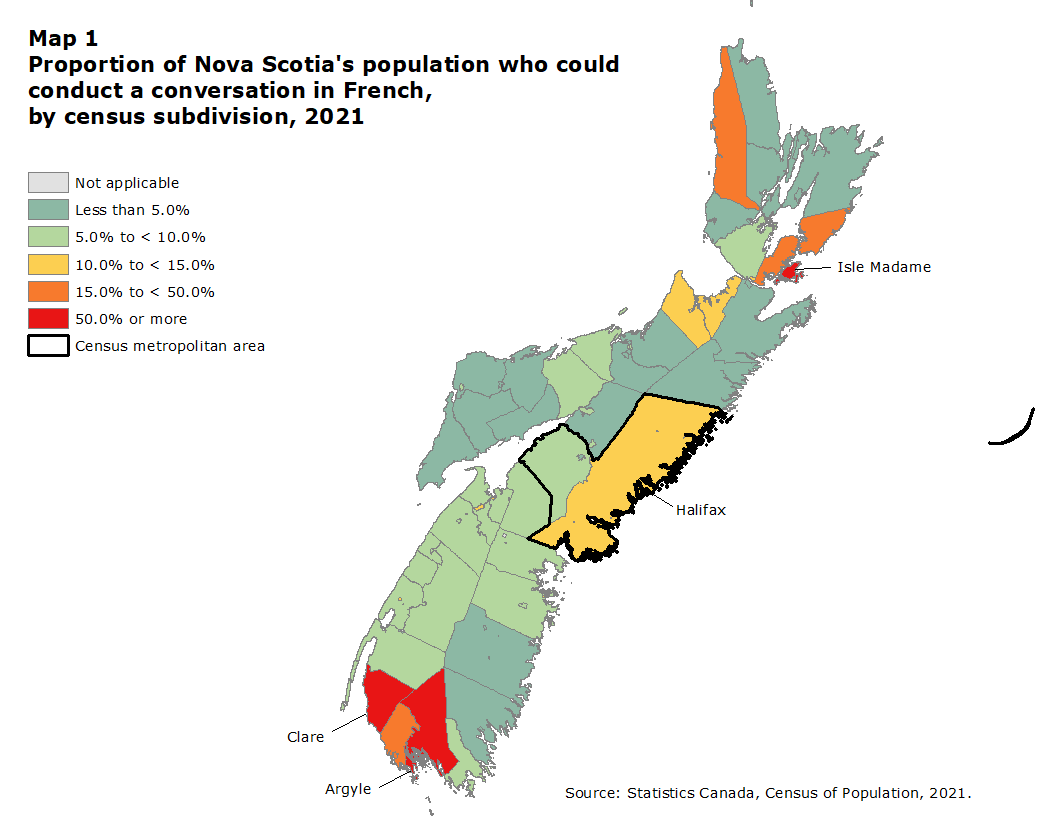
Description for Map 1
This map shows the proportion of the population able to conduct a conversation in French in each census subdivision in Nova Scotia in 2021.
In this map we use 6 distinct colours to signify different values. A solid grey colour is used to represent areas for which no data are available. There are 11 census subdivisions in this group.
A solid teal colour is used to represent areas in which less than 5% of the population is able to conduct a conversation in French. There are 38 census subdivisions in this group.
A solid light green colour is used to represent areas in which 5% to less than 10% of the population is able to conduct a conversation in French. There are 29 census subdivisions in this group.
A solid yellow colour is used to represent areas in which 10% to less than 15% of the population is able to conduct a conversation in French. There are 9 census subdivisions in this group.
A solid orange colour is used to represent areas in which 15% to less than 50% of the population is able to conduct a conversation in French. There are 5 census subdivisions in this group.
A solid red colour is used to represent areas in which 50% or more of the population is able to conduct a conversation in French. There are 3 census subdivisions in this group.
The borders of the census metropolitan area of Halifax are identified by a bold black line.
The borders of each census subdivision are delineated by a grey line and each census subdivision is assigned a colour based on the table below.
The data is available in CSV format
- In 2021, in 38 of Nova Scotia’s 84 municipalities, Note less than 5% of the population could conduct a conversation in French.
- The municipalities with a population of over 500 that had the highest proportion of people who spoke French were Clare (69.6%), Argyle (municipal district [MD]) (57.2%) and Richmond Subdivision C (56.0%), which includes Isle Madame.
- The municipalities with a population of over 500 that had the largest number of people who spoke French were the capital, Halifax (53,755), Clare (5,255) and Argyle (MD) (4,475).
French as first official language spoken

Data table for Chart 2
| First official language spoken | 1991 | 1996 | 2001 | 2006 | 2011 | 2016 | 2021 |
|---|---|---|---|---|---|---|---|
| number | |||||||
| French only | 35,470 | 34,090 | 33,175 | 31,510 | 29,550 | 28,490 | 26,775 |
| French and English | 830 | 1,040 | 1,185 | 1,430 | 1,560 | 1,755 | 2,325 |
| Sources: Statistics Canada, Census of Population, 1991 to 2021. | |||||||
- In 2021, there were 26,775 Nova Scotians who had French as their only first official language spoken (2.8% of the population) and 2,325 had both French and English as their first official languages spoken (0.2% of the population).
- From 1991 to 2021, there was a decline in both the number of people with French as their only first official language spoken (-8,695) and the relative proportion of this population (from 3.9% to 2.8%).
- In 2021, 2,325 people had both French and English as their first official languages spoken, up from 1991 (+1,495).
French as a mother tongue

Data table for Chart 3
| Mother tongue | 1991 | 1996 | 2001 | 2006 | 2011 | 2016 | 2021 |
|---|---|---|---|---|---|---|---|
| number | |||||||
| French only | 36,635 | 35,040 | 34,025 | 32,540 | 31,110 | 29,465 | 27,345 |
| French in combination with other languages | 1,795 | 2,560 | 2,725 | 2,380 | 3,475 | 3,880 | 7,330 |
| Sources: Statistics Canada, Census of Population, 1991 to 2021. | |||||||
- In 2021, 34,670 residents of Nova Scotia (3.6% of the population) had French as one of their mother tongues, up from 2016 (+1,325). However, this number is lower than in 1991 (-3,750)
- In 2021, 78.9% of these people (27,345) had French as their only mother tongue and 21.1% (7,330 people) had French as their mother tongue along with other languages (mainly English).
- Among people who were married or in a common-law union and who had French as one of their mother tongues, nearly two in five (38.4%) were in a relationship with another person with French as a mother tongue.
French spoken at home

Data table for Chart 4
| Language spoken most often at home | 1991 | 1996 | 2001 | 2006 | 2011 | 2016 | 2021 |
|---|---|---|---|---|---|---|---|
| number | |||||||
| French predominantly | 21,590 | 19,970 | 19,000 | 17,165 | 15,940 | 14,460 | 12,680 |
| French equally with other languages | 1,355 | 1,500 | 1,610 | 1,415 | 2,105 | 2,565 | 2,940 |
| Sources: Statistics Canada, Census of Population, 1991 to 2021. | |||||||
- In 2021, 28,635 Nova Scotians (3.0% of the population) spoke French at least regularly at home.
- More than half of them (15,625, or 54.6%) spoke French most often at home, predominantly or equally with other languages. This number was lower than in 2016 (-1,415 people).
- A total of 13,015 people (45.5%) spoke French regularly at home in addition to their main language (usually English).
- Among people with French as their mother tongue, alone or with other languages:
- 56.6% spoke it at least regularly at home in 2021 (19,610). However, this rate varied with age, ranging from 78.0% among people under 15 years to 51.0% among those aged 45 and older.
- 40.9% spoke French most often at home, predominantly or equally with other languages (14,165 people), down from 1991 (21,905 people, or 57.0%).
- Among people whose mother tongue is not French, 9,025 (1.0%) spoke French regularly at home.
- Of these, the vast majority (7,565 people, or 83.8%) spoke French at home as a secondary language and spoke another language more often (usually English).
French used at work

Data table for Chart 5
| Language used most often at work | 2001 | 2006 | 2011 | 2016 | 2021 |
|---|---|---|---|---|---|
| number | |||||
| French predominantly | 6,045 | 5,790 | 5,590 | 5,230 | 4,750 |
| French equally with other languages | 1,620 | 1,855 | 1,595 | 1,900 | 1,370 |
|
Notes: Among workers who were employed during the census reference week. In 2021, changes were made to the census questions regarding languages used at work. Comparisons with previous cycles must therefore be made with caution. For more information, consult the Languages Reference Guide, Census of Population, 2021. Sources: Statistics Canada, Census of Population, 2001, 2006, 2016 and 2021, and the National Household Survey of 2011. |
|||||
- In 2021, 13,880 Nova Scotians used French at least regularly at work, accounting for 3.3% of the province’s workers.Note
- In the province, 6,115 people, or 1.4% of the province’s workers, used French most often at work, be it predominantly or equally with other languages.
- The number of people who used French most often at work decreased from 7,665 in 2001 to 6,115 in 2021.
- In 2021, among workers who used French at least regularly at work, most worked in educational services (3,185 people, or 22.9%), in public administration (2,615 people, or 18.8%), or in health care and social assistance (1,490 people, or 10.7%).Note
- Among people who spoke French most often at home, predominantly or equally with other languages, 66.1% also used it regularly at work.
- Nearly half (49.4%) of workers using French regularly at work were living in the Halifax CMA.
Instruction in French in primary and secondary schools
- In 2021, 16,800 (10.0%) of the 168,460 children under 18 living in the province were eligibleNote for instruction in French.
- More than half (8,580 children) lived in the Halifax CMA.
- In Nova Scotia, 38,835 people attended or had already attended a regular French program in a French‑language school in Canada, representing 4.3% of the population aged 5 and older.
- Of those who had never attended a French-language school, 69,870 (7.7%) had attended a French immersion program in an English-language school.
- Among school-aged childrenNote who were eligible for instruction in French, 8,070 (63.3%) were attending or had already attended a French-language school.
French among immigrants
- In 2021, the proportions of recentNote immigrants and establishedNote immigrants living in Nova Scotia who could conduct a conversation in French (5.2% and 10.3%, respectively) were lower than the proportion among the non-immigrant population (10.7%).
- The proportions of recent immigrants and established immigrants who spoke French at least regularly at home (2.6% and 3.1%, respectively) were similar among the non-immigrant population (3.0%).
- The proportions of recent immigrants and established immigrants who had French as their only first official language spoken (1.5% and 1.9%, respectively) were lower than among the non-immigrant population (2.9%). However, the proportions of recent and established immigrants who had French and English as their first official languages spoken (1.3% and 1.2%, respectively) were higher than for the non‑immigrant population (0.1%).
- In 2021, more than two-thirds (67.8%) of immigrants with French as their only first official language spoken were living in the Halifax CMA.
Mobility and birthplace of the French-speaking population

Data table for Chart 6
| Place of birth | Percent |
|---|---|
| Nova Scotia | 57.1 |
| Quebec | 18.9 |
| New Brunswick | 10.3 |
| Ontario | 5.4 |
| Elsewhere in Canada | 2.2 |
| Outside Canada | 6.3 |
| Source: Statistics Canada, Census of Population, 2021. | |
- In 2021, among Nova Scotians whose only first official language spoken is French, nearly 3 in 5 (57.1%, or 15,295 people) were born in the province.
- More than a third (36.7%, or 9,830 people) were born in another province or territory, with significant proportions coming from Quebec (18.9%, or 5,055 people), New Brunswick (10.3%, or 2,755 people) or Ontario (5.4% or 1,440 people).
- About 1 in 15 people (6.3%, or 1,675 people) were born abroad, specifically in metropolitan France (1.6%), Africa (2.2%) or the United States (0.6%).
- From 2016 to 2021, the net interprovincial migration of the Nova Scotia population whose only first official language spoken is French was positive (+655).
- While 3,025 people with French as their first official language spoken settled in Nova Scotia from another province or territory from 2016 to 2021, 2,370 people left the province during the same period.
Appendix
| Indicator | 1991 | 1996 | 2001 | 2006 | 2011 | 2016 | 2021 |
|---|---|---|---|---|---|---|---|
| percent | |||||||
| French as first official language spokenTable 1 Note 1 | 4.0 | 3.8 | 3.8 | 3.6 | 3.3 | 3.2 | 3.0 |
| French only | 3.9 | 3.7 | 3.6 | 3.4 | 3.2 | 3.0 | 2.8 |
| French and English | 0.1 | 0.1 | 0.1 | 0.2 | 0.2 | 0.2 | 0.2 |
| Knowledge of FrenchTable 1 Note 2 | 8.8 | 9.5 | 10.1 | 10.6 | 10.4 | 10.5 | 10.4 |
| French only | 0.2 | 0.2 | 0.1 | 0.1 | 0.1 | 0.1 | 0.1 |
| French and English | 8.6 | 9.3 | 10.1 | 10.5 | 10.3 | 10.5 | 10.3 |
| French as mother tongue | 4.3 | 4.2 | 4.1 | 3.9 | 3.8 | 3.7 | 3.6 |
| French only | 4.1 | 3.9 | 3.8 | 3.6 | 3.4 | 3.2 | 2.9 |
| French in combination with other languages | 0.2 | 0.3 | 0.3 | 0.3 | 0.4 | 0.4 | 0.8 |
| French spoken most often at home | 2.6 | 2.4 | 2.3 | 2.1 | 2.0 | 1.8 | 1.6 |
| French predominantly | 2.4 | 2.2 | 2.1 | 1.9 | 1.8 | 1.6 | 1.3 |
| French equally with other languages | 0.2 | 0.2 | 0.2 | 0.2 | 0.2 | 0.3 | 0.3 |
| French used most often at workTable 1 Note 3 | Note ..: not available for a specific reference period | Note ..: not available for a specific reference period | 1.9 | 1.8 | 1.6 | 1.7 | 1.4 |
| French predominantly | Note ..: not available for a specific reference period | Note ..: not available for a specific reference period | 1.5 | 1.3 | 1.3 | 1.2 | 1.1 |
| French equally with other languages | Note ..: not available for a specific reference period | Note ..: not available for a specific reference period | 0.4 | 0.4 | 0.4 | 0.4 | 0.3 |
.. not available for a specific reference period
|
|||||||
| Frequency | French used at workTable 2 Note 1 | French spoken at home | ||
|---|---|---|---|---|
| number | percent | number | percent | |
| Total population | 425,190 | 100.0 | 958,990 | 100.0 |
| Only | 2,735 | 0.6 | 9,800 | 1.0 |
| Mostly | 2,010 | 0.5 | 2,880 | 0.3 |
| Equally | 1,370 | 0.3 | 2,945 | 0.3 |
| Regularly | 7,770 | 1.8 | 13,010 | 1.4 |
| No mention | 411,305 | 96.7 | 930,355 | 97.0 |
|
||||
| Selection of industry sectors | Use of French at work | |||
|---|---|---|---|---|
| At least regularlyTable 3 Note 2 | Most often | |||
| number | percent | number | percent | |
| Total | 13,880 | 100.0 | 6,115 | 100.0 |
| Construction | 405 | 2.9 | 185 | 3.0 |
| Manufacturing | 740 | 5.3 | 350 | 5.7 |
| Retail trade | 940 | 6.8 | 295 | 4.8 |
| Transportation and warehousing | 435 | 3.1 | 135 | 2.2 |
| Professional, scientific and technical services | 680 | 4.9 | 185 | 3.0 |
| Administrative and support, waste management and remediation services | 270 | 1.9 | 100 | 1.6 |
| Educational services | 3,185 | 22.9 | 2,485 | 40.6 |
| Health care and social assistance | 1,490 | 10.7 | 520 | 8.5 |
| Accommodation and food services | 260 | 1.9 | 95 | 1.6 |
| Public administration | 2,615 | 18.8 | 420 | 6.9 |
| Other sectors | 2,805 | 20.2 | 1,315 | 21.5 |
|
||||
| Age group | Mother tongue | |||||
|---|---|---|---|---|---|---|
| Total | FrenchTable 4 Note 1 | Other languages | ||||
| number | percent | number | percent | number | percent | |
| Total | 28,635 | 3.0 | 19,610 | 56.6 | 9,025 | 1.0 |
| 0 to 14 years | 5,540 | 4.1 | 2,730 | 78.0 | 2,810 | 2.1 |
| 15 to 44 years | 10,155 | 3.0 | 6,350 | 60.3 | 3,805 | 1.2 |
| 45 years and older | 12,940 | 2.7 | 10,530 | 51.0 | 2,410 | 0.5 |
|
||||||
| Immigration status and period of immigration | Knowledge of FrenchTable 5 Note 1 | French spoken at homeTable 5 Note 1 | First official language spoken | |||||
|---|---|---|---|---|---|---|---|---|
| French only | French and English | |||||||
| number | percent | number | percent | number | percent | number | percent | |
| Total | 98,535 | 10.6 | 27,675 | 3.0 | 26,795 | 2.8 | 2,220 | 0.2 |
| Non-immigrants | 92,240 | 10.7 | 25,595 | 3.0 | 25,290 | 2.9 | 1,160 | 0.1 |
| Immigrants | 6,285 | 8.8 | 2,085 | 2.9 | 1,290 | 1.8 | 890 | 1.2 |
| Recent immigrantsTable 5 Note 2 | 1,120 | 5.2 | 550 | 2.6 | 330 | 1.5 | 280 | 1.3 |
| Established immigrantsTable 5 Note 3 | 5,170 | 10.3 | 1,540 | 3.1 | 955 | 1.9 | 615 | 1.2 |
| 2011 to 2015 | 710 | 8.0 | 335 | 3.8 | 140 | 1.6 | 120 | 1.4 |
| 2001 to 2010 | 1,315 | 10.6 | 460 | 3.7 | 275 | 2.2 | 240 | 1.9 |
| 1991 to 2000 | 640 | 9.6 | 180 | 2.7 | 120 | 1.8 | 100 | 1.5 |
| 1980 to 1990 | 700 | 12.8 | 175 | 3.2 | 95 | 1.7 | 90 | 1.6 |
| Before 1980 | 1,805 | 10.8 | 395 | 2.4 | 335 | 2.0 | 60 | 0.4 |
| Non-permanent residents | 765 | 3.4 | 325 | 1.5 | 220 | 1.0 | 165 | 0.7 |
|
||||||||
- Date modified: