
Ethnicity, Language and Immigration Thematic Series
Key facts on the French language in Prince Edward Island in 2021
Skip to text
Text begins
This fact sheet gives an overview of the situation of French in Prince Edward Island in 2021. First, it provides information on the changes in the number and proportion of people in the population who can conduct a conversation in French, whose first official language spoken is French, whose mother tongue is French, and who speak French at home or use French at work. Next, it presents information on French-language instruction in elementary and secondary schools, on French spoken among recent and established immigrants, as well as on the mobility and place of birth of individuals whose first official language spoken is French. Additional data on these topics can be found in the appendix.
The information presented in this fact sheet comes from the Census of Population. To learn more about census concepts and the historical comparability of data, please refer to the 2021 Census of Population Languages Reference Guide and the Instruction in the Minority Official Language Reference Guide.
Highlights
- In 2021, 19,520 Prince Edward Islanders could have a conversation in French. This number was up from 2016 (+1,570) and 1991 (+6,300). The relative proportion of these residents also rose from 10.3% in 1991 to 12.8% in 2021.
- In 2021, 4,610 people spoke French at least regularly at home (3.0% of the population). Among those with French as one of their mother tongues, over half (54.3%) spoke French regularly at home.
- In 2021, 2,715 workers living in the province (3.6%) used French at least regularly at work. The majority worked in public administration (30.2%) or educational services (25.4%).
- Almost 1 in 12 immigrants (8.1%) could conduct a conversation in French. This proportion was higher among immigrants admitted before 2016 (10.1%) than among those admitted between 2016 and 2021 (5.1%).
- More than half (56.6%) of Prince Edward Islanders who had French as their only first official language spoken in 2021 were born in that province.
Ability to conduct a conversation in French

Data table for Chart 1
| Knowledge of official languages | 1991 | 1996 | 2001 | 2006 | 2011 | 2016 | 2021 |
|---|---|---|---|---|---|---|---|
| number | |||||||
| French and English | 12,950 | 14,575 | 15,990 | 17,100 | 17,005 | 17,835 | 19,385 |
| French only | 275 | 165 | 100 | 55 | 130 | 115 | 135 |
| Sources: Statistics Canada, Census of Population, 1991 to 2021. | |||||||
- In 2021, 19,520 Prince Edward Islanders (12.8%) could conduct a conversation in French. Almost all (99.3%, or 19,385 people) could also have a conversation in English.
- The number of people who could have a conversation in French rose from 1991 to 2016 (+4,730), and continued its rise between 2016 and 2021 (+1,570).
- The proportion of the population who can conduct a conversation in French rose from 10.3% in 1991 to 12.8% in 2021. However, it has remained stable over the past 15 years (12.8% in 2006).
- This upward trend since 1991 is mainly due to the increase in bilingualism among those who learned English first in their childhood: among them, while 7,725 people (6.4%) could have a conversation in French in 1991, 13,720 (10.4%) could do so in 2021.

Description for Map 1
This map shows the proportion of the population able to conduct a conversation in French in each census subdivision in Prince Edward Island in 2021.
In this map we use 6 distinct colours to signify different values. A solid grey colour is used to represent areas for which no data are available. There is 1 census subdivision in this group.
A solid teal colour is used to represent areas in which less than 5% of the population is able to conduct a conversation in French. There are 8 census subdivisions in this group.
A solid light green colour is used to represent areas in which 5% to less than 10% of the population is able to conduct a conversation in French. There are 37 census subdivisions in this group.
A solid yellow colour is used to represent areas in which 10% to less than 15% of the population is able to conduct a conversation in French. There are 32 census subdivisions in this group.
A solid orange colour is used to represent areas in which 15% to less than 50% of the population is able to conduct a conversation in French. There are 15 census subdivisions in this group.
A solid red colour is used to represent areas in which 50% or more of the population is able to conduct a conversation in French. There are 3 census subdivisions in this group.
The borders of the census agglomerations of Charlottetown and Summerside are identified by a bold black line.
The borders of each census subdivision are delineated by a grey line and each census subdivision is assigned a colour based on the table below.
The data is available in CSV format
- In 2021, in 8 of Prince Edward Island’s 97 municipalities, Note less than 5% of its population could have a conversation in French. In addition, in 18 of the 97 municipalities, more than 15% of the population could conduct a conversation in French.
- The municipalities with a population of more than 500 that had the highest proportion of people who could speak French were Wellington (Fire District) (55.2%), Miscouche (20.7%)—in the Summerside census agglomeration (CA)—and Tignish (18.3%).
- The municipalities with a population of more than 500 that had the highest number of people who spoke French were the capital, Charlottetown (4,970), Summerside (2,045) and Stratford (1,770). Stratford is part of the Charlottetown CA.
French as first official language spoken

Data table for Chart 2
| First official language spoken | 1991 | 1996 | 2001 | 2006 | 2011 | 2016 | 2021 |
|---|---|---|---|---|---|---|---|
| number | |||||||
| French only | 5,235 | 5,275 | 5,235 | 5,085 | 4,720 | 4,550 | 4,350 |
| French and English | 90 | 125 | 75 | 95 | 190 | 230 | 420 |
| Sources: Statistics Canada, Census of Population, 1991 to 2021. | |||||||
- In 2021, 4,350 Prince Edward Islanders had French as their only first official language spoken (2.9% of the population) and 420 residents had both French and English as their first official languages spoken (0.3%).
- From 1991 to 2001, the number of people with French as their only first official language spoken remained stable (5,235 people). Since then, there was a decline in the number of people with French as their only first official language spoken (-885). Moreover, the relative proportion of these people has decreased from 1991 to 2021 (from 4.1% to 2.9%).
- The number of people with French and English as their first official languages spoken remained stable from 1991 to 2001 (from 90 to 75 people), but has risen over the past 20 years (from 75 to 420 people).
French as a mother tongue
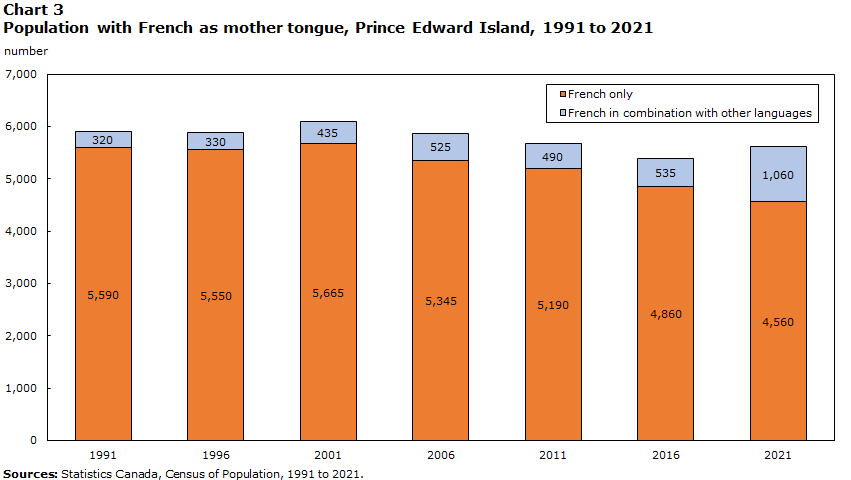
Data table for Chart 3
| Mother tongue | 1991 | 1996 | 2001 | 2006 | 2011 | 2016 | 2021 |
|---|---|---|---|---|---|---|---|
| number | |||||||
| French only | 5,590 | 5,550 | 5,665 | 5,345 | 5,190 | 4,860 | 4,560 |
| French in combination with other languages | 320 | 330 | 435 | 525 | 490 | 535 | 1,060 |
| Sources: Statistics Canada, Census of Population, 1991 to 2021. | |||||||
- In 2021, 5,620 Prince Edward Islanders had French as one of their mother tongues (3.7% of the population), up from 2016 (+220). However, this is lower than in 1991 (-290).
- In 2021, 81.1% of these residents (4,560 people) had French as their only mother tongue, while 18.9% (1,060 people) had it along with other languages (mainly English).
- Among people who were married or in a common-law relationship and had French as one of their mother tongues, more than a third (35.0%) were in a relationship with another person whose mother tongue is French.
French spoken at home

Data table for Chart 4
| Language spoken most often at home | 1991 | 1996 | 2001 | 2006 | 2011 | 2016 | 2021 |
|---|---|---|---|---|---|---|---|
| number | |||||||
| French predominantly | 2,935 | 2,910 | 2,710 | 2,680 | 2,465 | 2,260 | 2,080 |
| French equally with other languages | 225 | 265 | 215 | 150 | 305 | 370 | 500 |
| Sources: Statistics Canada, Census of Population, 1991 to 2021. | |||||||
- In 2021, 4,610 Prince Edward Islanders spoke French at least regularly at home (3.0% of the population).
- Of these, the majority (2,585 people, or 56.1%) spoke French most often at home, predominantly or equally with other languages. This number is down from 2016 (-45).
- In addition, 2,025 people (43.9%) spoke French regularly at home, in addition to their main language (usually English).
- Among people with French as their mother tongue, alone or with other languages:
- 54.3% spoke it at least regularly at home in 2021 (3,050 people). However, this rate varied by age, ranging from 78.5% among those under age 15 to 46.5% among those aged 45 and over.
- 41.0% spoke French most often at home, predominantly or equally with other languages (2,305 people), down from 1991 (3,060 people, or 51.8%).
- Among those whose mother tongue is not French, 1,555 (1.1%) spoke French regularly at home.
- The vast majority (1,280 people, or 82.3%) spoke French at home as a secondary language and spoke another language more often (usually English).
French used at work
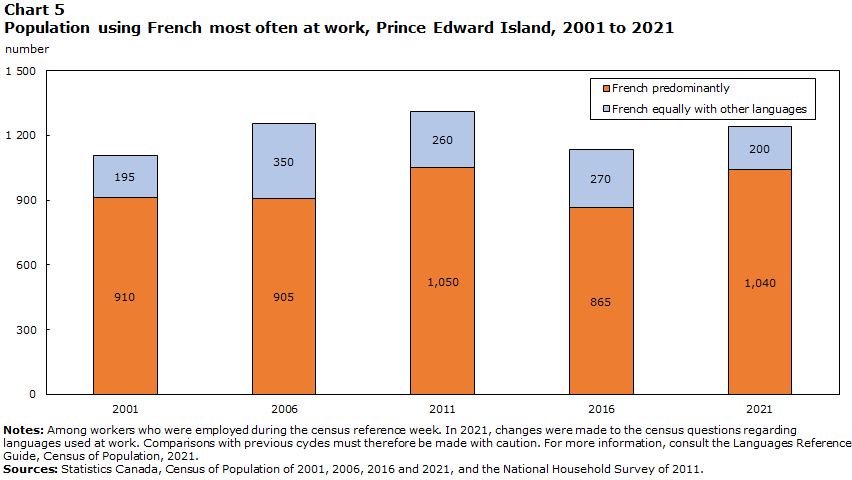
Data table for Chart 5
| Language used most often at work | 2001 | 2006 | 2011 | 2016 | 2021 |
|---|---|---|---|---|---|
| number | |||||
| French predominantly | 910 | 905 | 1,050 | 865 | 1,040 |
| French equally with other languages | 195 | 350 | 260 | 270 | 200 |
|
Notes: Among workers who were employed during the census reference week. In 2021, changes were made to the census questions regarding languages used at work. Comparisons with previous cycles must therefore be made with caution. For more information, consult the Languages Reference Guide, Census of Population, 2021. Sources: Statistics Canada, Census of Population, 2001, 2006, 2016 and 2021, and the National Household Survey of 2011. |
|||||
- In 2021, 2,715 Prince Edward Islanders used French at least regularly at work. This represents 3.6% of the province’s workers.Note
- In Prince Edward Island, 1,240 people used French most often at work, predominantly or equally with other languages, accounting for 1.7% of the province’s workers.
- The number of people who used French most often at work increased steadily from 1,105 in 2001 to 1,310 in 2011, then turned downward from 2011 to 2016 (-175), before increasing again from 2016 to 2021 (+105).
- In 2021, among workers who used French at least regularly at work, most worked in the public administration (820 people, or 30.2%), in educational services (690 people, or 25.4%) or in health care and social assistance (180 people, or 6.6%).Note
- Among those who spoke French most often at home, predominantly or equally with other languages, 65.2% used French regularly at work.
- The majority or workers who used French regularly at work (52.3% or 1,420 people) lived in the Charlottetown CA, while 12.0% (325 people) lived in the Summerside CA.
Instruction in French in primary and secondary schools
- In 2021, 2,870 (9.8%) of the 29,305 children under 18 living in the province were eligibleNote for instruction in French.
- Nearly half (1,300 children) lived in the Charlottetown CA.
- In Prince Edward Island, 6,135 people attended or had already attended a regular French program in a French-language school in Canada, representing 4.3% of the population aged 5 and older.
- Of those who had never attended a French-language school, 15,585 (10.9%) had attended a French immersion program in an English-language school.
- Among school-aged childrenNote who were eligible for instruction in French, 1,435 (64.3%) were attending or had already attended a French-language school.
French among immigrants
- In 2021, the proportions of recentNote immigrants and establishedNote immigrants living in Prince Edward Island who could conduct a conversation in French (5.1% and 10.1%, respectively) were lower than the proportion among the non-immigrant population (13.7%).
- The proportions of recent immigrants and established immigrants who spoke French at least regularly at home (2.6% and 3.2%, respectively) were similar to the proportion among the non-immigrant population (3.2%).
- The proportion of recent immigrants and established immigrants who had French as their only first official language spoken (1.7% and 2.2%, respectively) was lower than the proportion among the non-immigrant population (2.9%). However, the proportions of recent and established immigrants whose first official languages spoken were both French and English (1.6% and 1.2%, respectively) were higher than the proportion among the non‑immigrant population (0.1%).
- In 2021, about three-quarters (74.5%) of immigrants whose only first official language spoken is French were living in the Charlottetown CA.
Mobility and birthplace of the French-speaking population

Data table for Chart 6
| Place of birth | Percent |
|---|---|
| Prince Edward Island | 56.6 |
| Quebec | 13.8 |
| New Brunswick | 10.9 |
| Ontario | 6.1 |
| Elsewhere in Canada | 3.7 |
| Outside Canada | 8.8 |
| Source: Statistics Canada, Census of Population, 2021. | |
- In 2021, among Prince Edward Islanders whose only first official language spoken is French, more than half (56.6% or 2,420 people) were born in the province.
- More than one-third (34.5% or 1,475 people) were born in another province or territory, with the majority coming from Quebec (13.8%, or 590 people), New Brunswick (10.9%, or 465 people) or Ontario (6.1%, or 260 people).
- Just under 1 in 11 (8.8%, or 375 people) were born abroad, specifically in metropolitan France (2.9%) or in Africa (3.0%).
- From 2016 to 2021, the net interprovincial migration of the Prince Edward Island population whose only first official language spoken is French was positive (+45).
- While 470 people with French as their first official language spoken settled in Prince Edward Island from another province or territory from 2016 to 2021, 425 people left the province during the same period.
Appendix
| Indicator | 1991 | 1996 | 2001 | 2006 | 2011 | 2016 | 2021 |
|---|---|---|---|---|---|---|---|
| percent | |||||||
| French as first official language spokenTable 1 Note 1 | 4.1 | 4.0 | 4.0 | 3.8 | 3.5 | 3.3 | 3.1 |
| French only | 4.1 | 3.9 | 3.9 | 3.8 | 3.3 | 3.1 | 2.9 |
| French and English | 0.1 | 0.1 | 0.1 | 0.1 | 0.1 | 0.2 | 0.3 |
| Knowledge of FrenchTable 1 Note 2 | 10.3 | 11.1 | 12.1 | 12.8 | 12.4 | 12.7 | 12.8 |
| French only | 0.2 | 0.1 | 0.1 | 0.0 | 0.1 | 0.1 | 0.1 |
| French and English | 10.1 | 11.0 | 12.0 | 12.7 | 12.3 | 12.6 | 12.7 |
| French as mother tongue | 4.6 | 4.4 | 4.6 | 4.4 | 4.1 | 3.8 | 3.7 |
| French only | 4.4 | 4.2 | 4.2 | 4.0 | 3.7 | 3.4 | 3.0 |
| French in combination with other languages | 0.2 | 0.2 | 0.3 | 0.4 | 0.4 | 0.4 | 0.7 |
| French spoken most often at home | 2.5 | 2.4 | 2.2 | 2.1 | 2.0 | 1.9 | 1.7 |
| French predominantly | 2.3 | 2.2 | 2.0 | 2.0 | 1.8 | 1.6 | 1.4 |
| French equally with other languages | 0.1 | 0.2 | 0.2 | 0.1 | 0.2 | 0.3 | 0.3 |
| French used most often at workTable 1 Note 3 | Note ..: not available for a specific reference period | Note ..: not available for a specific reference period | 1.7 | 1.9 | 1.9 | 1.5 | 1.7 |
| French predominantly | Note ..: not available for a specific reference period | Note ..: not available for a specific reference period | 1.4 | 1.4 | 1.5 | 1.3 | 1.4 |
| French equally with other languages | Note ..: not available for a specific reference period | Note ..: not available for a specific reference period | 0.3 | 0.5 | 0.4 | 0.4 | 0.3 |
.. not available for a specific reference period
|
|||||||
| Frequency | French used at workTable 2 Note 1 | French spoken at home | ||
|---|---|---|---|---|
| number | percent | number | percent | |
| Total population | 74,870 | 100.0 | 152,455 | 100.0 |
| Only | 610 | 0.8 | 1,615 | 1.1 |
| Mostly | 430 | 0.6 | 465 | 0.3 |
| Equally | 205 | 0.3 | 500 | 0.3 |
| Regularly | 1,470 | 2.0 | 2,025 | 1.3 |
| No mention | 72,155 | 96.4 | 147,850 | 97.0 |
|
||||
| Selection of industry sectors | Use of French at work | |||
|---|---|---|---|---|
| At least regularlyTable 3 Note 2 | Most often | |||
| number | percent | number | percent | |
| Total | 2,715 | 100.0 | 1,240 | 100.0 |
| Agriculture, forestry, fishing and hunting | 0 | 0.0 | 55 | 4.4 |
| Construction | 95 | 3.5 | 40 | 3.2 |
| Manufacturing | 55 | 2.0 | 20 | 1.6 |
| Retail trade | 145 | 5.3 | 35 | 2.8 |
| Transportation and warehousing | 45 | 1.7 | 0 | 0.0 |
| Professional, scientific and technical services | 135 | 5.0 | 65 | 5.4 |
| Educational services | 690 | 25.4 | 540 | 43.5 |
| Health care and social assistance | 180 | 6.6 | 100 | 8.1 |
| Accommodation and food services | 95 | 3.5 | 15 | 1.2 |
| Public administration | 820 | 30.2 | 220 | 17.7 |
| Other sectors | 215 | 7.9 | 195 | 15.7 |
|
||||
| Age group | Mother tongue | |||||
|---|---|---|---|---|---|---|
| Total | FrenchTable 4 Note 1 | Other languages | ||||
| number | percent | number | percent | number | percent | |
| Total | 4,610 | 3.0 | 3,050 | 54.3 | 1,555 | 1.1 |
| 0 to 14 years | 1,065 | 4.5 | 510 | 78.5 | 550 | 2.4 |
| 15 to 44 years | 1,680 | 3.0 | 990 | 60.9 | 690 | 1.3 |
| 45 years and older | 1,860 | 2.5 | 1,555 | 46.5 | 315 | 0.4 |
|
||||||
| Immigration status and period of immigration | Knowledge of FrenchTable 5 Note 1 | French spoken at homeTable 5 Note 1 | First official language spoken | |||||
|---|---|---|---|---|---|---|---|---|
| French only | French and English | |||||||
| number | percent | number | percent | number | percent | number | percent | |
| Total | 19,185 | 13.2 | 4,565 | 3.1 | 4,275 | 2.8 | 375 | 0.2 |
| Non-immigrants | 18,235 | 13.7 | 4,220 | 3.2 | 3,915 | 2.9 | 165 | 0.1 |
| Immigrants | 955 | 8.1 | 345 | 2.9 | 235 | 2.0 | 155 | 1.3 |
| Recent immigrantsTable 5 Note 2 | 250 | 5.1 | 125 | 2.6 | 85 | 1.7 | 80 | 1.6 |
| Established immigrantsTable 5 Note 3 | 700 | 10.1 | 220 | 3.2 | 155 | 2.2 | 85 | 1.2 |
| 2011 to 2015 | 90 | 5.6 | 25 | 1.5 | 20 | 1.2 | 25 | 1.5 |
| 2001 to 2010 | 235 | 13.9 | 115 | 6.8 | 55 | 3.3 | 35 | 2.1 |
| 1991 to 2000 | 60 | 8.5 | 15 | 2.1 | 15 | 2.1 | 0 | 0.0 |
| 1980 to 1990 | 75 | 10.3 | 10 | 1.4 | 0 | 0.0 | 10 | 1.4 |
| Before 1980 | 230 | 10.6 | 60 | 2.8 | 60 | 2.8 | 10 | 0.5 |
| Non-permanent residents | 255 | 4.7 | 140 | 2.6 | 120 | 2.2 | 45 | 0.8 |
|
||||||||
- Date modified: