
Ethnicity, Language and Immigration Thematic Series
Key facts on the French language in Newfoundland and Labrador in 2021
Skip to text
Text begins
This fact sheet gives an overview of the situation of French in Newfoundland and Labrador in 2021. First, it provides information on the changes in the number and proportion of people in the population who can conduct a conversation in French, whose first official language spoken is French, whose mother tongue is French, who speak French at home or use French at work. Next, it presents information on French-language instruction in elementary and secondary schools, on French spoken among recent and established immigrants, as well as on the mobility and place of birth of individuals whose first official language spoken is French. Additional data on these topics can be found in the appendix.
The information presented in this fact sheet comes from the Census of Population. To learn more about census concepts and the historical comparability of data, please refer to the 2021 Census of Population Languages Reference Guide and the Instruction in the Minority Official Language Reference Guide.
Highlights
- In 2021, 26,080 residents of Newfoundland and Labrador could conduct a conversation in French. This number has remained stable compared to 2016 (+15), but is higher than in 1991 (+7,335). The relative proportion of these residents also rose, from 3.3% in 1991 to 5.2% in 2021, reaching an all-time high.
- In 2021, 3,695 people (0.7% of the population) spoke French at least regularly at home. Among those with French as one of their mother tongues, just under half (45.9%) spoke French regularly at home.
- In 2021, 2,680 workers living in the province (1.3%) used French at least regularly at work. Most of them worked in educational services (39.2%) or public administration (17.5%).
- Almost 1 in 11 immigrants (8.8%) could have a conversation in French in 2021. This proportion was higher among immigrants admitted before 2016 (9.8%) than among those admitted between 2016 and 2021 (6.7%).
- In 2021, fewer than 1 in 5 (19.6%) Newfoundland and Labrador residents who had French as their only first official language spoken were born in that province.
Ability to conduct a conversation in French

Data table for Chart 1
| Knowledge of official languages | 1991 | 1996 | 2001 | 2006 | 2011 | 2016 | 2021 |
|---|---|---|---|---|---|---|---|
| number | |||||||
| French and English | 18,495 | 21,260 | 20,890 | 23,680 | 23,450 | 25,945 | 25,950 |
| French only | 240 | 155 | 140 | 90 | 135 | 115 | 125 |
| Sources: Statistics Canada, Census of Population, 1991 to 2021. | |||||||
- In 2021, 26,080 residents of Newfoundland and Labrador were able to conduct a conversation in French. Almost all (99.5%, or 25,950 people) could also have a conversation in English.
- The number of people in the province who can have a conversation in French has been rising since 1991 (+7,335). It remained stable from 2016 to 2021 (+15).
- The proportion of the population that can conduct a conversation in French has increased over the past 30 years, rising from 3.3% in 1991 to 5.2% in 2021, the highest ever recorded in a census.
- This growth is mainly driven by the increase in bilingualism among those who learned English first in their childhood: while 15,610 people (2.8%) could have a conversation in French in 1991, that number rose to 22,455 (4.6%) in 2021.

Description for Map 1
This map shows the proportion of the population able to conduct a conversation in French in each census subdivision in Newfoundland and Labrador in 2021.
In this map we use 6 distinct colours to signify different values. A solid grey colour is used to represent areas for which no data are available. There are 16 census subdivisions in this group.
A solid teal colour is used to represent areas in which less than 1.5% of the population is able to conduct a conversation in French. There are 212 census subdivisions in this group.
A solid light green colour is used to represent areas in which 1.5% to less than 5% of the population is able to conduct a conversation in French. There are 109 census subdivisions in this group.
A solid yellow colour is used to represent areas in which 5% to less than 10% of the population is able to conduct a conversation in French. There are 28 census subdivisions in this group.
A solid orange colour is used to represent areas in which 10% to less than 20% of the population is able to conduct a conversation in French. There are 6 census subdivisions in this group.
A solid red colour is used to represent areas in which 20% or more of the population is able to conduct a conversation in French. There is 1 census subdivision in this group.
The borders of the census metropolitan area of St. John’s are identified by a bold black line.
The borders of each census subdivision are delineated by a grey line and each census subdivision is assigned a colour based on the table below.
The data is available in CSV format
- In 2021, in 321 of Newfoundland and Labrador’s 356 municipalities,Note 1 less than 5% of the population could conduct a conversation in French.
- The municipalities with a population of more than 500 that had the highest proportion of people who can conduct a conversation in French were Cape St. George (27.7%), Division No. 4, Subdivision E (14.6%)—which includes, for example, the communities of Piccadilly, Ship Cove, Abrahams Cove and Campbells Creek—as well as Wabush (13.0%) in Labrador.
- The municipalities with a population of more than 500 that had the highest number of people who spoke French were St. John’s (9,960), Conception Bay South (1,840) and Paradise (1,815). These three municipalities are located in the St. John’s census metropolitan area (CMA).
French as first official language spoken

Data table for Chart 2
| First official language spoken | 1991 | 1996 | 2001 | 2006 | 2011 | 2016 | 2021 |
|---|---|---|---|---|---|---|---|
| number | |||||||
| French only | 2,630 | 2,180 | 2,055 | 1,835 | 1,995 | 2,255 | 2,110 |
| French and English | 95 | 180 | 95 | 200 | 205 | 350 | 350 |
| Sources: Statistics Canada, Census of Population, 1991 to 2021. | |||||||
- In 2021, 2,110 Newfoundland and Labrador residents (0.4% of the population) had French as their only first official language spoken and 350 residents (0.1% of the population) had both French and English as their first official languages spoken.
- From 1991 to 2006, there was a decline in the number of persons with French as their only first official language spoken (-795) and a decrease in their relative proportion (from 0.5% to 0.3%).
- This population then increased from 2006 to 2016 (+420) before falling from 2016 to 2021 (-145).
- From 1991 to 2021, the number of people who had French and English as their first official languages spoken rose from 95 to 350, an increase of 255 people.
French as a mother tongue
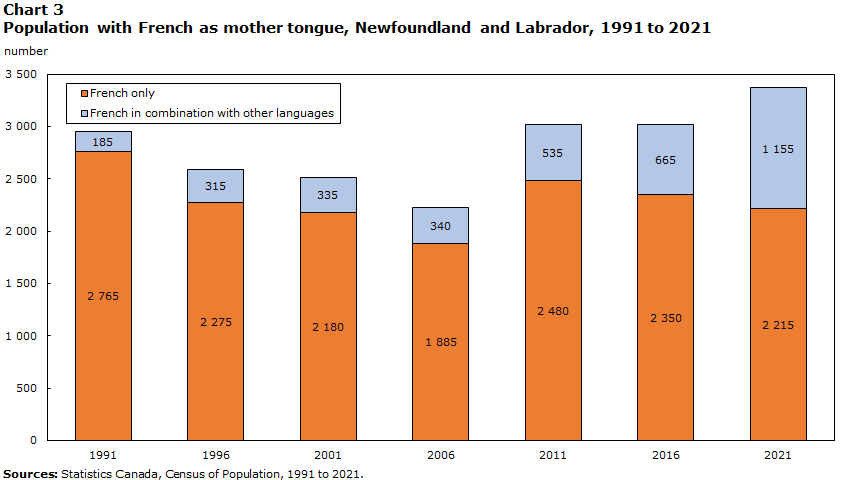
Data table for Chart 3
| Mother tongue | 1991 | 1996 | 2001 | 2006 | 2011 | 2016 | 2021 |
|---|---|---|---|---|---|---|---|
| number | |||||||
| French only | 2,765 | 2,275 | 2,180 | 1,885 | 2,480 | 2,350 | 2,215 |
| French in combination with other languages | 185 | 315 | 335 | 340 | 535 | 665 | 1,155 |
| Sources: Statistics Canada, Census of Population, 1991 to 2021. | |||||||
- In 2021, 3,360 Newfoundland and Labrador residents (0.7% of the population) had French as one of their mother tongues, up 340 from 2016 and 395 from 1991.
- In 2021, 65.8% of these residents (2,215 people) had French as their only mother tongue, while 34.2% (1,155 people) had French along with other languages (mainly English).
- Among people who were married or in a common-law relationship and had French as one of their mother tongues in 2021, fewer than one in five (18.5%) were in a relationship with another person whose mother tongue is French.
French spoken at home

Data table for Chart 4
| Language spoken most often at home | 1991 | 1996 | 2001 | 2006 | 2011 | 2016 | 2021 |
|---|---|---|---|---|---|---|---|
| number | |||||||
| French predominantly | 1,235 | 875 | 895 | 650 | 1,145 | 935 | 880 |
| French equally with other languages | 225 | 280 | 205 | 180 | 295 | 480 | 405 |
| Sources: Statistics Canada, Census of Population, 1991 to 2021. | |||||||
- In 2021, 3,695 Newfoundland and Labrador residents (0.7% of the population) spoke French at least regularly at home.
- Of these, 1,285 people (34.8%) spoke French most often at home, predominantly or equally with other languages, down from 2016 (-130).Note 2
- The majority of these people (2,410, or 65.2%) spoke French regularly at home, in addition to their main language (generally English).
- Among people with French as their mother tongue, alone or with other languages:
- In total, 45.9% (1,545 people) spoke French at least regularly at home in 2021. However, this rate varied by age, ranging from 68.8% among those under age 15 to 35.9% among those aged 45 and older.
- In total, 28.6% (960 people) spoke French most often at home, alone or equally with other languages, down from 1991 (1,295 people, or 43.5%).
- Among those whose mother tongue is not French, 2,150 (0.4%) spoke French on a regular basis at home.
- Most of them (1,825 people, or 84.9%) spoke French at home as a secondary language and spoke another language more often (generally English).
French used at work

Data table for Chart 5
| Language used most often at work | 2001 | 2006 | 2011 | 2016 | 2021 |
|---|---|---|---|---|---|
| number | |||||
| French predominantly | 535 | 645 | 825 | 780 | 835 |
| French equally with other languages | 150 | 215 | 255 | 365 | 235 |
|
Notes: Among workers who were employed during the census reference week. In 2021, changes were made to the census questions regarding languages used at work. Comparisons with previous cycles must therefore be made with caution. For more information, consult the Languages Reference Guide, Census of Population, 2021. Sources: Statistics Canada, Census of Population, 2001, 2006, 2016 and 2021, and the National Household Survey of 2011. |
|||||
- In 2021, 2,680 Newfoundland and Labrador residents used French at least regularly at work. This represents 1.3% of the province’s workers.Note 3
- In Newfoundland and Labrador, 1,070 people used French most often at work, predominantly or equally with other languages, accounting for 0.5% of the province’s workers.
- The number of people who used French most often at work increased steadily from 685 in 2001 to 1,145 in 2016. However, it fell in the last intercensal period (-75).
- In 2021, among workers who used French at least regularly at work, most worked in educational services (1,050 people, or 39.2%), in public administration (470 people, or 17.5%), or in health care and social assistance (165 people, or 6.2%).Note 4
- Among those who spoke French most often at home, predominantly or equally with other languages, 46.5% also used French regularly at work.
- More than 6 in 10 workers (62.7%) who used French regularly at work lived in the St. John’s CMA.
Instruction in French in primary and secondary schools
- In 2021, 2,955 (3.5%) of the 85,260 children under 18 living in the province were eligibleNote 5 for instruction in French.
- About half (1,485 children) of them lived in the St. John’s CMA.
- In Newfoundland and Labrador, 5,660 people attended or had already attended a regular French program in a French-language school in Canada, representing 1.2% of the population aged 5 and older.
- Of those who had never attended a French-language school, 30,520 (6.3%) had attended a French immersion program in an English-language school.
- Among school-aged childrenNote 6 who were eligible for instruction in French, 1,200 (54.2%) were attending or had already attended a French-language school.
French among immigrants
- In 2021, the proportions of recentNote 7 immigrants and establishedNote 8 immigrants living in Newfoundland and Labrador who could conduct a conversation in French (6.7% and 9.8%, respectively) were higher than the proportion among the non-immigrant population (5.1%).
- The proportions of recent immigrants and established immigrants who spoke French at least regularly at home (3.4% and 3.3%, respectively) were also higher than for the non-immigrant population (0.7%).
- The proportions of recent immigrants and established immigrants who had French as their only first official language spoken (2.7% and 2.3%, respectively) or French and English as their first official languages spoken (1.4% and 1.1%, respectively) were higher than for the non-immigrant population (0.3% and 0.1%).
- In 2021, nearly three-quarters (73.5%) of immigrants whose only first official language spoken was French were living in the St. John’s CMA.
Mobility and birthplace of the French-speaking population

Data table for Chart 6
| Place of birth | Percent |
|---|---|
| Newfoundland and Labrador | 19.6 |
| Quebec | 36.8 |
| New Brunswick | 8.4 |
| Ontario | 6.9 |
| Elsewhere in Canada | 5.3 |
| Outside Canada | 23.0 |
| Sources: Statistics Canada, Census of Population, 2021. | |
- In 2021, among Newfoundland and Labrador residents whose only first official language spoken is French, fewer than 1 in 5 (19.6%, or 415 people) were born in the province.
- More than half (57.4%, or 1,200 people) were born in another province or territory, with the majority coming from Quebec (36.8%, or 770 people), New Brunswick (8.4%, or 175 people) or Ontario (6.9%, or 145 people).
- Just under a quarter (23.0%, or 480 people) were born abroad, specifically in metropolitan France (8.6%) or Africa (10.3%).
- From 2016 to 2021, the net interprovincial migration of the Newfoundland and Labrador population whose only first official language spoken is French was negative (-120).
- While 375 people with French as their only first official language spoken settled in Newfoundland and Labrador from another province or territory from 2016 to 2021, 495 people left the province during the same period.
Appendix
| Indicator | 1991 | 1996 | 2001 | 2006 | 2011 | 2016 | 2021 |
|---|---|---|---|---|---|---|---|
| percent | |||||||
| French as first official language spokenTable 1 Note 1 | 0.5 | 0.4 | 0.4 | 0.4 | 0.4 | 0.5 | 0.5 |
| French only | 0.5 | 0.4 | 0.4 | 0.3 | 0.4 | 0.4 | 0.4 |
| French and English | 0.0 | 0.0 | 0.0 | 0.0 | 0.0 | 0.1 | 0.1 |
| Knowledge of FrenchTable 1 Note 2 | 3.3 | 3.9 | 4.1 | 4.7 | 4.6 | 5.1 | 5.2 |
| French only | 0.0 | 0.0 | 0.0 | 0.0 | 0.0 | 0.0 | 0.0 |
| French and English | 3.3 | 3.9 | 4.1 | 4.7 | 4.6 | 5.0 | 5.1 |
| French as mother tongue | 0.5 | 0.5 | 0.5 | 0.4 | 0.6 | 0.6 | 0.7 |
| French only | 0.5 | 0.4 | 0.4 | 0.4 | 0.5 | 0.5 | 0.4 |
| French in combination with other languages | 0.0 | 0.1 | 0.1 | 0.1 | 0.1 | 0.1 | 0.2 |
| French spoken most often at home | 0.3 | 0.2 | 0.2 | 0.2 | 0.3 | 0.3 | 0.3 |
| French predominantly | 0.2 | 0.2 | 0.2 | 0.1 | 0.2 | 0.2 | 0.2 |
| French equally with other languages | 0.1 | 0.1 | 0.0 | 0.0 | 0.1 | 0.1 | 0.1 |
| French used most often at workTable 1 Note 3 | Note ..: not available for a specific reference period | Note ..: not available for a specific reference period | 0.4 | 0.4 | 0.5 | 0.5 | 0.5 |
| French predominantly | Note ..: not available for a specific reference period | Note ..: not available for a specific reference period | 0.3 | 0.3 | 0.4 | 0.4 | 0.4 |
| French equally with other languages | Note ..: not available for a specific reference period | Note ..: not available for a specific reference period | 0.1 | 0.1 | 0.1 | 0.2 | 0.1 |
.. not available for a specific reference period
|
|||||||
| Frequency | French used at workTable 2 Note 1 | French spoken at home | ||
|---|---|---|---|---|
| number | percent | number | percent | |
| Total population | 206,280 | 100.0 | 504,805 | 100.0 |
| Only | 375 | 0.2 | 580 | 0.1 |
| Mostly | 460 | 0.2 | 295 | 0.1 |
| Equally | 235 | 0.1 | 405 | 0.1 |
| Regularly | 1,605 | 0.8 | 2,405 | 0.5 |
| No mention | 203,610 | 98.7 | 501,110 | 99.3 |
|
||||
| Selection of industry sectors | Use of French at work | |||
|---|---|---|---|---|
| At least regularlyTable 3 Note 2 | Most often | |||
| number | percent | number | percent | |
| Total | 2,680 | 100.0 | 1,070 | 100.0 |
| Mining, quarrying, and oil and gas extraction | 55 | 2.1 | 25 | 2.3 |
| Construction | 25 | 0.9 | 0 | 0.0 |
| Manufacturing | 45 | 1.7 | 25 | 2.3 |
| Retail trade | 135 | 5.0 | 20 | 1.9 |
| Transportation and warehousing | 145 | 5.4 | 40 | 3.7 |
| Professional, scientific and technical services | 85 | 3.2 | 35 | 3.3 |
| Educational services | 1,050 | 39.2 | 650 | 60.7 |
| Health care and social assistance | 165 | 6.2 | 10 | 0.9 |
| Accommodation and food services | 55 | 2.1 | 0 | 0.0 |
| Public administration | 470 | 17.5 | 130 | 12.1 |
| Other sectors | 365 | 13.6 | 110 | 10.3 |
|
||||
| Age group | Mother tongue | |||||
|---|---|---|---|---|---|---|
| Total | FrenchTable 4 Note 1 | Other languages | ||||
| number | percent | number | percent | number | percent | |
| Total | 3,695 | 0.7 | 1,545 | 45.9 | 2,150 | 0.4 |
| 0 to 14 years | 965 | 1.4 | 330 | 68.8 | 630 | 0.9 |
| 15 to 44 years | 1,710 | 1.0 | 680 | 48.9 | 1,030 | 0.6 |
| 45 years and older | 1,020 | 0.4 | 535 | 35.9 | 485 | 0.2 |
|
||||||
| Immigration status and period of immigration | Knowledge of FrenchTable 5 Note 1 | French spoken at homeTable 5 Note 1 | First official language spoken | |||||
|---|---|---|---|---|---|---|---|---|
| French only | French and English | |||||||
| number | percent | number | percent | number | percent | number | percent | |
| Total | 25,865 | 5.2 | 3,690 | 0.7 | 2,090 | 0.4 | 330 | 0.1 |
| Non-immigrants | 24,605 | 5.1 | 3,220 | 0.7 | 1,655 | 0.3 | 120 | 0.0 |
| Immigrants | 1,260 | 8.8 | 465 | 3.3 | 335 | 2.4 | 170 | 1.2 |
| Recent immigrantsTable 5 Note 2 | 285 | 6.7 | 145 | 3.4 | 115 | 2.7 | 60 | 1.4 |
| Established immigrantsTable 5 Note 3 | 975 | 9.8 | 325 | 3.3 | 225 | 2.3 | 110 | 1.1 |
| 2011 to 2015 | 240 | 10.4 | 125 | 5.4 | 60 | 2.6 | 70 | 3.0 |
| 2001 to 2010 | 205 | 8.4 | 65 | 2.7 | 55 | 2.3 | 20 | 0.8 |
| 1991 to 2000 | 85 | 8.3 | 40 | 3.9 | 25 | 2.5 | 15 | 1.5 |
| 1980 to 1990 | 85 | 9.6 | 20 | 2.2 | 20 | 2.2 | 0 | 0.0 |
| Before 1980 | 365 | 10.9 | 70 | 2.1 | 60 | 1.8 | 0 | 0.0 |
| Non-permanent residents | 260 | 5.0 | 125 | 2.4 | 95 | 1.8 | 40 | 0.8 |
|
||||||||
- Date modified: