
Ethnicity, Language and Immigration Thematic Series
Knowledge and use of the official minority language at work by healthcare workers, 2001 to 2016

Archived Content
Information identified as archived is provided for reference, research or recordkeeping purposes. It is not subject to the Government of Canada Web Standards and has not been altered or updated since it was archived. Please "contact us" to request a format other than those available.
Skip to text
Text begins
Introduction
The goal of this document is to provide a socio-demographic overview of healthcare workers who can speak or use the minority official language of their region.
The booklet is structured in three parts. The first part presents key indicators for healthcare workers who can speak or use French in Canada outside Quebec whereas the second part focuses on healthcare workers who can speak or use English in Quebec. Indicators include current and historical rates of knowledge, use and frequency of minority language use at work as well as workers’ geographic distribution across metropolitan areas. Indicators that impact the growth of the healthcare worker population are also presented, including: aging, immigration and interprovincial mobility, geographic retention, in-field retention and time-to-employment of healthcare workers and graduates. The third part provides selected key indicators for provinces and territories.
In this booklet, the official minority language refers to English in Quebec and French in all provinces and territories outside Quebec (i.e. ‘Canada outside Quebec’ or ‘outside Quebec’). Additionally, since at the national level French is considered the official minority language, some data is also provided on healthcare workers who know or use French at work in Quebec. Please note that, unless noted, data is presented on the basis of a person’s place of work and not their place of residence.
Produced in collaboration with Health Canada, this booklet represents one part of a larger release on knowledge and use of the official minority language among healthcare workers. The release includes the present booklet, five historical tables and two infographics listed below. All products are based on data from the Census of Population (2001, 2006 and 2016), National Household Survey (2011) and in some cases the Education and Labour Market Longitudinal Platform (ELMLP).
Other products in this release:
- (Infographic) French among healthcare workers in Canada outside Quebec, 2001 to 2016
- (Infographic) English and French among healthcare workers in Quebec, 2001 to 2016
- (Data Table) Official minority language (first official language spoken) by selected healthcare occupations, 2001 to 2016
- (Data Table) Knowledge of the official minority language by selected healthcare occupations, 2001 to 2016
- (Data Table) Frequency of French use at work by selected healthcare occupations, Canada outside Quebec, 2001 to 2016
- (Data Table) Frequency of English use at work by selected healthcare occupations, Quebec, 2001 to 2016
- (Data Table) Frequency of French use at work by selected healthcare occupations, Quebec, 2001 to 2016
Executive summary of trends
- The number of healthcare workers who can speak the minority language is increasing everywhere in Canada, with the vast majority of them being bilingual and female.
- However, the proportion of healthcare workers who can speak French decreased outside Quebec and the proportion of those who can speak English slightly increased in Quebec.
- Being able to speak the minority language, however, does not necessarily mean a healthcare worker can or will use that language at work. In fact, excluding those who know French in Moncton, Sudbury and Ottawa and English in Gatineau, Montreal and Sherbrooke, only a small proportion of healthcare workers who can speak the minority language actually report using it at work.
- In addition, healthcare workers who can speak the minority language and learned it at home in childhood are many times more likely to use it at work than those who did not learn it at home in childhood.
- Ultimately, although the number of healthcare workers who can speak the minority language has increased in Canada, the proportion of those using it at work has remained stable outside Quebec while slightly increasing in Quebec.
- As for the healthcare workers that do make use of the minority language at work only a small proportion use it as their primary language. In fact, with the exception of New Brunswick, most use it equally often with the majority language or as a secondary language in addition to the majority language. This type of dual use of English and French at work is increasing across Canada.
- In terms of their geographic distribution, most minority language healthcare workers are concentrated in four cities: Ottawa and Toronto for those who can speak French as well as Montréal and Québec for those who can speak English.
- In spite of this, when the size of overall minority language population in these cities is taken into account, there are proportionately fewer healthcare workers who can speak or use the minority language in these four metropolitan areas compared to others.
- Aging, immigration, interprovincial mobility, graduation from health programs of study, recruitment and retention of graduates in healthcare occupations all have varying degrees of impact on the growth of the healthcare worker population who can speak or use the minority language.
- In Canada outside Quebec, the number of healthcare workers aged 55 and older who could speak French more than doubled since 2001. At the same time, the proportion of those able to speak French is decreasing among both younger (15 to 29) and older (55 and older) healthcare workers.
- Even with declining rates of French knowledge outside Quebec, younger healthcare workers still know and use the minority language to a proportionally higher extent than older healthcare workers.
- In Quebec, healthcare workers who can speak English are aging just as rapidly. However, unlike outside Quebec, in Quebec young healthcare workers who can speak the minority language are, by contrast, increasing both in number and proportion.
- Outside Quebec, interprovincial migration is a much more important source of minority language healthcare workers than international migration. As a result, with a highly mobile labour force, provinces and territories outside Quebec tend to retain less than two thirds of the healthcare workers who can speak French and have been trained in the same province or territory. By contrast, Quebec retains more than four out of five healthcare workers who speak English and have been trained in the province.
- In Quebec, most minority healthcare workers that work in the province were trained in it. International migration, though proportionally small, is nevertheless the main external source of healthcare workers that speak English with interprovincial mobility accounting for proportionally half as many healthcare workers.
- In Canada, a significant number of health graduates who can speak the minority language are not employed in health occupations. Among those that are, outside Quebec, the longer since graduation the higher the likelihood of employment. In Quebec, 2 in 3 health graduates who can speak English are employed within three years of graduation.
Population of interest and concepts
In this booklet, “healthcare workers”, are defined as workers fifteen years of age and older who have an usual place of work and who were employed in selected health occupations at some point since January 1st in the year prior to the reference year (e.g. 2015).
Health occupations include broad occupation group “3-Health Occupations” from the National Occupational Classification (NOC) to which five additional occupations were added: Psychologists, Social workers, Social and community service workers, Instructors and teachers of persons with disabilities and Managers in health care. Please note that the occupation concept differs from that of industry or sector. In fact, healthcare workers may work outside the health sector (e.g. psychologists in the private sector).

Description for questionnaire
The image shows question 38 of the 2016 census of population. The question asks, “What was this person’s work or occupation?”. There are four boxes in which a person can write their response. The examples provided include: “General practitioner”, “fishing guide”, “civil engineer”, “secondary school teacher”. An additional note is included for those in the Armed Forces to provide their rank.
Where data on health graduates is presented, they are defined as persons less than 65 years of age who have completed post-secondary education in a health-related program of study. The program of study concept is defined according to the Classification of Instructional Programs (CIP2011) hierarchy.
Several language concepts are used in this booklet. The ‘knowledge of official languages’ concept, is sourced from question 7 in the Census of Population, and can variously be referred to as, ‘knowing’, ‘having knowledge of’ or ‘speaking’ a language.

Description for questionnaire
The image shows question 7 of the 2016 census of population and asks, “Can this person speak English or French well enough to conduct a conversation?”. The four options listed are: “English only”, “French only”, “Both English and French” or “Neither English nor French“. Only one option may be chosen.
The ‘use of languages at work’ concept, sourced from questions 45a and 45b, refers to the use of English or French at least regularly at work. It is important to note, however, that a person who can speak English or French may not necessarily be able to also use that language at work.
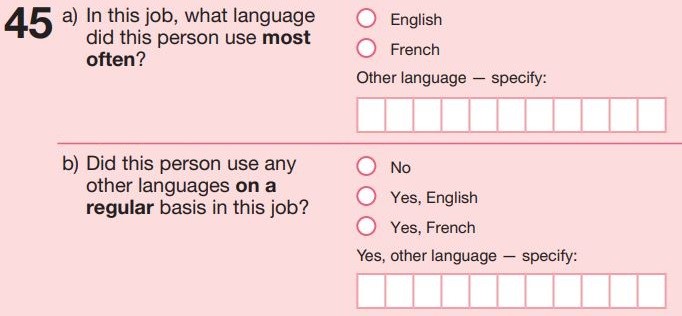
Description for questionnaire
The image shows question 45a and 45b of the 2016 census of population. The first question asks, “In this job, what language did this person use most often?”. There are three options with which to answer. Respondents can choose “English”, “French” or “Other language – please specify”. The second question asks, “Did this person use any other languages on a regular basis in this job?”. There are four options with which to answer. Respondents can choose “No”, “Yes, English”, “Yes, French” or “Yes, other language – please specify”.
Language use at work can be further characterized by its frequency. Taking English as the reference language, for example, when a worker uses English exclusively or most often alongside another secondary language regularly, that worker is said to make ‘primary use’ of English. ‘Equal use’ refers to when English and another language are used equally often with or without other secondary languages used on a regularly basis. Lastly, secondary use is defined by the regular use of English in addition to the language used most often.
Please note that given the inclusion of multiple responses, the populations that can speak or use French or English at work should not be added together to arrive at the total population.
Part I: Healthcare workers who can speak or use French at work, Canada outside Quebec, 2001 to 2016
Healthcare workers who can speak French increasing in number, decreasing in proportion

Data table for Chart 1
| 2001 | 2006 | 2011 | 2016 | |
|---|---|---|---|---|
| number | ||||
| English and French | 89,490 | 103,775 | 116,505 | 127,855 |
| French only | 1,910 | 3,385 | 3,120 | 2,970 |
| percent | ||||
| Total knowledge of French | 12.3 | 12.4 | 11.8 | 11.5 |
| Sources: Statistics Canada, Census of Population, 2001, 2006 and 2016; National Household Survey, 2011. | ||||
In 2016, 130,825 healthcare workers outside Quebec could speak French, compared to 91,400 in 2001, an increase of 43.1%. During the same period, the total population with French as first official language spokenNote 1 grew by 3.3% or +32,630 persons.
However, among all healthcare workers, the proportion of those who could speak French decreased from 12.3% in 2001 to 11.5% in 2016. Likewise, the total population with French as their first official language spoken decreased from 4.4% in 2001 to 3.8% in 2016.
In 2016, among healthcare workers who could speak French outside Quebec, 97.7% were English-French bilinguals.
Secondary use of French at work is most prevalent, equal use (with English) fastest growing
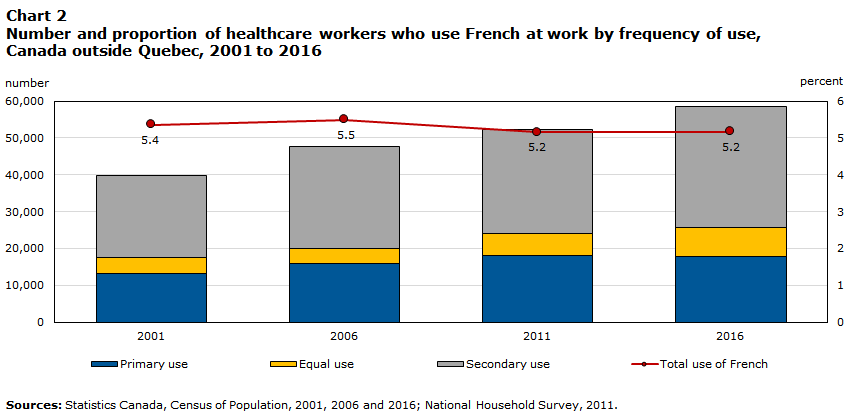
Data table for Chart 2
| 2001 | 2006 | 2011 | 2016 | |
|---|---|---|---|---|
| number | ||||
| Primary use | 13,065 | 15,800 | 18,105 | 17,900 |
| Equal use | 4,370 | 4,285 | 5,930 | 7,760 |
| Secondary use | 22,265 | 27,580 | 28,340 | 32,920 |
| percent | ||||
| Total use of French | 5.4 | 5.5 | 5.2 | 5.2 |
| Sources: Statistics Canada, Census of Population, 2001, 2006 and 2016; National Household Survey, 2011. | ||||
In 2016, 58,580 healthcare workers reported using French at work outside Quebec, representing 5.2% of all healthcare workers. Since 2001, their number has grown by 47.6% (+18,880 workers) whereas their proportion remained relatively stable.
Between 2001 and 2016, among healthcare workers, secondary use of French on a regular basis was the most prevalent. Nevertheless, the equal use of French with another language (mostly English) saw the highest growth with a 77.6% increase (+3,390 workers). By contrast, over the same period, primary use of French at work grew by 37% (+4,840 workers) and secondary use by 47.8% (+10,650 workers). This growth varied from region to region.
Among the 46,505 healthcare workers that can speak French and learnt it at home in childhood, 73.6% used it at work at least regularly. By contrast, among the 84,320 healthcare workers with a mother tongue other than French who can speak French, 20,000 or 23.7% used it at work. In other words, healthcare workers who can speak French and learnt it at home in childhood are roughly three times more likely to use French at work than those who did not learn it at home in childhood.
1 in 2 healthcare workers who know French work in Ontario: Ottawa and Toronto major hubs
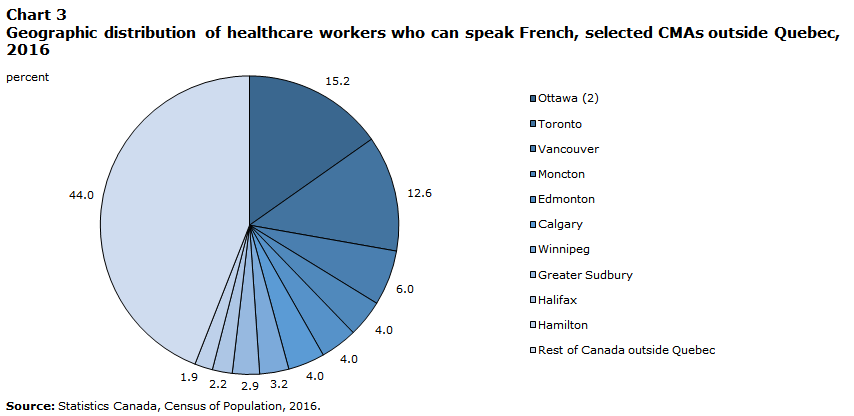
Data table for Chart 3
| Percent | |
|---|---|
| Ottawa (2) | 15.2 |
| Toronto | 12.6 |
| Vancouver | 6.0 |
| Moncton | 4.0 |
| Edmonton | 4.0 |
| Calgary | 4.0 |
| Winnipeg | 3.2 |
| Greater Sudbury | 2.9 |
| Halifax | 2.2 |
| Hamilton | 1.9 |
| Rest of Canada outside Quebec | 44.0 |
| Source: Statistics Canada, Census of Population, 2016. | |
The geographic distribution of healthcare workers who can speak French is closely related to the distribution of the total population with French as their first official language spoken.
In Canada outside Quebec, a little over half of all healthcare workers who know French worked in Ontario (51.6%), with the next three largest concentrations being found in New Brunswick (13.7%), British Columbia (11.5%) and Alberta (10.4%).
Ottawa and Toronto are host to the largest number of healthcare workers who know French. Together, they represented a little over 1 in 4 healthcare workers with knowledge of French outside Quebec in 2016.
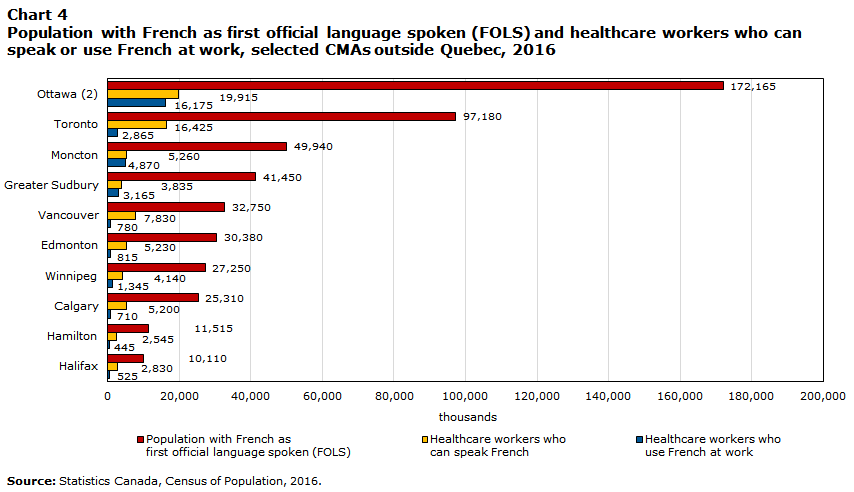
Data table for Chart 4
| Population with French as first official language spoken (FOLS) |
Healthcare workers who can speak French |
Healthcare workers who use French at work | |
|---|---|---|---|
| thousands | |||
| Ottawa (2) | 172,165 | 19,915 | 16,175 |
| Toronto | 97,180 | 16,425 | 2,865 |
| Moncton | 49,940 | 5,260 | 4,870 |
| Greater Sudbury | 41,450 | 3,835 | 3,165 |
| Vancouver | 32,750 | 7,830 | 780 |
| Edmonton | 30,380 | 5,230 | 815 |
| Winnipeg | 27,250 | 4,140 | 1,345 |
| Calgary | 25,310 | 5,200 | 710 |
| Hamilton | 11,515 | 2,545 | 445 |
| Halifax | 10,110 | 2,830 | 525 |
| Source: Statistics Canada, Census of Population, 2016. | |||
One way to look at access to healthcare in the minority language is to compare the number of healthcare workers who can speak French against the overall population who, as defined by the first official language spoken (FOLS), is most likely to ask for services in French.Note 1
In this regard, in absolute terms, the largest populations with French as their FOLS outside Quebec can be found in the census metropolitan areas (CMAs) of OttawaNote 2 (172,165), Toronto (97,180) and Moncton (49,940).
Similarly, the most numerous healthcare worker populations who can speak French are found in Ottawa (19,915), Toronto (16,425) and Vancouver (7,830).
Greater Sudbury and Moncton stand out as the metropolitan areas in which nearly as many healthcare workers use French at work as can speak it.
Moncton: Highest rates of French knowledge and use among healthcare workers

Data table for Chart 5
| Healthcare workers who can speak French | Healthcare workers who use French at work | |
|---|---|---|
| percent | ||
| Moncton | 64.3 | 59.5 |
| Ottawa (2) | 43.7 | 35.5 |
| Greater Sudbury | 41.9 | 34.6 |
| Halifax | 13.3 | 2.5 |
| Winnipeg | 9.9 | 3.2 |
| Calgary | 8.6 | 1.2 |
| Edmonton | 8.3 | 1.3 |
| Toronto | 7.9 | 1.4 |
| Vancouver | 7.9 | 0.8 |
| Hamilton | 7.3 | 1.3 |
| Source: Statistics Canada, Census of Population, 2016. | ||
In 2016, Moncton hosted the fourth largest population of healthcare workers who could speak French (5,260 workers) outside Quebec. These workers represented the only French majority healthcare worker population outside Quebec, both in terms of their knowledge (64.3%) and use of French at work (59.5%).
The next healthcare worker population with the highest rates of French knowledge and use resides in OttawaNote 2 where roughly 4 in 10 healthcare workers could speak it and 3 in 10 used it. They were followed by Greater Sudbury, where 4 in 10 healthcare workers could speak French and 3 in 10 used it at work at least regularly.
Moncton, Sudbury and Ottawa: Highest use of French among healthcare workers that speak it

Data table for Chart 6
| Total use | Primary use | Equal use | Secondary use | |
|---|---|---|---|---|
| percent | ||||
| Vancouver | 8.7 | 0.4 | 0.9 | 7.3 |
| Calgary | 12.0 | 0.8 | 1.3 | 10.1 |
| Edmonton | 14.0 | 1.1 | 1.1 | 11.7 |
| Toronto | 15.4 | 1.2 | 2.7 | 11.5 |
| Hamilton | 15.9 | 2.4 | 2.2 | 11.2 |
| Halifax | 17.2 | 1.1 | 0.9 | 15.2 |
| Winnipeg | 30.1 | 5.0 | 4.1 | 21.1 |
| Ottawa (2) | 75.5 | 18.0 | 12.2 | 45.4 |
| Greater Sudbury | 79.0 | 6.8 | 10.0 | 62.3 |
| Moncton | 88.9 | 48.0 | 12.2 | 28.9 |
| Source: Statistics Canada, Census of Population, 2016. | ||||
Healthcare workers who can speak French do not always use it at work. Outside Quebec as a whole, only 41.5% of healthcare workers who knew French in 2016 used it at work at least regularly. However, this proportion varies across metropolitan regions.
For example, in Moncton, nearly 9 in 10 healthcare workers who could speak French used it at work. This proportion falls to 8 in 10 in Sudbury and nearly as many in OttawaNote 2 . In all other census metropolitan areas the rate of French use among those that can speak it ranges from 7.7% (Abbotsford) to 39.9% (Saint John).
Among healthcare workers who could speak French and used it at work in 2016, the vast majority used it as a secondary language in addition to their main language. Only in Moncton was primary use of French more prevalent.
Older healthcare workers: Doubled in size but with lower rates of French knowledge
The healthcare worker population who can speak French outside Quebec continues to age rapidly. In fact, healthcare workers 55 and older who can speak French increased from 9,550 in 2001to 22,210 in 2016, a 133% increase.
However, over that same period, the proportion of French knowledge among older healthcare workers decreased from 10.5% in 2001 to 9.0% in 2016.
Therefore, given a rapidly aging healthcare workforce and decreasing rates of French knowledge among older healthcare workers, it is worth noting the language characteristics of the youngest age group (15 to 29) of healthcare workers who will form the minority language experienced workforce of the future.

9,550 in 2001
22,210 in 2016

Healthcare workers aged 55 and older who can speak French

10.5% in 2001
9.0% in 2016
Sources: Statistics Canada, Census of Population, 2001 and 2016.
Young healthcare workers: More numerous but with lower rates of French knowledge
In 2016, there were 210,330 healthcare workers aged 15 to 29. Among them, 28,690 could speak French, an increase in number of 23.4% since 2001.
However, young healthcare workers without knowledge of French have increased nearly three times faster (+67.4%). As a result, French knowledge rates among young healthcare workers aged 15 to 29 have decreased from 17. 7% in 2001 to 13.6% in 2016.
Nevertheless, even with decreasing rates, younger healthcare workers still have higher rates of French knowledge (13.6%) than healthcare workers aged 55 or more (9.0%) and healthcare workers overall (11.5%).
23,260 in 2001
28,690 in 2016
Healthcare workers aged 15 to 29 who can speak French
17.7% in 2001
13.6% in 2016
Sources: Statistics Canada, Census of Population, 2001 and 2016.
Rates of French use at work decline with age
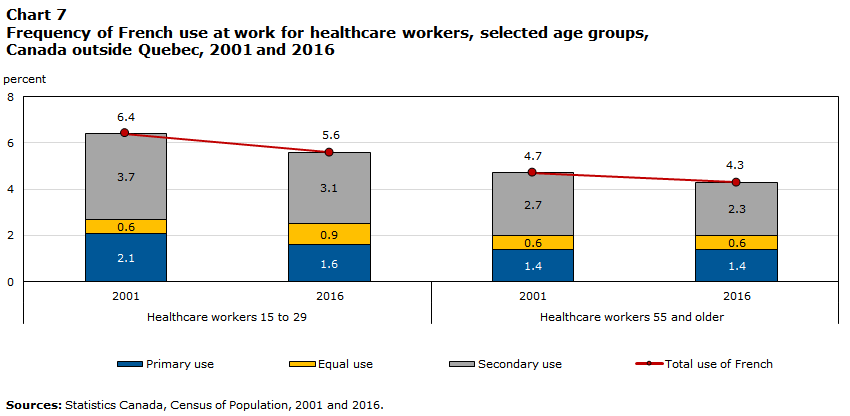
Data table for Chart 7
| Healthcare workers 15 to 29 | Healthcare workers 55 and older | |||
|---|---|---|---|---|
| 2001 | 2016 | 2001 | 2016 | |
| percent | ||||
| Primary use | 2.1 | 1.6 | 1.4 | 1.4 |
| Equal use | 0.6 | 0.9 | 0.6 | 0.6 |
| Secondary use | 3.7 | 3.1 | 2.7 | 2.3 |
| Total use of French | 6.4 | 5.6 | 4.7 | 4.3 |
| Sources: Statistics Canada, Census of Population, 2001 and 2016. | ||||
In Canada outside Quebec, 58,580 healthcare workers reported using French at work in 2016. Among them, 11,710 were aged 15 to 29, 36,210 were aged 30 to 54 and 10,660 aged 55 and older.
Outside Quebec, rates of French use at work among healthcare workers decrease with age. Indeed, among healthcare workers, 5.6% of those aged 15 to 29 reported using French at work in 2016 compared with 4.3% of those aged 55 and older.
Between 2001 and 2016, the proportion of French use at work decreased among younger (15 to 29) and older (55 and older) healthcare workers.
The use of French at work also varies by frequency of language use. Since 2001, among healthcare workers aged 15 to 29, both primary and secondary use of French declined whereas the equal use of French with another language (mainly English) has increased. On the other hand, among healthcare workers aged 55 and older, primary and equal uses of French remained stable whereas secondary use of French at work decreased.
Roughly 4 in 10 healthcare workers who can speak French use it at work
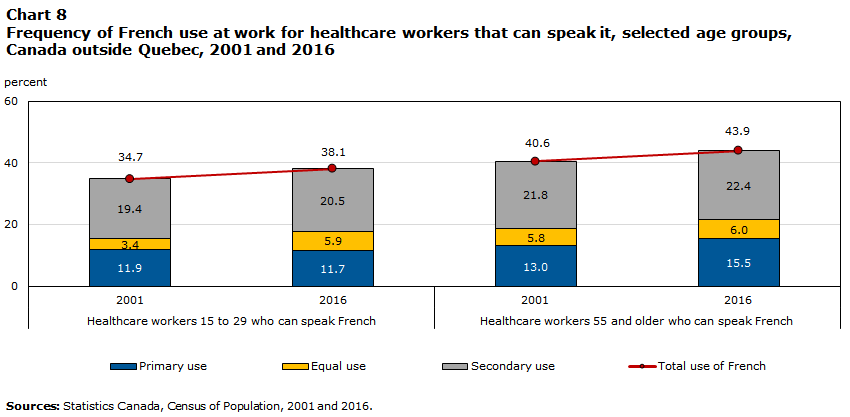
Data table for Chart 8
| Healthcare workers 15 to 29 who can speak French | Healthcare workers 55 and older who can speak French | |||
|---|---|---|---|---|
| 2001 | 2016 | 2001 | 2016 | |
| percent | ||||
| Primary use | 11.9 | 11.7 | 13.0 | 15.5 |
| Equal use | 3.4 | 5.9 | 5.8 | 6.0 |
| Secondary use | 19.4 | 20.5 | 21.8 | 22.4 |
| Total use of French | 34.7 | 38.1 | 40.6 | 43.9 |
| Sources: Statistics Canada, Census of Population, 2001 and 2016. | ||||
In 2016, 58,580 healthcare workers reported using French at work compared to 130,825 who reported being able to speak it. In other words, not every healthcare worker that reports being able to speak French uses it at work.
Among healthcare workers that report being able to speak French in 2016, 41.5% use it at work and this utilization rate increases with age. For example, among healthcare workers aged 15 to 29, 38.1% of those who reported being able to speak French made use of it at work in 2016 compared to 43.9% among those aged 55 and older.
Since 2001, across age groups, rates of French use at work have increased or remained stable among those that speak it. Among healthcare workers aged 15 to 29, rates increased from 34.7% in 2001 to 38.1% in 2016 while for those aged 55 and older these rates went from 40.6% to 43.9%. French use rates remained stable for healthcare workers aged 30 to 54 who could speak it.
In sum, among all healthcare workers, rates of French use at work decrease with age and have decreased or remained stable since 2001. By contrast, among healthcare workers who can speak French, rates of French use at work increase with age and have increased since 2001.
Roughly 4 in 10 healthcare workers who know French are not born in the province they live

Data table for Chart 9
| 2001 | 2016 | |
|---|---|---|
| percent | ||
| Born in province of residence | 55.5 | 57.4 |
| Born elsewhere in Canada | 28.8 | 26.4 |
| Born outside Canada | 15.7 | 16.2 |
| Sources: Statistics Canada, Census of Population, 2001 and 2016. | ||
As healthcare workers who speak French become increasingly older and younger healthcare workers have decreasing rates of French knowledge, immigration and interprovincial mobility can become important additional sources of healthcare workers who speak the minority language.
In Canada outside Quebec, the majority of healthcare workers who know French were born in the province in which they live (57.4%) whereas 26.4% moved from a different province or territory and 16.2% were born abroad.
Between 2001 and 2016, among healthcare workers who can speak French, the proportion born in another country slightly increased whereas that of those born in a different province decreased.
Nearly 3 in 10 healthcare workers who can speak French were not trained in their province of work
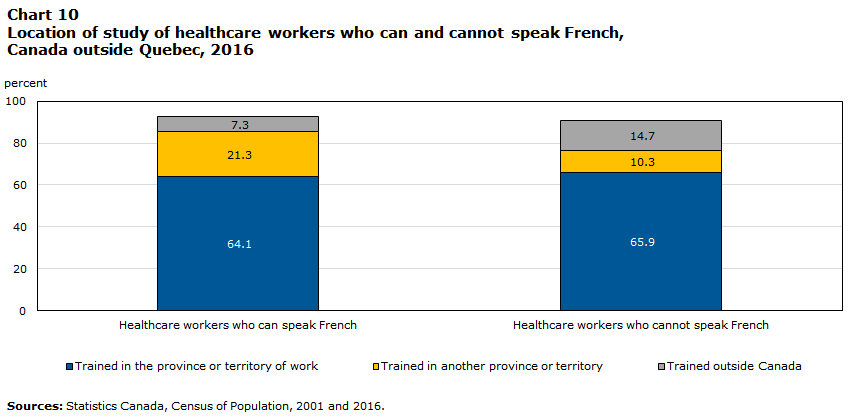
Data table for Chart 10
| Healthcare workers who can speak French | Healthcare workers who cannot speak French | |
|---|---|---|
| percent | ||
| Trained in the province or territory of work | 64.1 | 65.9 |
| Trained in another province or territory | 21.3 | 10.3 |
| Trained outside Canada | 7.3 | 14.7 |
| Sources: Statistics Canada, Census of Population, 2001 and 2016. | ||
Another way of looking at the geographic movement of healthcare workers is to compare the location in which they completed their studies to their current place of work. Are the provinces and territories outside Quebec retaining the majority of healthcare workers who studied within their borders?
In 2016, outside Quebec, 6 in 10 healthcare workers who could speak French were trained in their current province of work, 2 in 10 were trained outside their province of work and 7.3% were trained outside Canada. These proportions have remained stable since 2006.
In 2016, healthcare workers who could speak French were proportionally twice as likely to have been trained in another province and half as likely to have been trained outside Canada compared to those who could not speak French.
More than 3 in 4 healthcare workers who know French studied in a health program
Although the majority of healthcare workers who could speak French outside Quebec graduated from a health program of study, their highest completed degree was not always in a health field.
In fact, outside Quebec, 17% of healthcare workers attained their highest degree from an unrelated program of study including: biology (5.6%), education (5.3%), human services (4.7%) and business administration (4.5%) to mention a few.
On the other hand, workers with health-related credentials may also choose a different field of employment. In 2016, outside Quebec there were 93,870 workers who, although having graduated from a health program and being able to speak French, were not employed in a health occupation.

Description for Figure 1
76.1% Studied and worked in a health field
16.6% Worked in a health-related occupation, but did not study in a health program
Source: Statistics Canada, Census of Population, 2016.
The longer since graduation, the more likely that a health graduate works in a health-related occupation
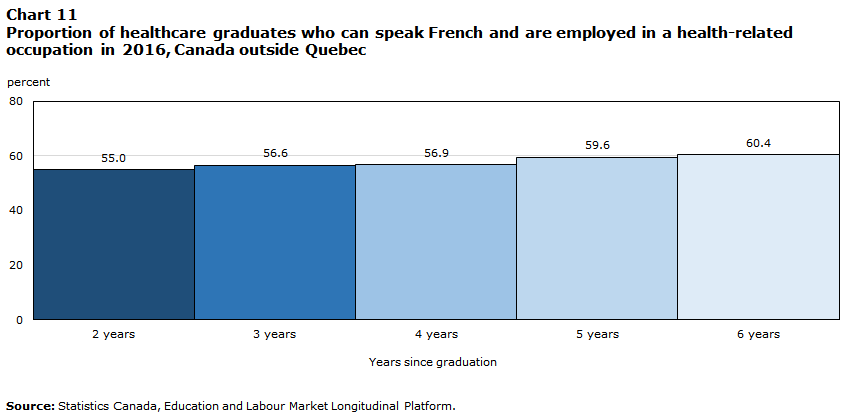
Data table for Chart 11
| 2 years | 3 years | 4 years | 5 years | 6 years | |
|---|---|---|---|---|---|
| percent | |||||
| 2016 | 55.0 | 56.6 | 56.9 | 59.6 | 60.4 |
| Source: Statistics Canada, Education and Labour Market Longitudinal Platform. | |||||
In Canada outside Quebec, slightly more than half of all health graduates who can speak French found employment in a health occupation within 2 years of graduation, and this proportion increases with the number of years since graduation.
Indeed, health graduates who graduated in 2014 (2 years prior) are 5.4 percentage points less likely to work in a health-related occupation than those who graduated in 2010 (6 years prior).
Audiologists and speech-language pathologists report highest rate of French knowledge

In 2016, 130,825 or 11.5% of healthcare workers outside Quebec could speak French, up 43.1% since 2001. Rates of French knowledge, however, vary widely among health occupations.
In 2016, rates of French knowledge were generally higher than average in the following occupations:
- Audiologists and speech-language pathologists (25.1%)
- Specialist physicians (22.3%)
- Psychologists (20.3%)
- General practitioners and family physicians (19.8%)
- Occupational therapists (19.5%)

By contrast, the lowest reported rates were in the following occupations:
- Dental technologists, technicians and laboratory assistants (4.9%)
- Denturists (6.0%)
- Dental assistants (7.0%)
- Opticians (7.7%)
- Medical laboratory technicians and pathologists assistants (8.0%)

Between 2001 and 2016, the five fastest growing professions, among healthcare workers who could speak French were:
- Medical sonographers (+121.7% or +280 workers)
- Social and community service workers (+90% or +5,710 workers)
- Audiologists and speech-language pathologists (+88% or +845 workers)
- Respiratory therapists, clinical perfusionists and cardiopulmonary technologists (+80% or +520)
- Specialist physicians (+79% or +3,235 workers)

In 2016, among healthcare workers who could speak French, the five health-related occupations with the highest proportion of workers aged 55 and older included:
- Practitioners of natural healing (34.3%)
- Psychologists (30.0%)
- Specialist physicians (28.4%)
- Opticians (28.0%)
- Denturists (27.8%)

Women are strongly represented in healthcare occupations. In fact, 79.4% of healthcare workers who could speak French were women. By contrast, outside health-related occupations, 54% of workers who could speak French were women.
Part II: Healthcare workers who can speak or use English at work, Quebec, 2001 to 2016
Number and proportion of healthcare workers who can speak English increasing

Data table for Chart 12
| 2001 | 2006 | 2011 | 2016 | |
|---|---|---|---|---|
| number | ||||
| English only | 6,000 | 5,875 | 7,315 | 7,115 |
| French only | 121,805 | 147,730 | 158,675 | 162,655 |
| English and French | 127,405 | 139,020 | 171,120 | 197,570 |
| percent | ||||
| Total knowledge of English | 52.3 | 49.5 | 52.9 | 55.7 |
| Total knowledge of French | 97.6 | 97.9 | 97.8 | 98.0 |
| Sources: Statistics Canada, Census of Population, 2001, 2006 and 2016; National Household Survey, 2011. | ||||
In 2016, 360,225 healthcare workers could speak French in Quebec representing 98.0% of all healthcare workers. In addition, 204,680 healthcare workers, or 55.7%, also reported being able to speak English.
Between 2001 and 2016 in Quebec, the number of healthcare workers who could speak English increased by +53.4% or +71,280 workers. Over the same period, the number of healthcare workers who could speak French increased by +44.6% or +111,020 workers.
In 2016, among healthcare workers who could speak English in Quebec, 96.5% were English-French bilinguals.
1 in 3 healthcare workers used English at work mostly as a secondary language

Data table for Chart 13
| 2001 | 2006 | 2011 | 2016 | |
|---|---|---|---|---|
| number | ||||
| Primary use | 22,395 | 23,630 | 26,570 | 25,130 |
| Equal use | 10,410 | 10,100 | 14,320 | 20,685 |
| Secondary use | 51,370 | 66,815 | 72,715 | 87,050 |
| percent | ||||
| Total use of English | 33.0 | 34.3 | 33.7 | 36.2 |
| Sources: Statistics Canada, Census of Population, 2001, 2006 and 2016; National Household Survey, 2011. | ||||
In 2016, 132,870 healthcare workers reported using English at work compared to 84,180 in 2001. During this period, their number increased by +57.8% and their proportion grew by +3.2 percentage points. The vast majority reported also using French at work.
In 2016, among healthcare workers who used French at work, 89.1% used it as the primary language of work whereas 5.9% used it equally with another language (mostly English) and 5.0% used it as a secondary language at work.
Among all of Quebec’s healthcare workers who used English at work, 18.9% used it as their primary language at work whereas 15.6% used it equally with another language (mostly French) and 65.5% used it on a regular basis as their secondary language of work. It is worth noting that the primary use of English at work in Quebec has decreased by 7.7 percentage points since 2001.
Healthcare workers who learnt English at home in childhood and can still speak it were significantly more likely to use English at work (91.1%) compared to those who did not learn it at home (51.7%).
6 in 10 healthcare workers who speak English work in Montréal; 1 in 10 in Québec city
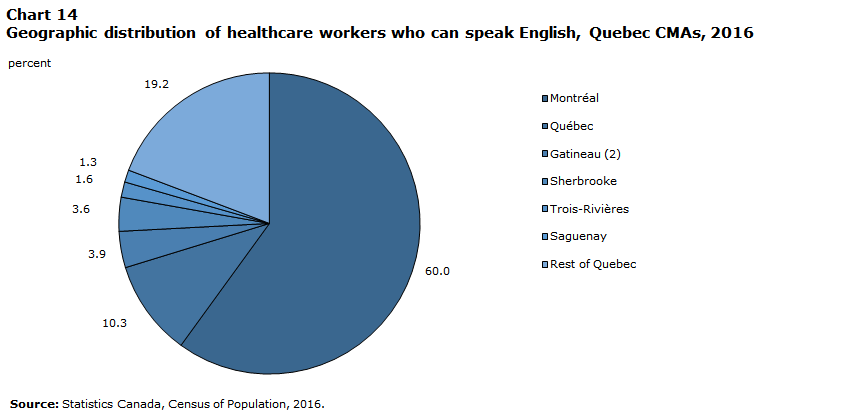
Data table for Chart 14
| 2016 | |
|---|---|
| percent | |
| Montréal | 60.0 |
| Québec | 10.3 |
| Gatineau (2) | 3.9 |
| Sherbrooke | 3.6 |
| Trois-Rivières | 1.6 |
| Saguenay | 1.3 |
| Rest of Quebec | 19.2 |
| Source: Statistics Canada, Census of Population, 2016. | |
The geographic distribution of healthcare workers who can speak English is closely related to the distribution of the total population with English as their first official language spoken.
In 2016, in Quebec, 6 out of every 10 healthcare workers who could speak English in the province worked in Montréal (122,805 workers) with Québec city accounting for an additional 1 in 10 workers (21,010 workers).
Together, the CMAs of Montréal and Québec city accounted for 70.3% of healthcare workers who could speak English in Quebec.

Data table for Chart 15
| Population with English as first official language spoken (FOLS) |
Healthcare workers who can speak English |
Healthcare workers who use English at work |
|
|---|---|---|---|
| thousands | |||
| Gatineau (2) | 58,150 | 7,985 | 6,810 |
| Québec | 15,085 | 21,010 | 5,170 |
| Sherbrooke | 12,405 | 7,460 | 5,490 |
| Trois-Rivières | 2,020 | 3,355 | 470 |
| Saguenay | 1,615 | 2,685 | 470 |
| Source: Statistics Canada, Census of Population, 2016. | |||

Montréal
- 885,610 persons with English as their FOLS
- 122,805 Healthcare workers who can speak English
- 95,885 Healthcare workers who use English at work

Québec
- 15,085 persons with English as their FOLS
- 21,010 Healthcare workers who can speak English
- 5,170 Healthcare workers who use English at work
In Quebec, the size and proportion of the healthcare worker population that can speak or use English at work varies across metropolitan areas.
The population most likely to ask for services in English (FOLS) is concentrated in Montréal (885,610), GatineauNote 2 (58,150) Québec city (15,085) and Sherbrooke (12,405).
Likewise, in 2016, healthcare workers who could speak English are similarly concentrated in Montréal (122,805), Québec city (21,010), GatineauNote 2 (7,985) and Sherbrooke (7,460).
Québec city, Trois-Rivières and Saguenay have more healthcare workers who can speak English than persons with English as their first official language spoken. However, in these regions, fewer healthcare workers use English at work than can speak it.
Gatineau: Highest proportion of healthcare workers who know or use English at work

Data table for Chart 16
| Healthcare workers who can speak English | Healthcare workers who use English at work | |
|---|---|---|
| percent | ||
| Gatineau (2) | 72.1 | 61.5 |
| Montréal | 67.6 | 52.8 |
| Sherbrooke | 56.1 | 41.3 |
| Québec | 46.2 | 11.4 |
| Trois-Rivières | 39.7 | 5.6 |
| Saguenay | 31.8 | 5.6 |
| Source: Statistics Canada, Census of Population, 2016. | ||
7 in 10 healthcare workers in GatineauNote 2 could speak English in 2016, with 6 in 10 using English regularly at work, mostly as a secondary language.
More than half of healthcare workers in Montréal use English at work at least on a regular basis whereas more than 2 in 3 can speak it well enough to hold a conversation.
Although Québec city hosts the second largest number of healthcare workers who can speak English in the province, only roughly 1 in 10 use it at work.
4 in 10 healthcare workers who could speak English did not use it at work
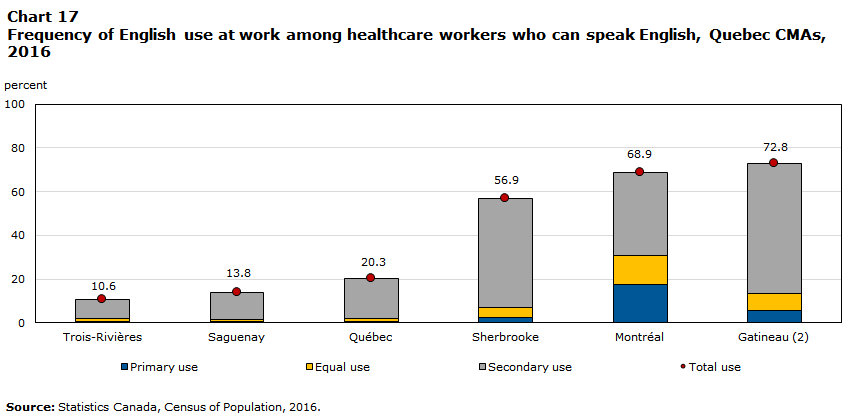
Data table for Chart 17
| Total use | Primary use | Equal use | Secondary use | |
|---|---|---|---|---|
| percent | ||||
| Trois-Rivières | 10.6 | 0.5 | 1.5 | 8.9 |
| Saguenay | 13.8 | 0.5 | 1.0 | 12.4 |
| Québec | 20.3 | 0.8 | 1.4 | 18.1 |
| Sherbrooke | 56.9 | 2.5 | 4.5 | 49.8 |
| Montréal | 68.9 | 17.8 | 12.9 | 38.2 |
| Gatineau (2) | 72.8 | 5.5 | 8.1 | 59.1 |
| Source: Statistics Canada, Census of Population, 2016. | ||||
Having healthcare workers who can speak English in an area does not necessarily imply that they also use English at work. In fact, in Quebec as a whole, 44.1% of healthcare workers able to speak English did not use it at work.
Among the healthcare worker population who could speak English, rates of English use at work were highest in GatineauNote 2 (72.8%) followed by Montréal (68.9%) and Sherbrooke (56.9%).
In all metropolitan areas, the majority of healthcare workers who use English did so as their secondary language in addition to their primary language (mostly French).
Montréal stands out as the CMA with the highest proportion of healthcare workers who use English as their primary language of work (18%) among those who reported being able to conduct a conversation in English. Nevertheless, the majority of healthcare workers who can speak English in Montreal (51%) use it either equally often with another language (mostly French) or as a secondary language of work.
Older healthcare workers doubled in size since 2001 with decreasing knowledge of English
In 2016, there were 34,510 healthcare workers aged 55 and older who could speak English, more than doubling since 2001 (+126%).
During the same period, knowledge of English among the 55 and older population of healthcare workers has decreased by 9.7 percentage points.
In light of the rapid aging of minority language healthcare workers and decreasing rates of English knowledge among them, it is useful to look at the trends among younger healthcare workers who will replace them in time.
15,280 in 2001
34,510 in 2016
Healthcare workers aged 55 and older who can speak English
58.4% in 2001
48.7% in 2016
Sources: Statistics Canada, Census of Population, 2001 and 2016.
English knowledge among young healthcare workers rising in number and proportion
In 2016, 51,375 healthcare workers in Quebec aged 15 to 29 could speak English, or roughly 2 in 3 healthcare workers in this age group.
The number of healthcare workers aged 15 to 29 who can speak English has increased by 72.2% since 2001. During the same period, the proportion of young healthcare workers who can speak English increased from 59.1% in 2001 to 65.5% in 2016.
29,830 in 2001
51,375 in 2016
Healthcare workers aged 15 to 29 who can speak English
59.1% in 2001
65.5% in 2016
Sources: Statistics Canada, Census of Population, 2001 and 2016.
Healthcare workers: English use increased for those 15 to 29 and decreased for those 55 and older
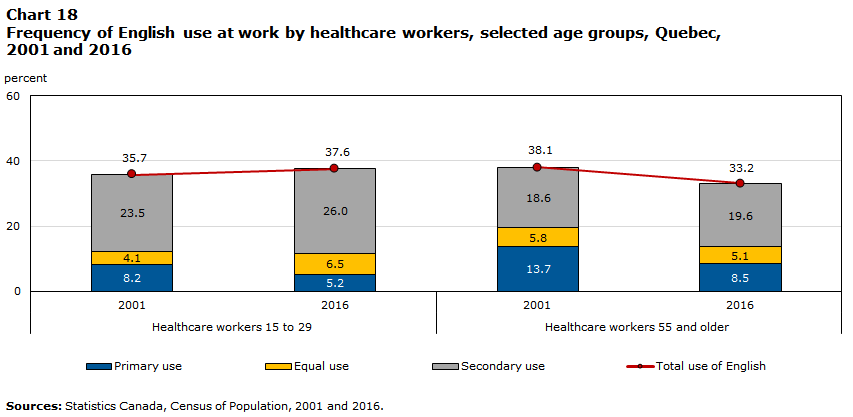
Data table for Chart 18
| Healthcare workers 15 to 29 | Healthcare workers 55 and older | |||
|---|---|---|---|---|
| 2001 | 2016 | 2001 | 2016 | |
| percent | ||||
| Primary use | 8.2 | 5.2 | 13.7 | 8.5 |
| Equal use | 4.1 | 6.5 | 5.8 | 5.1 |
| Secondary use | 23.5 | 26.0 | 18.6 | 19.6 |
| Total use of English | 35.7 | 37.6 | 38.1 | 33.2 |
| Sources: Statistics Canada, Census of Population, 2001 and 2016. | ||||
In 2016, 132,870 healthcare workers reported using English at work. Among them, 29,550 were aged 15 to 29, 79,800 were aged 30 to 54 and 23,520 were aged 55 and older.
In 2016, the older the healthcare worker the lower the rate of English use at work. Indeed, at the time of the 2016 Census, 37.6% of healthcare workers aged 15 to 29 reported using English at work whereas 33.2% of those aged 55 and older reported doing the same. Since 2001, these rates have increased among the young and decreased among their older colleagues.
Increases and decreases in the rate of English use also vary by frequency of language use. Using this perspective, it can be observed that among healthcare workers aged 15 to 29, primary use of English at work decreased from 8.2% in 2001 to 5.2% in 2016. Meanwhile, equal and secondary uses of English grew by 2.4 and 2.5 percentage points respectively. By contrast, among those aged 55 and older, only the secondary use of English at work increased.
1 in 2 young healthcare workers who can speak English use it at work
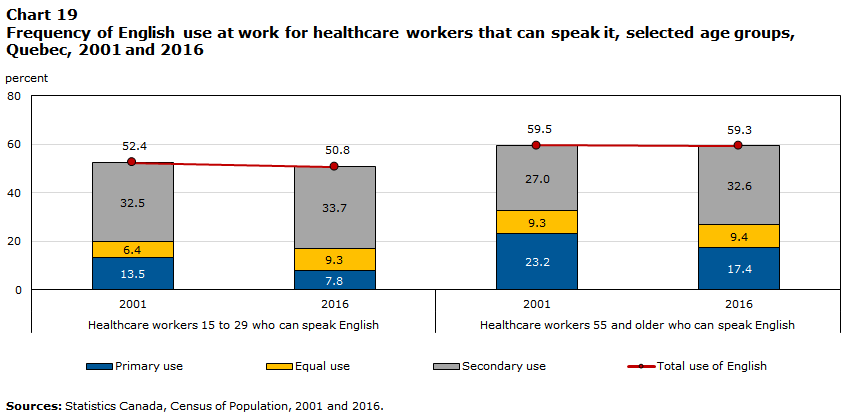
Data table for Chart 19
| Healthcare workers 15 to 29 who can speak English | Healthcare workers 55 and older who can speak English | |||
|---|---|---|---|---|
| 2001 | 2016 | 2001 | 2016 | |
| percent | ||||
| Primary use | 13.5 | 7.8 | 23.2 | 17.4 |
| Equal use | 6.4 | 9.3 | 9.3 | 9.4 |
| Secondary use | 32.5 | 33.7 | 27.0 | 32.6 |
| Total use of English | 52.4 | 50.8 | 59.5 | 59.3 |
| Sources: Statistics Canada, Census of Population, 2001 and 2016. | ||||
In 2016, 132,870 healthcare workers reported using English at work whereas 204,680 reported being able to speak English. In other words, not every healthcare worker who reports being able to speak English uses it at work.
In 2016, 55.9% of the healthcare workers that could speak English used it at work and this utilization rate increased with age. Indeed, half of healthcare workers aged 15 to 29 who could speak English used it at work compared to 6 in 10 among those aged 55 and older.
Since 2001, while the total use of English among those that can speak it changed only slightly (decreased for those aged 15 to 29, increased among the 30 to 54 and remained stable among the 55 and older) the frequency of English use at work has evolved. Notably, since 2001, across all healthcare worker age groups, the use of English as a primary language of work decreased while its use as a secondary language increased.
It is important to reiterate that among healthcare workers overall, rates of English use at work decrease with age whereas among those that can speak English they increase with age. The latter is mainly the result of the greater growth in the 15 to 29 year old population who report knowing English compared to those who use it at work.
Immigration an increasing source of healthcare workers with knowledge of English
Data table for Chart 20
| 2001 | 2016 | |
|---|---|---|
| percent | ||
| Born in Quebec | 80.5 | 77.1 |
| Born elsewhere in Canada | 4.9 | 4.6 |
| Born outside Canada | 14.6 | 18.3 |
| Sources: Statistics Canada, Census of Population, 2001 and 2016. | ||
In 2016, the relative demographic contribution of immigration is roughly four times larger than that of interprovincial mobility to Quebec’s population of healthcare workers who can speak English.
Moreover, the proportion of healthcare workers who can speak English that were born outside Canada increased from 14.6% to 18.3% since 2001.
By contrast, migration of minority language healthcare workers from elsewhere in Canada to Quebec remained stable, ranging between 4.9% and 4.6%.
In 2016, the majority of Quebec’s healthcare workers who could speak English were born in the province (77.1%); indicative of the high levels of English-French bilingualism in Quebec.
The majority of healthcare workers who know English were trained and work in the province
Data table for Chart 21
| Healthcare workers who can speak English | Healthcare workers who cannot speak English | |
|---|---|---|
| percent | ||
| Trained and works in Quebec | 83.6 | 82.8 |
| Trained in elsewhere in Canada | 3.4 | 0.4 |
| Trained outside Canada | 6.3 | 3.9 |
| Sources: Statistics Canada, Census of Population, 2001 and 2016. | ||
Understanding the extent to which those trained in Quebec stay on to work in the province provides a sense of the geographic movement and retention of healthcare workers.
In 2016, the vast majority of healthcare workers who could speak English in Quebec were trained and continue to work in the province (83.6%), up 2.9 percentage points since 2006. On the other hand, 3.4% of Quebec’s healthcare workers were trained in another province or territory and 6.3% were trained outside Canada, these proportions have remained largely stable since 2006.
In 2016, a higher proportion of healthcare workers who could speak English were trained in another province or outside of Canada than those who could not.
In 2016, roughly 125,000 health graduates did not work in a health-related occupation
The majority (76.2%) of Quebec’s healthcare workers who could speak English graduated from a health-related program of study.
However, in 2016, 17.1% of healthcare workers attained their highest degree in an unrelated program of study including: business administration (8.5%), human services (5.7%), humanities (4.6%), natural sciences (3.3%) and education (3.3%) among others.
Workers with a health-related credential may also choose to work in an unrelated occupation. In 2016, there were 125,660 workers able to speak English who studied in a health-related program but did not go on to work in a health-related occupation.

Description for Figure 2
76.2% Studied and worked in a health field
17.1% Worked in a health-related occupation, but did not study in a health program
Source: Statistics Canada, Census of Population, 2016.
In Quebec, 7 in 10 health graduates work in a health occupation within 3 years of graduating

Data table for Chart 22
| 2 years | 3 years | 4 years | 5 years | 6 years | |
|---|---|---|---|---|---|
| percent | |||||
| 2016 | 65.0 | 68.5 | 69.6 | 68.1 | 68.9 |
| Source: Statistics Canada, Education and Labour Market Longitudinal Platform. | |||||
In Quebec, roughly 7 in 10 health graduates who can speak English are employed in a health occupation within three years of their graduation.
On the other hand, about 3 in 10 health graduates who can speak English do not work in a health-related occupation and this proportion decreases only slightly with the number of years since graduation.
Specialist physicians report highest rate of English knowledge
In 2016, 204,680 or 55.7% of healthcare workers in Quebec could speak English, up 53.4% since 2001. Rates of English knowledge, however, vary widely across health occupations.

In 2016, rates of English knowledge were generally higher than average in the following occupations:
- Specialist physicians (95.0%)
- Chiropractors (91.8%)
- Dentists (90.6%)
- General practitioners and family physicians (89.8%)
- Optometrists (87.3%)
The lowest rates of reported English knowledge in 2016 were among:
- Nurse aides, orderlies and patient service associates (34.4%)
- Licensed practical nurses (35.4%)
- Instructors of persons with disabilities (40.7%)
- Dental assistants (49.1%)
- Nursing co-ordinators and supervisors (53.9%)
Between 2001 and 2016, some of the fastest growing health-related occupations among workers that could speak English were:
- Audiologists and speech-language pathologists (+147.8% or +1,330 workers)
- Social and community service workers (+140.0% or +9,235 workers)
- Respiratory therapists, clinical perfusionists and cardiopulmonary technologists (+125.8% or +1,365 workers)
- Paramedical occupations (+103.6% or +1,310 workers)
- Dental hygienists and dental therapists (+90.2% or +1,605 workers)
- Pharmacists (+83.3% or +3,275 workers)
In 2016, among healthcare workers who could speak English, some of the health-related occupations with the highest proportion of workers aged 55 and older included:
- Denturists (38.0%)
- Psychologists (35.1%)
- Medical sonographers (34.6%)
- Specialist physicians (31.5%)
- Dentists (30.5%)
- General practitioners and family physicians (30.2%)
Women are strongly represented in healthcare occupations. In fact, among workers who could speak English in 2016, 76% of healthcare workers were women compared to 45.6% in occupations not related to healthcare.
Part III: Provincial and territorial indicators
Newfoundland and Labrador – Official language minority population in 2016: 2,325 (0.5%)
Healthcare workers who know French
| 2001 | 2016 | |
|---|---|---|
| Number | 665 | 1,355 |
| Percent | 4.0 | 5.7 |
| Sources: Statistics Canada, Census of Population, 2001 and 2016. | ||
Healthcare workers who use French at work
| 2001 | 2016 | |
|---|---|---|
| Number | 105 | 220 |
| Percent | 0.6 | 0.9 |
| Sources: Statistics Canada, Census of Population, 2001 and 2016. | ||
In Newfoundland and Labrador, both the proportions of healthcare workers who knew French and those who used it at work increased between 2001 and 2016.

Data table for Chart 23
| 15 to 29 | 30 to 54 | 55 years and older | |
|---|---|---|---|
| percent | |||
| Cannot speak French | |||
| 2001 | 18.4 | 73.2 | 8.4 |
| 2016 | 17.3 | 64.0 | 18.7 |
| Can speak French | |||
| 2001 | 31.0 | 60.9 | 8.1 |
| 2016 | 41.0 | 48.2 | 10.8 |
| Sources: Statistics Canada, Census of Population, 2001 and 2016. | |||
Data table for Chart 24
| Can speak French | Cannot speak French | |
|---|---|---|
| percent | ||
| In the province | 49.8 | 70.5 |
| Other province | 34.6 | 14.5 |
| Outside Canada | 6.2 | 4.3 |
| No diploma | 9.5 | 10.7 |
| Source: Statistics Canada, Census of Population, 2016. | ||
- Healthcare workers with knowledge of French were younger than those without. Among those aged 15 to 29, knowledge of French increased strongly between 2001 and 2016.
- Over a third of healthcare workers who knew French had completed their postsecondary studies in another province.
Knowledge of French by occupation (at least 250 workers in the province)
- highest rates: physiotherapists (19%), specialist physicians (17%) and general practitioners and family physicians (14%);
- selected lowest rates: licensed practical nurses (1%), nursing coordinators and supervisors (3%) and medical laboratory technicians and pathologists assistants (3%).
Prince Edward Island – Official language minority population in 2016: 4,590 (3.3%)
Healthcare workers who know French
| 2001 | 2016 | |
|---|---|---|
| Number | 460 | 890 |
| Percent | 10.0 | 12.2 |
| Sources: Statistics Canada, Census of Population, 2001 and 2016. | ||
Healthcare workers who use French at work
| 2001 | 2016 | |
|---|---|---|
| Number | 130 | 200 |
| Percent | 2.8 | 2.7 |
| Sources: Statistics Canada, Census of Population, 2001 and 2016. | ||
In Prince Edward Island, the proportion of healthcare workers with knowledge of French increased from 2001 to 2016, but the proportion of those using it at work remained stable.
Data table for Chart 25
| 15 to 29 | 30 to 54 | 55 years and older | |
|---|---|---|---|
| percent | |||
| Cannot speak French | |||
| 2001 | 14.7 | 72.9 | 12.4 |
| 2016 | 20.5 | 55.1 | 24.4 |
| Can speak French | |||
| 2001 | 37.2 | 57.7 | 5.1 |
| 2016 | 29.5 | 57.1 | 13.4 |
| Sources: Statistics Canada, Census of Population, 2001 and 2016. | |||
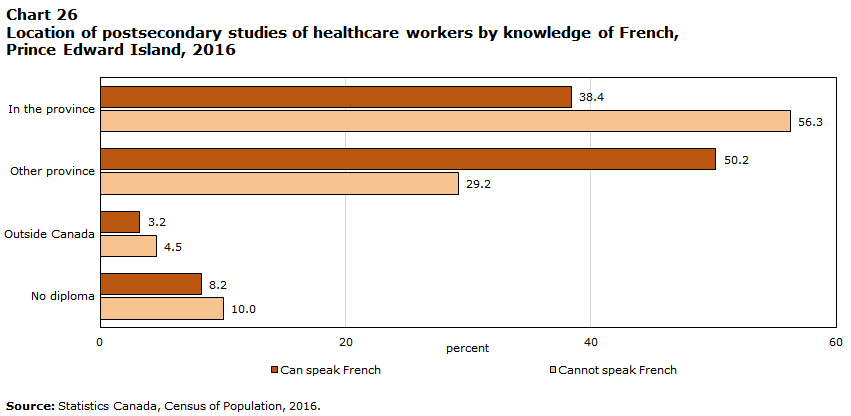
Data table for Chart 26
| Can speak French | Cannot speak French | |
|---|---|---|
| percent | ||
| In the province | 38.4 | 56.3 |
| Other province | 50.2 | 29.2 |
| Outside Canada | 3.2 | 4.5 |
| No diploma | 8.2 | 10.0 |
| Source: Statistics Canada, Census of Population, 2016. | ||
- Healthcare workers who knew French were younger on average. Between 2001 and 2016, the rate of knowledge of French increased among those aged 30 and older, but decreased among those aged 15 to 29.
- Over half of healthcare workers with knowledge of French had completed their postsecondary studies outside the province
Knowledge of French by occupation (at least 100 workers in the province)
- highest rates: specialist physicians (41%), paramedical occupations (27%) and pharmacists (19%);
- selected lowest rates: dental assistants (5%), licensed practical nurses (6%) and nurse aides, orderlies and patient service associates (8%).
Nova Scotia – Official language minority population in 2016: 28,625 (3.2%)
Healthcare workers who know French
| 2001 | 2016 | |
|---|---|---|
| Number | 3,390 | 5,375 |
| Percent | 10.6 | 11.9 |
| Sources: Statistics Canada, Census of Population, 2001 and 2016. | ||
Healthcare workers who use French at work
| 2001 | 2016 | |
|---|---|---|
| Number | 1,025 | 1,490 |
| Percent | 3.2 | 3.3 |
| Sources: Statistics Canada, Census of Population, 2001 and 2016. | ||
In Nova Scotia, the proportions of healthcare workers who knew French and, to a lesser extent, those who used it regularly at work increased between 2001 and 2016.
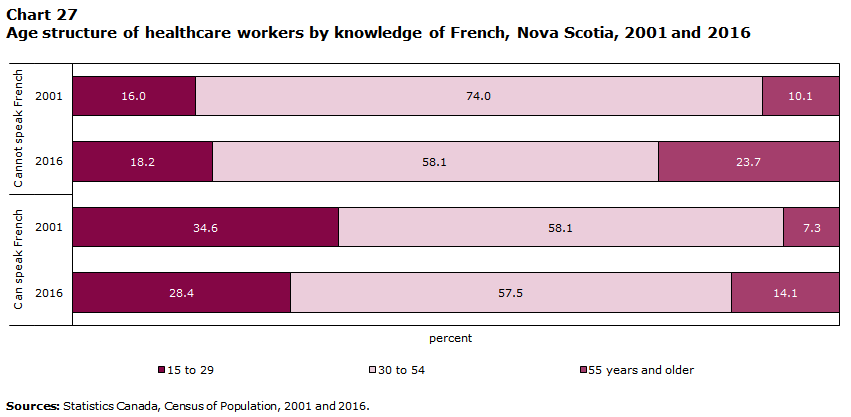
Data table for Chart 27
| 15 to 29 | 30 to 54 | 55 years and older | |
|---|---|---|---|
| percent | |||
| Cannot speak French | |||
| 2001 | 16.0 | 74.0 | 10.1 |
| 2016 | 18.2 | 58.1 | 23.7 |
| Can speak French | |||
| 2001 | 34.6 | 58.1 | 7.3 |
| 2016 | 28.4 | 57.5 | 14.1 |
| Sources: Statistics Canada, Census of Population, 2001 and 2016. | |||

Data table for Chart 28
| Can speak French | Cannot speak French | |
|---|---|---|
| percent | ||
| In the province | 58.4 | 69.0 |
| Other province | 30.3 | 16.3 |
| Outside Canada | 4.3 | 5.9 |
| No diploma | 7.0 | 8.8 |
| Source: Statistics Canada, Census of Population, 2016. | ||
- Younger healthcare workers were more likely to know French. However, rates of knowledge of French decreased slightly between 2001 and 2016 among those aged 15 to 29, and increased among those aged 30 to 54.
- Having studied in another province was more common among healthcare workers who knew French.
Knowledge of French by occupation (at least 250 workers in the province)
- highest rates: specialist physicians (25%), general practitioners and family physicians (24%) and psychologists (23%);
- lowest rates: nursing coordinators and supervisors (7%), licensed practical nurses (7%) and nurse aides, orderlies and patient service associates (8%).
New Brunswick – Official language minority population in 2016: 231,610 (31.8%)
Healthcare workers who know French
| 2001 | 2016 | |
|---|---|---|
| Number | 12,035 | 17,955 |
| Percent | 49.5 | 49.7 |
| Sources: Statistics Canada, Census of Population, 2001 and 2016. | ||
Healthcare workers who use French at work
| 2001 | 2016 | |
|---|---|---|
| Number | 10,655 | 15,895 |
| Percent | 43.9 | 44.0 |
| Sources: Statistics Canada, Census of Population, 2001 and 2016. | ||
In New Brunswick, a stable proportion of almost half of the healthcare workers knew French, and the proportion of those using it regularly at work was only slightly smaller.

Data table for Chart 29
| 15 to 29 | 30 to 54 | 55 years and older | |
|---|---|---|---|
| percent | |||
| Cannot speak French | |||
| 2001 | 14.8 | 73.3 | 12.0 |
| 2016 | 18.1 | 57.0 | 24.9 |
| Can speak French | |||
| 2001 | 23.1 | 67.5 | 9.4 |
| 2016 | 23.4 | 59.3 | 17.3 |
| Sources: Statistics Canada, Census of Population, 2001 and 2016. | |||
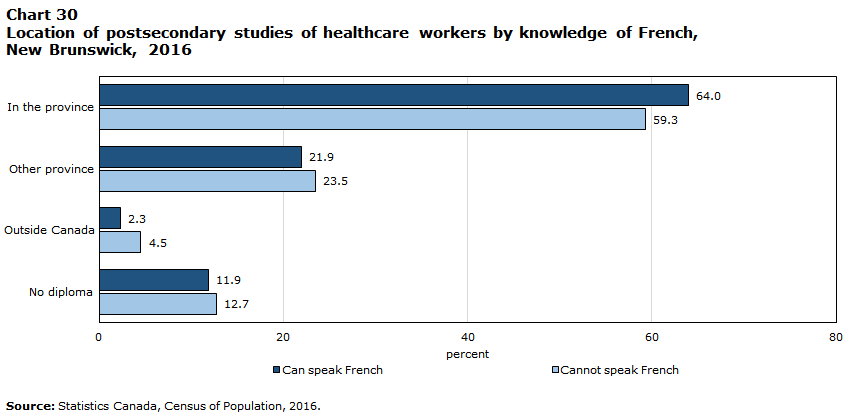
Data table for Chart 30
| Can speak French | Cannot speak French | |
|---|---|---|
| percent | ||
| In the province | 64.0 | 59.3 |
| Other province | 21.9 | 23.5 |
| Outside Canada | 2.3 | 4.5 |
| No diploma | 11.9 | 12.7 |
| Source: Statistics Canada, Census of Population, 2016. | ||
- Between 2001 and 2016, rates of knowledge of French decreased among healthcare workers aged 15 to 29 and over 55, but increased among those aged 30 to 54.
- Those who knew French had more often completed their studies in New Brunswick than those who did not.
Knowledge of French by occupation (at least 250 workers in the province)
- highest rates: audiologists and speech-language pathologists (70%), occupational therapists (64%) and psychologists (63%);
- selected lowest rates: dental assistants (35%) and instructors and teachers of persons with disabilities (42%).
Quebec – Official language minority population in 2016: 1,097,925 (13.8%)
Healthcare workers who know English
| 2001 | 2016 | |
|---|---|---|
| Number | 133,400 | 204,685 |
| Percent | 52.3 | 55.7 |
| Sources: Statistics Canada, Census of Population, 2001 and 2016. | ||
Healthcare workers who use English at work
| 2001 | 2016 | |
|---|---|---|
| Number | 84,175 | 132,870 |
| Percent | 33.0 | 36.2 |
| Sources: Statistics Canada, Census of Population, 2001 and 2016. | ||
In Quebec, more than half of healthcare workers knew English and more than a third used it at work, mostly as a secondary language. Those proportions increased from 2001 to 2016.
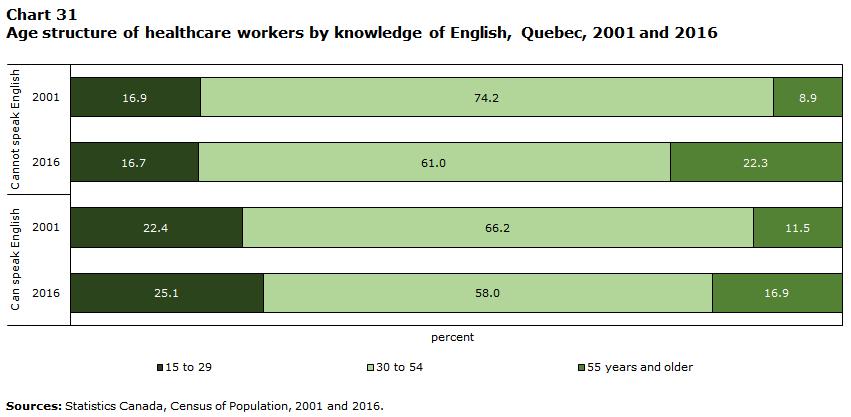
Data table for Chart 31
| 15 to 29 | 30 to 54 | 55 years and older | |
|---|---|---|---|
| percent | |||
| Cannot speak English | |||
| 2001 | 16.9 | 74.2 | 8.9 |
| 2016 | 16.7 | 61.0 | 22.3 |
| Can speak English | |||
| 2001 | 22.4 | 66.2 | 11.5 |
| 2016 | 25.1 | 58.0 | 16.9 |
| Sources: Statistics Canada, Census of Population, 2001 and 2016. | |||

Data table for Chart 32
| Can speak English | Cannot speak English | |
|---|---|---|
| percent | ||
| In the province | 83.6 | 82.8 |
| Other province | 3.4 | 0.4 |
| Outside Canada | 6.3 | 3.9 |
| No diploma | 6.7 | 12.8 |
| Source: Statistics Canada, Census of Population, 2016. | ||
- Between 2001 and 2016, rates of knowledge of English increased among healthcare workers aged 15 to 29 and 30 to 54, but decreased among those over 55. In 2016, two thirds of those aged 15 to 29 knew English.
- A strong majority (5 out of 6) of healthcare workers with knowledge of English had completed their studies in Quebec.
Knowledge of English by occupations (at least 250 workers in the province)
- highest rates: specialist physicians (95%), chiropractors (92%), dentists (91%) and general practitioners and family physicians (90%);
- lowest rates: nurse aides, orderlies and patient service associates (34%), licensed practical nurses (35%) and instructors and teachers of persons with disabilities (41%).
Ontario – Official language minority population in 2016: 547,285 (4.1%)
Healthcare workers who know French
| 2001 | 2016 | |
|---|---|---|
| Number | 49,290 | 67,535 |
| Percent | 14.1 | 12.7 |
| Sources: Statistics Canada, Census of Population, 2001 and 2016. | ||
Healthcare workers who use French at work
| 2001 | 2016 | |
|---|---|---|
| Number | 23,555 | 34,355 |
| Percent | 6.7 | 6.5 |
| Sources: Statistics Canada, Census of Population, 2001 and 2016. | ||
In Ontario, the proportions of healthcare workers who knew French as well as of those using it at work decreased between 2001 and 2016.
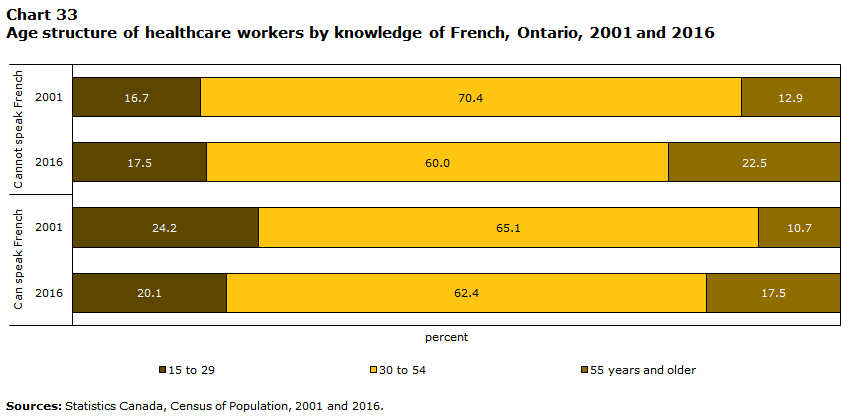
Data table for Chart 33
| 15 to 29 | 30 to 54 | 55 years and older | |
|---|---|---|---|
| percent | |||
| Cannot speak French | |||
| 2001 | 16.7 | 70.4 | 12.9 |
| 2016 | 17.5 | 60.0 | 22.5 |
| Can speak French | |||
| 2001 | 24.2 | 65.1 | 10.7 |
| 2016 | 20.1 | 62.4 | 17.5 |
| Sources: Statistics Canada, Census of Population, 2001 and 2016. | |||
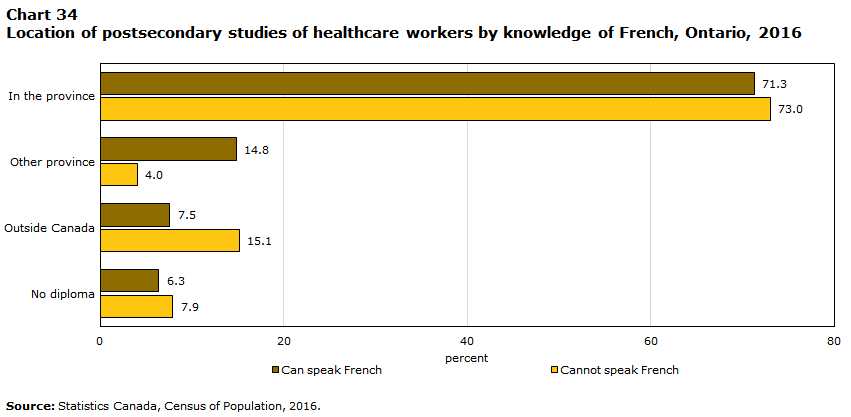
Data table for Chart 34
| Can speak French | Cannot speak French | |
|---|---|---|
| percent | ||
| In the province | 71.3 | 73.0 |
| Other province | 14.8 | 4.0 |
| Outside Canada | 7.5 | 15.1 |
| No diploma | 6.3 | 7.9 |
| Source: Statistics Canada, Census of Population, 2016. | ||
- Healthcare workers with knowledge of French were on average younger than those without. Between 2001 and 2016, rate of knowledge of French remained stable among those aged 30 to 54, but decreased among both younger and older age groups. Among both healthcare workers who knew and did not know French, similar proportions had studied in Ontario.
Knowledge of French by occupations (at least 250 workers in the province)
- highest rates: audiologists and speech-language pathologists (28%), specialist physicians (24%) and psychologists (24%);
- lowest rates: dental technologists, technicians and laboratory assistants (6%), denturists (6%) and cardiology technologists and electrophysiological diagnostic technologists, n.e.c. (7%).
Manitoba – Official language minority population in 2016: 40,020 (3.2%)
Healthcare workers who know French
| 2001 | 2016 | |
|---|---|---|
| Number | 4,230 | 5,590 |
| Percent | 9.4 | 8.8 |
| Sources: Statistics Canada, Census of Population, 2001 and 2016. | ||
Healthcare workers who use French at work
| 2001 | 2016 | |
|---|---|---|
| Number | 1,490 | 1,965 |
| Percent | 3.3 | 3.1 |
| Sources: Statistics Canada, Census of Population, 2001 and 2016. | ||
In Manitoba, both the proportions of healthcare workers with knowledge of French and those who used it at work decreased between 2001 and 2016.

Data table for Chart 35
| 15 to 29 | 30 to 54 | 55 years and older | |
|---|---|---|---|
| percent | |||
| Cannot speak French | |||
| 2001 | 17.7 | 70.7 | 11.6 |
| 2016 | 18.6 | 59.2 | 22.2 |
| Can speak French | |||
| 2001 | 33.8 | 55.1 | 11.1 |
| 2016 | 23.8 | 60.4 | 15.8 |
| Sources: Statistics Canada, Census of Population, 2001 and 2016. | |||
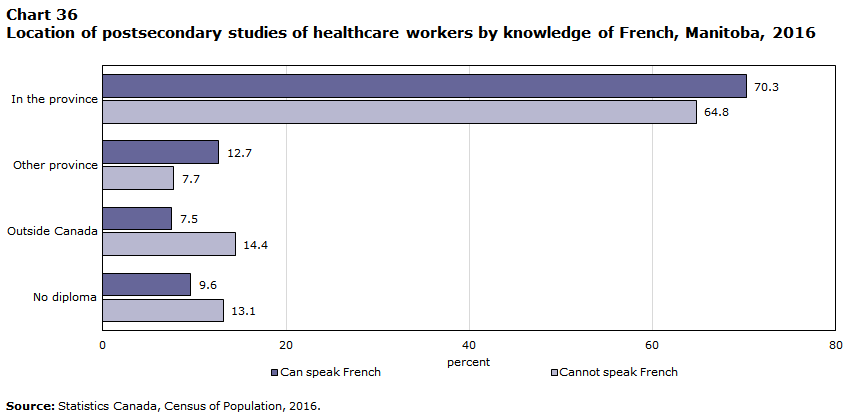
Data table for Chart 36
| Can speak French | Cannot speak French | |
|---|---|---|
| percent | ||
| In the province | 70.3 | 64.8 |
| Other province | 12.7 | 7.7 |
| Outside Canada | 7.5 | 14.4 |
| No diploma | 9.6 | 13.1 |
| Source: Statistics Canada, Census of Population, 2016. | ||
- Between 2001 and 2016, rates of knowledge of French increased slightly among those aged 30 to 54, but decreased among younger and older age groups. Overall, greater proportions of healthcare workers who knew French were under 30 compared to those who did not know French.
- Healthcare workers with knowledge of French had more often studied in Manitoba than those without.
Knowledge of French by profession (at least 250 workers in the province)
- selected highest rates: audiologists and speech-language pathologists (21%), physiotherapists (18%) and specialist physicians (17%);
- lowest rates: licensed practical nurses (3%) and opticians (4%).
Saskatchewan – Official language minority population in 2016: 14,200 (1.3%)
Healthcare workers who know French
| 2001 | 2016 | |
|---|---|---|
| Number | 1,970 | 2,760 |
| Percent | 5.3 | 5.4 |
| Sources: Statistics Canada, Census of Population, 2001 and 2016. | ||
Healthcare workers who use French at work
| 2001 | 2016 | |
|---|---|---|
| Number | 385 | 390 |
| Percent | 1.0 | 0.8 |
| Sources: Statistics Canada, Census of Population, 2001 and 2016. | ||
In 2016, among all provinces, Saskatchewan had the smallest proportions both of healthcare workers with knowledge of French and of those who used it at least regularly at work.
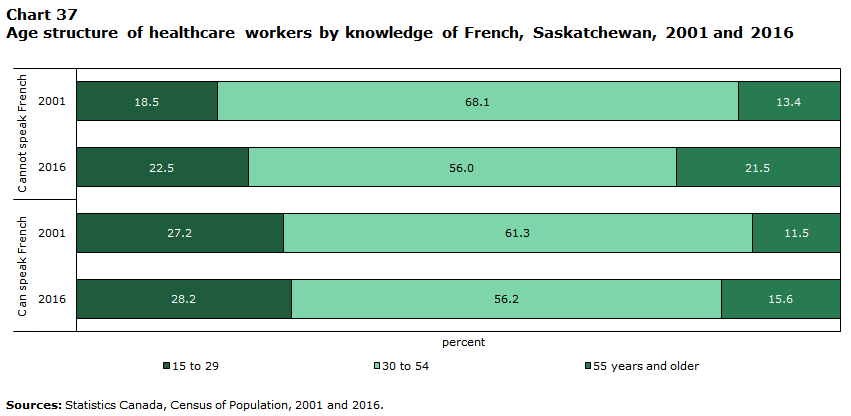
Data table for Chart 37
| 15 to 29 | 30 to 54 | 55 years and older | |
|---|---|---|---|
| percent | |||
| Cannot speak French | |||
| 2001 | 18.5 | 68.1 | 13.4 |
| 2016 | 22.5 | 56.0 | 21.5 |
| Can speak French | |||
| 2001 | 27.2 | 61.3 | 11.5 |
| 2016 | 28.2 | 56.2 | 15.6 |
| Sources: Statistics Canada, Census of Population, 2001 and 2016. | |||
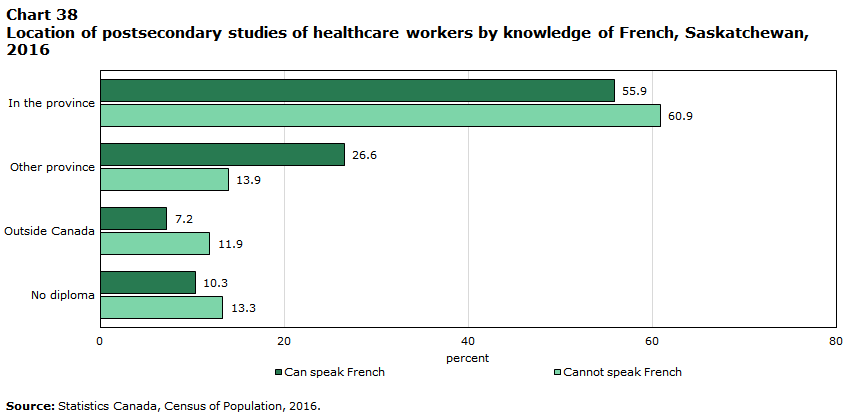
Data table for Chart 38
| Can speak French | Cannot speak French | |
|---|---|---|
| percent | ||
| In the province | 55.9 | 60.9 |
| Other province | 26.6 | 13.9 |
| Outside Canada | 7.2 | 11.9 |
| No diploma | 10.3 | 13.3 |
| Source: Statistics Canada, Census of Population, 2016. | ||
- Healthcare workers who knew French were on average younger than those who did not. Between 2001 and 2016, rates of knowledge of French among those aged 15 to 29 decreased slightly.
- Having studied in another province was more frequent among healthcare workers who know knew French.
Knowledge of French by profession (at least 250 workers in the province)
- highest rates: respiratory therapists, clinical perfusionists and cardiopulmonary technologists (15%), occupational therapists (15%);
- lowest rates: licensed practical nurses (3%), other assisting occupations in support of health services (3%) and nurse aides, orderlies and patient service associates (3%).
Alberta – Official language minority population in 2016: 78,655 (2.0%)
Healthcare workers who know French
| 2001 | 2016 | |
|---|---|---|
| Number | 8,145 | 13,655 |
| Percent | 8.1 | 7.7 |
| Sources: Statistics Canada, Census of Population, 2001 and 2016. | ||
Healthcare workers who use French at work
| 2001 | 2016 | |
|---|---|---|
| Number | 1,135 | 2,225 |
| Percent | 1.1 | 1.3 |
| Sources: Statistics Canada, Census of Population, 2001 and 2016. | ||
In Alberta, the proportion of healthcare workers who knew French decreased, while the proportion of those using French at work increased.

Data table for Chart 39
| 15 to 29 | 30 to 54 | 55 years and older | |
|---|---|---|---|
| percent | |||
| Cannot speak French | |||
| 2001 | 19.9 | 68.4 | 11.7 |
| 2016 | 20.9 | 59.1 | 20.0 |
| Can speak French | |||
| 2001 | 30.7 | 60.0 | 9.4 |
| 2016 | 25.3 | 60.6 | 14.1 |
| Sources: Statistics Canada, Census of Population, 2001 and 2016. | |||

Data table for Chart 40
| Can speak French | Cannot speak French | |
|---|---|---|
| percent | ||
| In the province | 51.8 | 56.5 |
| Other province | 31.3 | 16.8 |
| Outside Canada | 10.9 | 17.5 |
| No diploma | 6.0 | 9.2 |
| Source: Statistics Canada, Census of Population, 2016. | ||
- Between 2001 and 2016, rate of knowledge of French increased among those aged 30 to 54, but decreased among those aged 15 to 29 as well as over 55.
- Having studied in another province was more common among healthcare workers who knew French.
Knowledge of French by profession (at least 250 workers in the province)
- highest rates: other professional occupations in health diagnosing and treating (22%), audiologists and speech-language pathologists (20%) and specialist physicians (17%);
- lowest rates: dental technologists, technicians and laboratory assistants (1%), denturists (3%) and licensed practical nurses (5%).
British Columbia – Official language minority population in 2016: 64,200 (1.4%)
Healthcare workers who know French
| 2001 | 2016 | |
|---|---|---|
| Number | 10,905 | 15,015 |
| Percent | 8.5 | 7.7 |
| Sources: Statistics Canada, Census of Population, 2001 and 2016. | ||
Healthcare workers who use French at work
| 2001 | 2016 | |
|---|---|---|
| Number | 1,150 | 1,595 |
| Percent | 0.9 | 0.8 |
| Sources: Statistics Canada, Census of Population, 2001 and 2016. | ||
In British Columbia, the proportions of healthcare workers who know French and those using it at work decreased between 2001 and 2016.
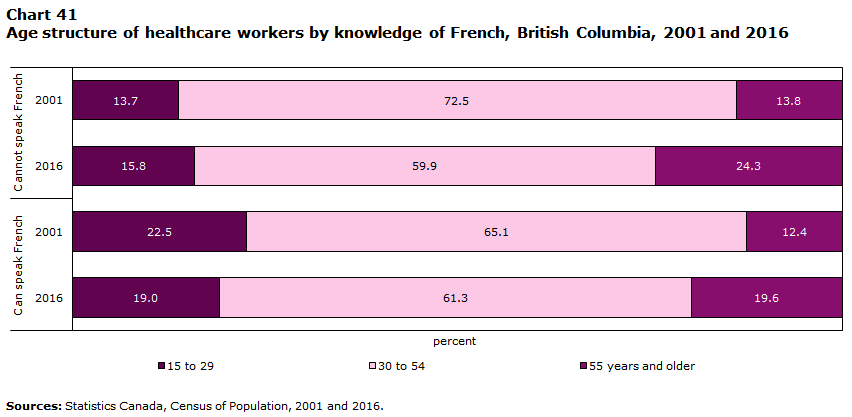
Data table for Chart 41
| 15 to 29 | 30 to 54 | 55 years and older | |
|---|---|---|---|
| percent | |||
| Cannot speak French | |||
| 2001 | 13.7 | 72.5 | 13.8 |
| 2016 | 15.8 | 59.9 | 24.3 |
| Can speak French | |||
| 2001 | 22.5 | 65.1 | 12.4 |
| 2016 | 19.0 | 61.3 | 19.6 |
| Sources: Statistics Canada, Census of Population, 2001 and 2016. | |||

Data table for Chart 42
| Can speak French | Cannot speak French | |
|---|---|---|
| percent | ||
| In the province | 49.2 | 59.1 |
| Other province | 34.2 | 15.3 |
| Outside Canada | 10.5 | 16.9 |
| No diploma | 6.1 | 8.7 |
| Source: Statistics Canada, Census of Population, 2016. | ||
- Between 2001 and 2016, rates of knowledge of French remained stable among healthcare workers aged 30 to 54, but decreased among younger as well as older age groups.
- Having studied in another province was more common among those who knew French, with a third of them having done so.
Knowledge of French by profession (at least 250 workers in the province)
- highest rates: other professional occupations in health diagnosing and treating (21%), audiologists and speech-language pathologists (21%) and specialist physicians (21%);
- lowest rates: nurse aides, orderlies and patient service associates (3%), dental technologists, technicians and laboratory assistants (3%) and licensed practical nurses (4%).
Territories – Official language minority population in 2016: Yukon: 1,610 (4.6%) – Northwest Territories: 1,235 (3.0%) – Nunavut: 620 (1.7%)
Healthcare workers who know French
| 2001 | 2016 | |
|---|---|---|
| Yukon | ||
| Number | 135 | 315 |
| Percent | 10.8 | 16.1 |
| Northwest Territories | ||
| Number | 130 | 265 |
| Percent | 10.3 | 13.4 |
| Nunavut | ||
| Number | 45 | 115 |
| Percent | 8.8 | 9.2 |
| Sources: Statistics Canada, Census of Population, 2001 and 2016. | ||
Healthcare workers who use French at work
| 2001 | 2016 | |
|---|---|---|
| Yukon | ||
| Number | 30 | 115 |
| Percent | 2.4 | 5.8 |
| Northwest Territories | ||
| Number | 25 | 110 |
| Percent | 2.0 | 5.5 |
| Nunavut | ||
| Number | 10 | 25 |
| Percent | 2.0 | 2.0 |
| Sources: Statistics Canada, Census of Population, 2001 and 2016. | ||
In Yukon as well as in the Northwest Territories, the proportions of healthcare workers who knew French and those who used it at work increased notably from 2001 to 2016.
In Nunavut, the proportion of healthcare workers who knew French increased slightly, while the proportion of those using it regularly at work remained stable.

Data table for Chart 43
| 15 to 29 | 30 to 54 | 55 years and older | |
|---|---|---|---|
| percent | |||
| Cannot speak French | |||
| 2001 | 18.9 | 70.4 | 10.7 |
| 2016 | 17.5 | 57.8 | 24.7 |
| Can speak French | |||
| 2001 | 26.3 | 66.4 | 7.4 |
| 2016 | 20.5 | 65.1 | 14.4 |
| Sources: Statistics Canada, Census of Population, 2001 and 2016. | |||
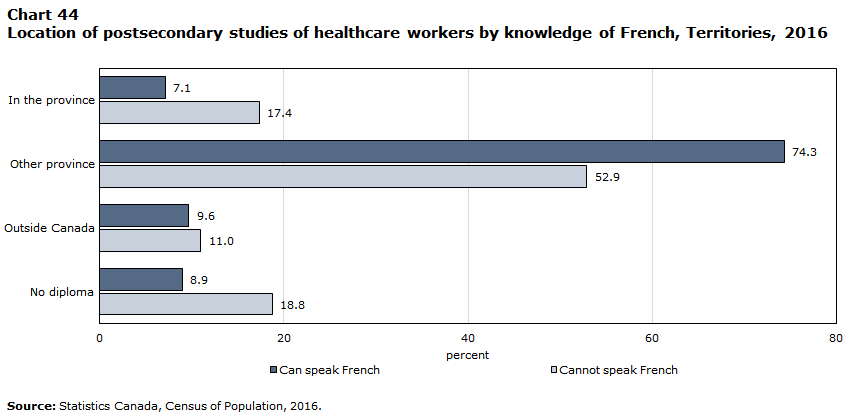
Data table for Chart 44
| Can speak French | Cannot speak French | |
|---|---|---|
| percent | ||
| In the province | 7.1 | 17.4 |
| Other province | 74.3 | 52.9 |
| Outside Canada | 9.6 | 11.0 |
| No diploma | 8.9 | 18.8 |
| Source: Statistics Canada, Census of Population, 2016. | ||
- Healthcare workers who knew French were younger on average than those who did not. Between 2001 and 2016, rates of knowledge of French increased among all age groups.
- A majority of healthcare workers had completed their studies outside of the territory they work in. Among those who knew French, this was even more the case, with 7 in 10 having done so. Unlike in the provinces, both healthcare workers who knew and did not know French had studied outside Canada in similar proportions.
Conclusion
The spread of the COVID-19 pandemic in 2020 highlighted the key role healthcare workers occupy in Canadian society and the urgency of adequate access to healthcare. For the minority language population in Canada, the presence and growth of a healthcare workforce that can speak and use the minority language at work is one contributing factor in improving access to healthcare. Further, although a person’s self-reported ability to hold a general conversation in French or English does not necessarily imply healthcare workers are able to work in that language, a portrait based on a combination of these characteristics provides much valuable insight. To this end, this document shines a light on the linguistic and socio-demographic trends observed since 2001 for this population.
As of 2016, healthcare workers who can speak or work in the minority language of their region are represented from coast to coast. In general, their concentration followed that of the population with the minority language as their first official language spoken and their growth varied across regions and age groups.
All in all, since 2001, healthcare workers who can speak or work in the minority language have increased in number everywhere in Canada. However, only in Quebec did their relative demographic weight increase. By contrast, in Canada outside Quebec the proportion of healthcare workers who could speak French declined, while at the same time the proportion of healthcare workers who reported using French at work remained stable.
Factors like aging, immigration, interprovincial mobility and retention of health graduates in health occupations can all contribute to the changing size and demographic weight of the minority language healthcare worker population.
Firstly, minority language healthcare workers are aging. In fact, older healthcare workers aged 55 and over more than doubled in number since 2001 across Canada. At the same time, a decreasing proportion of those aged 55 and older reported being able to speak the minority language of their region.
In turn, these trends put pressure on the younger generation of healthcare workers, among others, to maintain growth. In Canada outside Quebec, the fact that rates of French knowledge among young healthcare workers are on the decline represents an important challenge and these demographic trends only heighten the importance of additional sources of minority language healthcare workers. The reality is quite different in Quebec as an increasing proportion of Quebec’s young healthcare workers aged 15 to 29 reported being able to speak English.
Specifically, among minority language healthcare workers, immigration remains an important and increasing source of labour, although more so in Quebec than outside it. Outside Quebec, by contrast, interprovincial mobility accounts for the largest external source of labour although to a lesser extent in 2016 than in 2001.
Beyond worker immigration and mobility, it is equally important to observe the transition of health graduates into health occupations. In this respect, roughly 4 in 10 minority language health graduates outside Quebec and 3 in 10 in Quebec were not employed in a health-related occupation in 2016.
In short, through these pages the reader is invited to engage with the full complexity of the socio-demographic and linguistic factors that impact minority language healthcare in Canada.
Acknowledgements
This booklet was written by Alejandro A. Paez Silva and Louis Cornelissen in collaboration with Health Canada. The authors would like to thank Jean-Pierre Corbeil, Éric Caron Malenfant and Émilie Lavoie from the Centre for Ethnocultural, Language and Immigration Statistics (CELIS) at Statistics Canada as well as Nathalie Valdès and Annie Bronsard of Health Canada for their participation and their valuable input throughout the process.
Many thanks to Deniz Do and Marc Bazinet for their design expertise as well as to Marie Comeau and Shelley Dansereau for their data support throughout. The authors also wish to express gratitude to the members of the Centre for Education Statistics for their guidance and expertise with the Education and Labour Market Longitudinal Platform (ELMLP) on healthcare graduates.
- Date modified: