
Ethnicity, Language and Immigration Thematic Series
Portrait of French-speaking workers in Western Canada and the territories’ agriculture and agri-food industries, 2006 and 2016
Skip to text
Text begins
Highlights
- In 2016, 2,305 of the 107,480 farms located in Western Canada (2.1%) had a French-speaking main operator. There were more of these farms in Alberta (750), Saskatchewan (680) and Manitoba (655) than in British Columbia (220).
- In 2016, the proportion of farms operated by one or more people 55 years or older was higher when the main operator was French-speaking than when the main operator was English-speaking. In Saskatchewan, this proportion was 65.8% for farms with a French-speaking main operator and 51.8% for farms with an English-speaking main operator.
- In Manitoba and British Columbia, farms with a French-speaking main operator were more likely to cover a small area and generate low gross farm receipts than those with an English-speaking main operator. Conversely, in Saskatchewan and Alberta, farms whose main operator was French-speaking were more likely to cover a large area and generate high gross farm receipts.
- The number of French-speaking agricultural workers in the Western provinces decreased from 4,810 to 3,695 between 2006 and 2016. In both years, about 2% of agricultural workers were French speakers.
- The proportion of French-speaking agricultural workers aged 55 years or older increased between 2006 and 2016, surpassing the proportion of English-speaking workers. In Saskatchewan, the proportion of French-speaking agricultural workers 55 years or older rose from 56.5% to 71.5% over the decade, while among their English-speaking counterparts, this proportion increased from 42.9% to 49.2%.
- The proportion of self-employed French-speaking agricultural workers was higher than among their
English-speaking counterparts. In 2016, 52.7% of French-speaking agricultural workers in Manitoba were self-employed, compared with 45.7% of English-speaking workers (excluding unpaid family workers). - Between 2006 and 2016, the number of French-speaking agri-food workers was relatively stable in the Western provinces (10,065 to 9,930) and the territories (140 to 135).
- The proportion of French-speaking agri-food workers who were born outside Canada grew between 2006 and 2016. In Alberta, the proportion increased from 22.6% to 37.6% over the decade, and in 2016 more than one in five
French-speaking agri-food workers were born in Africa. - In 2016, French-speaking agri-food workers were more likely to have a postsecondary qualification than their English-speaking counterparts. In British Columbia, 50.1% of French-speaking agri-food workers had this kind of qualification, versus 35.2% of their English-speaking counterparts.
- Excluding British Columbia’s agri-food sector, the proportion of French-speaking agricultural and agri-food workers who used only English at work rose in all Western provinces between 2006 and 2016. In Manitoba’s agri-food sector, this proportion rose from 54.5% to 58.0%.
Acknowledgements
This project was carried out as part of a collaboration between Statistics Canada, Agriculture and Agri-Food Canada (AAFC) as well as Innovation, Science and Economic Development Canada (ISED). Thanks go to Martin Fournier and his team at AAFC for their suggestions and comments.
This project was also made possible thanks to the participation of Leon Laborde and his team at Statistic Canada’s Census of Agriculture.
Finally, the author wishes to thank his counterparts at the Centre for Ethnocultural, Language and Immigration Statistics (CELIS) for their advice and revision efforts, particularly Émilie Lavoie, Bertrand Ouellet-Léveillé, and
Introduction
French speakersNote who work in the agriculture and agri-food industriesNote of Western Canada and the territories have unique characteristics and specific needs as an official language minority. This report provides an overview of farms whose main operatorNote is French-speaking and of French-speaking workers in the agriculture and agri-food industries. It shows how the social, economic and linguistic profile of these workers changed between 2006 and 2016, for Manitoba, Saskatchewan, Alberta and British Columbia (Western Canadian provinces), as well as for Yukon, the
Section 1 of this report presents, for each province,Note the characteristics of farms whose main operator is
Section 2 examines French-speaking workers in the agriculture industries of each Western province.Note Using data from the 2006 and 2016 censuses of population, this section presents the profile of French-speaking agricultural workers and its changes between 2006 and 2016 by age group, sex, place of birth, IndigenousNote identity, education, class of worker, employment income, and languages used at work.
Similarly, section 3 profiles French-speaking agri-food workers and their distribution by industry, for each Western province and for the territories.
Lastly, the conclusion summarizes the trends that were discussed in the previous sections to present general observations on the situation of French speakers in the agriculture and agri-food industries of Western Canada and the territories.
1. Portrait of Western Canadian farms whose main operator is French-speaking
This section examines the characteristics of farms in Western Canada according to the language of the main operator in order to identify potential issues that may be more pronounced for farms operated by French speakers.
The information in this section is based on integrated data from the 2016 Census of Agriculture and the 2016 Census of Population. This data integration helped to determine, for each farm, the first official language spoken—derived from responses to the Census of Population—of the first operator listed on the Census of Agriculture questionnaire. This operator is responsible for making farm management decisions; it may be the owner or tenant of the operation or a hired manager. As a result, farm-specific agricultural data can be presented according to the language of the main operator.
To improve readability, farms whose main operator is a French speaker will be referred to as “French-language farms”, and farms whose main operator is an English speaker as “English-language farms.”
Of the 107,480 farms in Western Canada in 2016, 2,305 were French-language farms. They were distributed across all the Western provinces:
- In Manitoba, there were 14,790 farms in 2016. More than 95% of these farms were English-language farms, and 4.4% (655) were French-language farms. Approximately 20 farms had a main operator who spoke neither English nor French.
- In Saskatchewan, 98.0% of the 34,520 farms were English-language farms in 2016. The province had
680 French-language farms, representing 2.0% of the province’s farms. Fewer than 10 farms had neither an English nor a French speaker as their main operator. - There were 40,640 farms in Alberta in 2016. More than 98% of these were English-language farms, while 1.8% (750) were French-language farms. Approximately 40 Albertan farms had a main operator who spoke neither English nor French.
- In 2016, there were 17,530 farms in British Columbia, 98% of which were English-language farms. There were
220 French-language farms, representing 1.2% of the province’s farms. Just under 1% of farms in British Columbia had a main operator who spoke neither English nor French.
There were not enough farms in the territories to present statistics by the language of their main operator. In 2016,
1.1 Operating arrangements
In 2016, more than half of farms in Western Canada were sole proprietorships. The proportion of farms that were partnerships was 18.1% in Saskatchewan, 22.2% in Alberta and 23.0% in Manitoba, while the proportion of farms that were family corporations was 20.8% in Manitoba, 22.9% in Alberta and 25.3% in Saskatchewan. In British Columbia, the proportion of farms that were partnerships was higher (26.4%) and the proportion of farms that were family corporations was lower (17.2%) than in the other provinces. Furthermore, in 2016, the operating arrangements of
This was not the case for the other Western Canadian provinces—Manitoba, Saskatchewan and Alberta—where the operating arrangements of French-language farms differed from those of English-language farms in 2016. In these provinces, just under half of French-language farms were sole proprietorships, compared with more than 52% of
1.2 Type of farm
In 2016, the proportion of farms across Western Canada that grew crops was higher than the proportion of farms that were engaged in animal production. Excluding British Columbia, the main types of agricultural operations were oilseed and grain farming,Note and cattle ranching and farming.Note
With the exception of Saskatchewan, French-language farms in the Western provinces in 2016 were more likely to be associated with crop farming than English-language farms. In Manitoba and Alberta, French-language farms differed from English-language farms by the higher proportion that grew oilseeds and grains, and the smaller proportion engaged in cattle ranching and farming.
| Farm type | FOLS of main operator | Total: Manitoba | |
|---|---|---|---|
| French | English | ||
| percent | |||
| Animal production | 36.5 | 40.7 | 40.5 |
| Cattle ranching and farming | 25.3 | 28.0 | 27.9 |
| Hog and pig farming | 2.5 | 1.7 | 1.8 |
| Poultry and egg production | 1.4 | 1.7 | 1.7 |
| Sheep and goat farming | 0.9 | 1.2 | 1.2 |
| Other animal production | 6.3 | 8.0 | 7.9 |
| Crop farming | 63.5 | 59.3 | 59.5 |
| Oilseed and grain farming | 49.1 | 45.1 | 45.3 |
| Vegetable and melon farming | 1.3 | 1.3 | 1.3 |
| Greenhouse, nursery and floriculture production | 1.2 | 1.3 | 1.3 |
| Fruit and tree nut farming | 0.9 | 0.5 | 0.5 |
| Other crop farming | 11.0 | 11.1 | 11.1 |
| Total | 100.0 | 100.0 | 100.0 |
Sources: Statistics Canada, integrated data from the 2016 Censuses of Population and Agriculture. |
|||
In 2016, about 45% of Manitoba farms grew oilseeds and grains, and 27.9% were dedicated to cattle ranching and farming. About four in ten farms were engaged in animal production and nearly six in ten grew crops.
In Manitoba, there was little difference between the farm types of English- and French-language farms. The proportion of French-language farms that grew oilseeds and grains (49.1%) was higher than that of English-language farms (45.1%), while a lower proportion of French-language farms were engaged in cattle ranching and farming (25.3%) than
| Farm type | FOLS of main operator | Total: Saskatchewan | |
|---|---|---|---|
| French | English | ||
| percent | |||
| Animal production | 24.6 | 26.8 | 26.7 |
| Cattle ranching and farming | 19.0 | 21.1 | 21.1 |
| Hog and pig farming | 0.7 | 0.1 | 0.1 |
| Other animal production | 4.9 | 5.6 | 5.5 |
| Crop farming | 75.4 | 73.2 | 73.3 |
| Oilseed and grain farming | 64.3 | 62.3 | 62.3 |
| Other crop farming | 11.1 | 11.0 | 11.0 |
| Total | 100.0 | 100.0 | 100.0 |
Sources: Statistics Canada, integrated data from the 2016 Censuses of Population and Agriculture. |
|||
In 2016, more than six in ten farms in Saskatchewan were engaged in oilseed and grain farming, and about one in five of the province’s farms were dedicated to cattle ranching and farming. The farm types of English- and French-language farms in this province were similar.
| Farm type | FOLS of main operator | Total: Alberta | |
|---|---|---|---|
| French | English | ||
| percent | |||
| Animal production | 30.8 | 46.4 | 46.1 |
| Cattle ranching and farming | 18.7 | 31.5 | 31.2 |
| Other animal production | 12.1 | 14.9 | 14.9 |
| Crop farming | 69.2 | 53.6 | 53.9 |
| Oilseed and grain farming | 48.1 | 32.8 | 33.1 |
| Greenhouse, nursery and floriculture production | 1.1 | 1.5 | 1.5 |
| Vegetable and melon farming | 0.9 | 0.7 | 0.7 |
| Other crop farming | 19.1 | 18.6 | 18.6 |
| Total | 100.0 | 100.0 | 100.0 |
Sources: Statistics Canada, integrated data from the 2016 Censuses of Population and Agriculture. |
|||
In 2016, 31.2% of Alberta farms raised cattle and about one-third of the province’s farms grew oilseeds and grains. The proportion of Alberta farms dedicated to animal production (46.1%) was higher than in Manitoba and Saskatchewan.
The proportion of French-language farms in Alberta dedicated to crop farming (69.2%) was higher than the proportion of English-language farms (53.6%). Just under half of French-language farms grew oilseeds and grains, compared with less than one-third of English-language farms. Conversely, the proportion of French-language farms dedicated to cattle ranching and farming (18.7%) was lower than that of English-language farms (31.5%).
| Farm type | FOLS of main operator | Total: British Columbia | |
|---|---|---|---|
| French | English | ||
| percent | |||
| Animal production | 32.4 | 46.7 | 46.2 |
| Cattle ranching and farming | 10.9 | 16.6 | 16.4 |
| Poultry and egg production | 4.5 | 7.0 | 7.0 |
| Sheep and goat farming | 2.7 | 3.2 | 3.2 |
| Other animal production | 14.3 | 19.9 | 19.7 |
| Crop farming | 67.6 | 53.3 | 53.8 |
| Fruit and tree nut farming | 23.1 | 17.8 | 18.1 |
| Vegetable and melon farming | 12.5 | 6.3 | 6.5 |
| Greenhouse, nursery and floriculture production | 10.0 | 8.5 | 8.6 |
| Oilseed and grain farming | 2.3 | 1.7 | 1.7 |
| Other crop farming | 19.7 | 19.0 | 18.9 |
| Total | 100.0 | 100.0 | 100.0 |
Sources: Statistics Canada, integrated data from the 2016 Censuses of Population and Agriculture. |
|||
Unlike in the other Western provinces, oilseeds and grains were grown in relatively few farms in British Columbia (less than 2%) in 2016. In contrast, about 18% of farms in this province were dedicated to fruit and tree nut farming and nearly 9% to greenhouse, nursery and floriculture production.Note In addition, nearly one in six farms were engaged in cattle ranching and farming.
French-language farms were more likely to be associated with crop farming (67.6%) than English-language farms (53.3%) in British Columbia. The proportion of French-language farms that grew fruits and tree nuts (23.1%) was higher than that of English-language farms (17.8%), and the proportion of French-language farms that practised vegetable and melon farmingNote (12.5%) was almost twice as high as that of English-language farms (6.3%). Just under a third of
1.3 Age group and generational profile of operators
Between one and three farm operators can be listed per farm on the Census of Agriculture questionnaire. The people who operate a given farm may belong to the same or to different age groups.
In 2016, a significant proportion of farms in Western Canada were operated exclusively by persons aged 55 years or older. In all provinces, this proportion was higher on French-language farms than English-language farms, and a smaller share of French-language farms were operated exclusively by people under 35 years. This suggests that the aging of farm operators was more pronounced on French-language farms than on English-language farms.
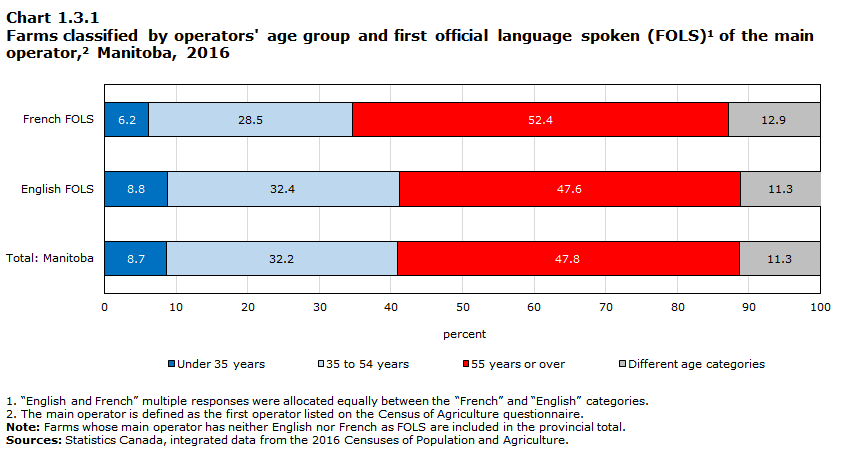
Data table for Chart 1.3.1
| Under 35 years | 35 to 54 years | 55 years or over | Different age categories | |
|---|---|---|---|---|
| percent | ||||
| French FOLS | 6.2 | 28.5 | 52.4 | 12.9 |
| English FOLS | 8.8 | 32.4 | 47.6 | 11.3 |
| Total: Manitoba | 8.7 | 32.2 | 47.8 | 11.3 |
Sources: Statistics Canada, integrated data from the 2016 Censuses of Population and Agriculture. |
||||
Manitoba farm operators were relatively old in 2016; nearly 48% of the province’s farms were operated exclusively by persons 55 years or older, and less than 9% of Manitoba farms were operated exclusively by people under the age of 35. The proportion of French-language farms operated by persons 55 years or older (52.4%) was higher than for
In 2016, the proportion of French-language farms in Manitoba that were multigenerationalNote (8.9%) was slightly higher than that of English-language farms (7.0%).
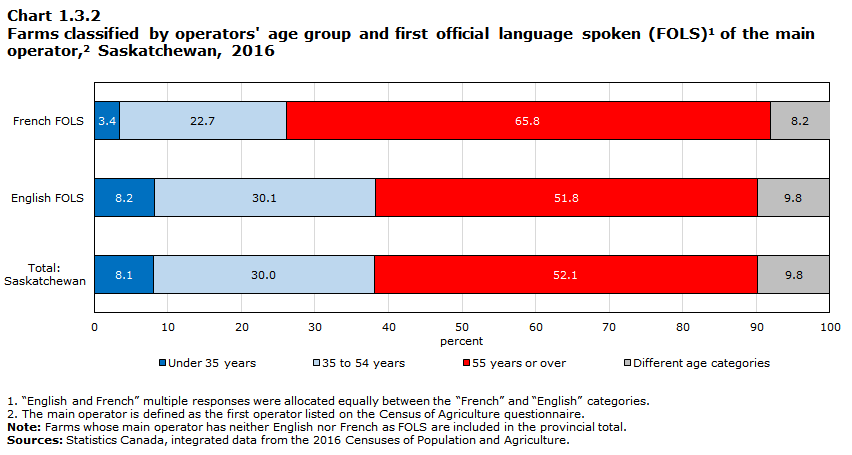
Data table for Chart 1.3.2
| Under 35 years | 35 to 54 years | 55 years or over | Different age categories | |
|---|---|---|---|---|
| percent | ||||
| French FOLS | 3.4 | 22.7 | 65.8 | 8.2 |
| English FOLS | 8.2 | 30.1 | 51.8 | 9.8 |
| Total: Saskatchewan | 8.1 | 30.0 | 52.1 | 9.8 |
Sources: Statistics Canada, integrated data from the 2016 Censuses of Population and Agriculture. |
||||
More than half of Saskatchewan farms were operated exclusively by persons 55 years or older in 2016. Nearly 66% of French-language farms were operated exclusively by persons in this age group, compared with less than 52% of
The proportion of multigenerational French-language farms (4.6%) was slightly lower than that of English-language farms (5.7%) in Saskatchewan.
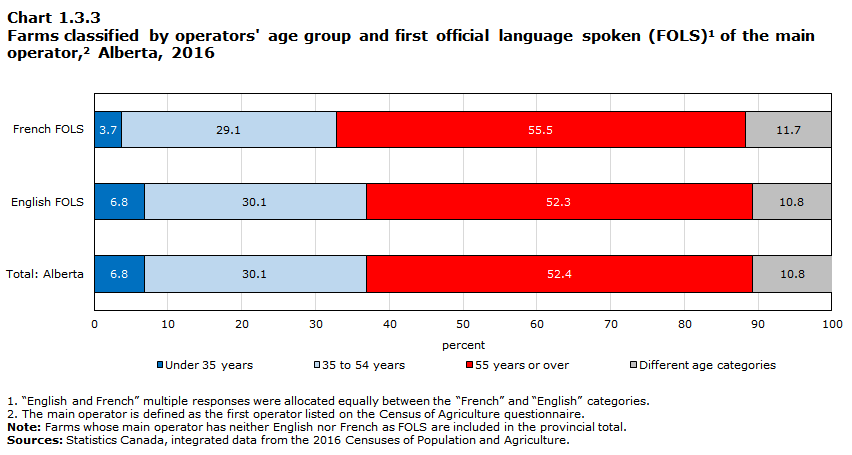
Data table for Chart 1.3.3
| Under 35 years | 35 to 54 years | 55 years or over | Different age categories | |
|---|---|---|---|---|
| percent | ||||
| French FOLS | 3.7 | 29.1 | 55.5 | 11.7 |
| English FOLS | 6.8 | 30.1 | 52.3 | 10.8 |
| Total: Alberta | 6.8 | 30.1 | 52.4 | 10.8 |
Sources: Statistics Canada, integrated data from the 2016 Censuses of Population and Agriculture. |
||||
In Alberta in 2016, more than half of farms were operated exclusively by persons 55 years or older. This proportion was higher for French-language farms (55.5%) than for English-language farms (52.3%). Moreover, the share of
In 2016, a similar proportion of French-language (5.7%) and English-language (5.9%) farms in Alberta were multigenerational.
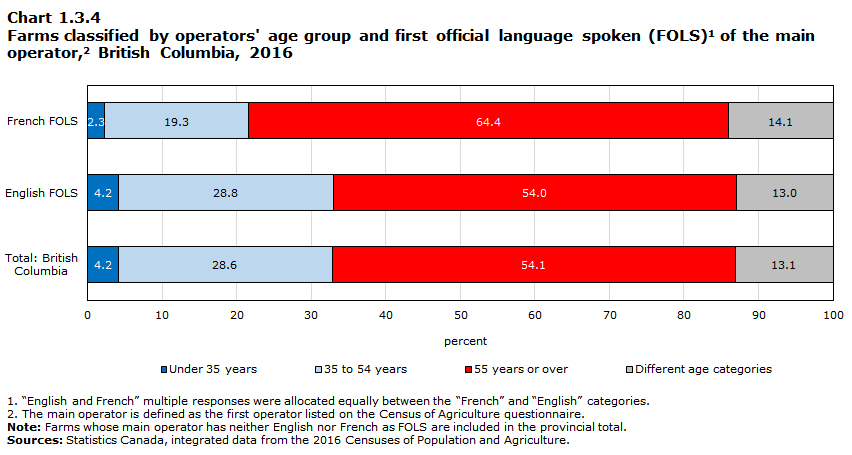
Data table for Chart 1.3.4
| Under 35 years | 35 to 54 years | 55 years or over | Different age categories | |
|---|---|---|---|---|
| percent | ||||
| French FOLS | 2.3 | 19.3 | 64.4 | 14.1 |
| English FOLS | 4.2 | 28.8 | 54.0 | 13.0 |
| Total: British Columbia | 4.2 | 28.6 | 54.1 | 13.1 |
Sources: Statistics Canada, integrated data from the 2016 Censuses of Population and Agriculture. |
||||
In 2016, about 54% of British Columbia farms were operated exclusively by persons 55 years or older. This proportion was higher for French-language farms (64.4%) than English-language farms (54.0%).
The proportion of multigenerational farms in British Columbia was similar for French- (7.7%) and English-language (6.7%) farms in 2016.
1.4 Land tenure
A farm’s land can be classified under more than one type of tenure, as the different parts of a given farm can be occupied in different ways.
Across Western Canada, more than 93% of farms included land that they owned. This proportion was similar in both French- and English-language farms in 2016, except in Saskatchewan, where the share of French-language farms that included land they owned (96.3%) was higher than for English-language farms (93.7%).
The proportion of farms that included land rented from governments was 6.6% in British Columbia, 11.4% in Manitoba, 13.9% in Alberta, and 15.5% in Saskatchewan. These proportions were similar for both French- and English-language farms.
Lastly, the share of French-language farms that included land rented from entities other than governments was lower than for English-language farms in Manitoba (44.4% compared with 47.2%), in Saskatchewan (37.5% compared with 44.4%), and in British Columbia (14.1% compared with 19.0%). In contrast, in Alberta, this proportion was higher for French-language farms (40.1%) than for English-language farms (37.9%).
1.5 Total farm area
The area covered by farms varied significantly among the provinces of Western Canada in 2016. The proportion of farms with a vast area, of 1,120 acres or more, was lower in British Columbia (6.0%) and higher in Alberta (27.3%), Manitoba (33.2%) and Saskatchewan (44.8%). In contrast, the share of farms with an area of less than 130 acres was higher in British Columbia (73.8%) and lower in Alberta (18.6%), Manitoba (17.6%) and Saskatchewan (7.0%).
The area covered by French-language farms differed from that of English-language farms in all Western provinces in 2016. In Manitoba and British Columbia, a greater share of French-language farms covered a small area. The proportion of French-language farms in Manitoba with an area of less than 400 acres (45.8%) was higher that of English-language farms (41.0%), and the share of French-language farms in British Columbia with an area of less than 130 acres (80.1%) was higher than that of English-language farms (73.5%).
In contrast to Manitoba and British Columbia, the proportion of French-language farms in Saskatchewan and Alberta that covered a small area was lower than that of English-language farms. In these provinces, the share of French-language farms with an area of less than 400 acres (26.9% in Saskatchewan and 43.7% in Alberta) was lower than the proportion of English-language farms (30.4% in Saskatchewan and 48.8% in Alberta).
1.6 Total gross farm receipts
In 2016, the proportion of Western Canada farms with gross farm receipts below $25,000 was lower in Saskatchewan (18.9%) and Manitoba (23.7%), and higher in Alberta (29.0%) and British Columbia (58.4%). Conversely, the proportion of farms that generated high farm receipts ($500,000 or more) was lower in British Columbia (8.5%) and Alberta (16.3%), and higher in Manitoba (21.3%) and Saskatchewan (21.8%).
French-language farms were more likely to generate high gross farm receipts of $500,000 or more than English-language farms in Manitoba (23.4% compared with 21.1%), Saskatchewan (25.4% compared with 21.8%), and Alberta (23.1% compared with 16.1%). The opposite was observed in British Columbia, where the proportion was 4.8% for
French-language farms also differed from English-language farms in the proportion that reported low farm receipts (less than $25,000). In 2016, this proportion was lower for French-language farms than for English-language farms in Saskatchewan (16.0% compared with 18.9%) and Alberta (25.5% versus 29.1%). In contrast, the proportion of French-language farms with farm receipts below $25,000 was higher than the share of English-language farms in Manitoba (26.9% versus 23.5%) and British Columbia (65.5% compared with 58.5%).
A link can be drawn between the area of French-language farms and the gross farm receipts these farms generate. In 2016, French-language farms in Manitoba and British Columbia, which were more likely to be smaller in area than English-language farms, were also more likely to generate low farm receipts. Conversely, the high proportion of
1.7 Total farm capital
The proportion of farms in the Western provinces with high farm capital ($3,500,000 or more) was relatively similar in Manitoba (22.8%) and Saskatchewan (22.9%), and was a bit higher in Alberta (25.6%). That proportion was lower in
There were some differences in the farm capital of French- and English-language farms in all Western provinces, except Saskatchewan. The proportion of French-language farms with farm capital of $3,500,000 or more was higher than that of English-language farms in Manitoba (25.4% compared with 22.7%) and Alberta (29.6% versus 25.5%). Conversely, this proportion was lower among French-language farms in British Columbia (7.3% compared with 12.9%). Furthermore, the share of French-language farms with farm capital below $500,000 was higher than for English-language farms in Manitoba (26.9% compared with 24.8%) and British Columbia (24.8% compared with 22.6%). In both provinces, the proportions of French-language farms that covered a small area and generated low farm receipts were also higher than those of English-language farms.
2. Social, economic and linguistic profile of French-speaking agricultural workers in Western Canada
This section presents the changes in the social, economic and linguistic profile of French-speaking agricultural workers in the Western provinces between 2006 and 2016. “Agricultural workers” refers not only to the farm operators mentioned in the previous section, but to all persons aged 15 and older who workedNote on a farm, in crop and animal production, in greenhouse, nursery and floriculture production, or in aquaculture. Table A.1 in Appendix A provides a detailed list of the industries in the agriculture sector. The data presented in this section are from the 2006 and 2016 censuses of population.
| Province or territories | FOLS | |||||||
|---|---|---|---|---|---|---|---|---|
| 2006 | 2016 | |||||||
| French | English | Neither English nor French |
Total | French | English | Neither English nor French |
Total | |
| number | ||||||||
| Manitoba | 1,480 | 34,080 | 160 | 35,715 | 1,165 | 27,990 | 195 | 29,350 |
| Saskatchewan | 1,280 | 59,750 | 105 | 61,135 | 960 | 53,090 | 60 | 54,105 |
| Alberta | 1,390 | 72,440 | 195 | 74,030 | 1,060 | 63,145 | 425 | 64,630 |
| British Columbia | 655 | 40,185 | 5,145 | 45,985 | 515 | 37,600 | 5,350 | 43,460 |
| Total: Western Canada | 4,810 | 206,455 | 5,605 | 216,865 | 3,695 | 181,830 | 6,030 | 191,545 |
| Territories | 10 | 145 | 0 | 160 | 25 | 190 | 0 | 215 |
| percent | ||||||||
| Manitoba | 4.1 | 95.4 | 0.4 | 100.0 | 4.0 | 95.4 | 0.7 | 100.0 |
| Saskatchewan | 2.1 | 97.7 | 0.2 | 100.0 | 1.8 | 98.1 | 0.1 | 100.0 |
| Alberta | 1.9 | 97.9 | 0.3 | 100.0 | 1.6 | 97.7 | 0.7 | 100.0 |
| British Columbia | 1.4 | 87.4 | 11.2 | 100.0 | 1.2 | 86.5 | 12.3 | 100.0 |
| Total: Western Canada | 2.2 | 95.2 | 2.6 | 100.0 | 1.9 | 94.9 | 3.1 | 100.0 |
| Territories | 5.7 | 94.3 | 0.0 | 100.0 | 11.8 | 88.2 | 0.0 | 100.0 |
Sources: Statistics Canada, 2006 and 2016 censuses of population. |
||||||||
The number of agricultural workers fell in the Western provinces from 216,865 in 2006 to 191,545 in 2016. This is a decrease of about 12% in the workforce. In 2016, the provinces with the most agricultural workers were Alberta (64,630) and Saskatchewan (54,105). There was also a significant number of agricultural workers in British Columbia (43,460) and Manitoba (29,350). In the territories, the number of agricultural workers rose slightly, from 160 in 2006 to 215 in 2016.
The decrease in FrancophoneNote agricultural workers in the provinces of Western Canada between 2006 and 2016 was even greater than among all agricultural workers. The number of Francophone agricultural workers fell by about 23%, from 4,810 in 2006 to 3,695 in 2016. The proportion of Francophone agricultural workers in Western Canada declined from 2.2% in 2006 to 1.9% in 2016. A decrease in the number of Francophone agricultural workers over the decade was observed in all the Western provinces.
In 2016, there were many Francophone agricultural workers in each Western province: Manitoba (1,165 workers), Alberta (1,060), Saskatchewan (960), and British Columbia (515). About 4.0% of Manitoba’s agricultural workers in 2016 were Francophone, while in the other Western provinces, this proportion was less than 2%. There were 25 Francophone agricultural workers in the territories in 2016,Note mainly in Yukon.
For each province, there were some specificities related to the change in the number of agricultural workers between 2006 and 2016 and the concentration of Francophone agricultural workers in certain census agricultural regions
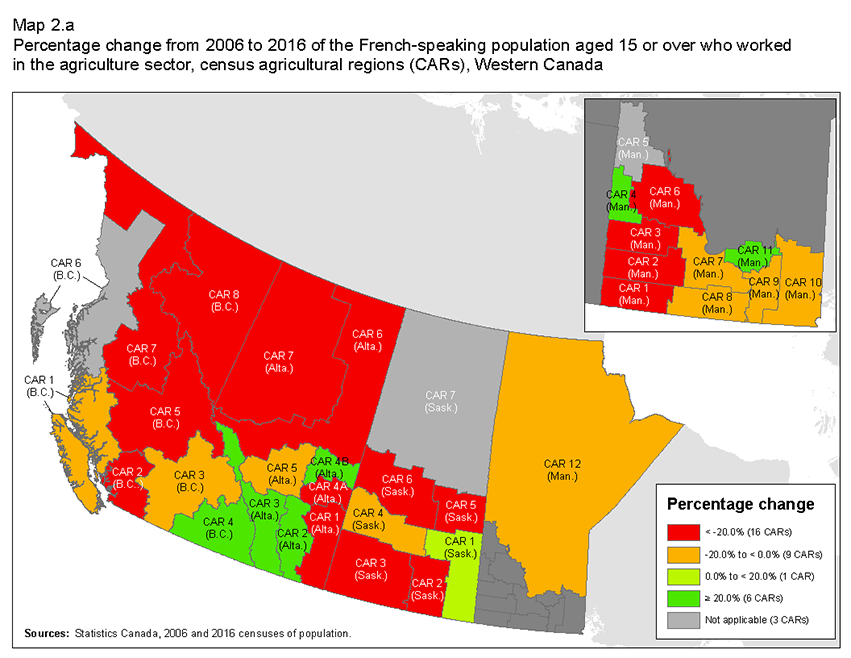
Description for Map 2.a
This map shows the percentage change from 2006 to 2016 of the French-speaking population aged 15 or over who worked in the agriculture sector, in each of Western Canada’s census agricultural regions.
On this map, five different colours are used to identify values. Grey represent census agricultural regions where the French-speaking population aged 15 or over who worked in the agriculture sector was too small to calculate its percentage change from 2006 to 2016. In this group, there are three census agricultural regions.
Red represents census agricultural regions where the French-speaking population aged 15 or over who worked in the agriculture sector decreased by more than 20% between 2006 and 2016. In this group, there are 16 census agricultural regions.
Orange represents census agricultural regions where the French-speaking population aged 15 or over who worked in the agriculture sector decreased by 20 % or less between 2006 and 2016. In this group, there are nine census agricultural regions.
Light green represents census agricultural regions where the French-speaking population aged 15 or over who worked in the agriculture sector increased by less than 20 % between 2006 and 2016. In this group, there is one census agricultural region.
Dark green represents census agricultural regions where the French-speaking population aged 15 or over who worked in the agriculture sector increased by 20% or more between 2006 and 2016. In this group, there are six census agricultural regions.
The borders of each census agricultural region are delineated by a grey line. Each census agricultural region is assigned a colour based on the table below.
| Census agricultural region | Percentage change |
|---|---|
| 4601 | -80.2 |
| 4602 | -43.9 |
| 4603 | -50.2 |
| 4604 | 71.8 |
| 4606 | -71.3 |
| 4607 | -19.0 |
| 4608 | -6.9 |
| 4609 | -13.5 |
| 4610 | -12.5 |
| 4611 | 65.2 |
| 4612 | -11.2 |
| 4701 | 8.4 |
| 4702 | -62.0 |
| 4703 | -29.1 |
| 4704 | -9.4 |
| 4705 | -36.4 |
| 4706 | -26.7 |
| 4801 | -62.1 |
| 4802 | 202.3 |
| 4803 | 92.3 |
| 4804A | -75.4 |
| 4804B | 109.2 |
| 4805 | -6.1 |
| 4806 | -38.7 |
| 4807 | -30.6 |
| 5901 | -16.0 |
| 5902 | -21.8 |
| 5903 | -17.5 |
| 5904 | 20.9 |
| 5905 | -34.0 |
| 5907 | -54.9 |
| 5908 | -89.5 |
Map 2.a shows that the number of Francophone agricultural workers decreased in 25 CARs in Western Canada between 2006 and 2016. In 16 CARs, the number of Francophone agricultural workers declined by more than 20%. Moreover, the number of Francophone agricultural workers grew over the decade in seven CARs, three of which were in Alberta.
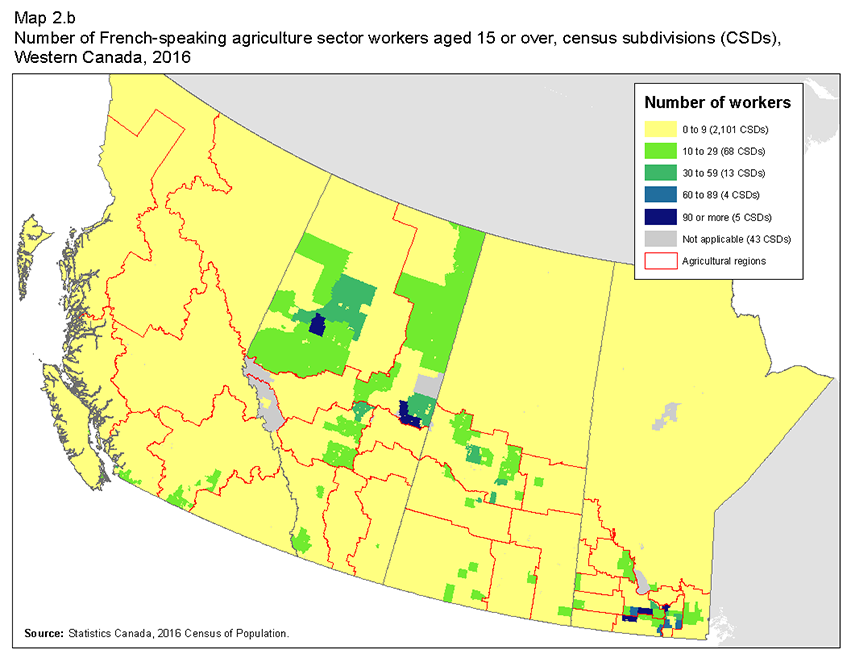
Description for Map 2.b
This map shows the number of French-speaking agriculture sector workers aged 15 or over in 2016 in each of Western Canada’s census subdivisions.
On this map, we use six different colours to identify values. Dark grey represents census subdivisions for which data is unavailable. In this group, there are 43 census subdivisions.
Yellow represents census subdivisions where there were between zero and nine French-speaking agriculture sector workers aged 15 or over in 2016. In this group, there are 2,101 census subdivisions.
Light green represents census subdivisions where there were between 10 and 29 French-speaking agriculture sector workers aged 15 or over in 2016. In this group, there are 68 census subdivisions.
Dark green represents census subdivisions where there were between 30 and 59 French-speaking agriculture sector workers aged 15 or over in 2016. In this group, there are 13 census subdivisions.
Light blue represents census subdivisions where there were between 60 and 89 French-speaking agriculture sector workers aged 15 or over in 2016. In this group, there are four census subdivisions.
Dark blue represents census subdivisions where there were 90 or more French-speaking agriculture sector workers aged 15 or over in 2016. In this group, there are five census subdivisions.
The borders of each census agricultural region are delineated by a red line. Each census subdivision is assigned a colour based on the table below.
| Census subdivision | Number of workers |
|---|---|
| 4819041 | 220 |
| 4604064 | 120 |
| 4609018 | 120 |
| 4812014 | 120 |
| 4611040 | 95 |
| 4602032 | 85 |
| 4603030 | 85 |
| 4602053 | 80 |
| 4608032 | 75 |
| 4715057 | 50 |
| 4811059 | 45 |
| 4602057 | 40 |
| 4711066 | 40 |
| 4812004 | 40 |
| 4819049 | 40 |
| 4602075 | 35 |
| 4610043 | 35 |
| 4716056 | 35 |
| 4811061 | 35 |
| 4817026 | 35 |
| 4715014 | 30 |
| 5915022 | 30 |
| 4602044 | 25 |
| 4806016 | 25 |
| 5909052 | 25 |
| 4603065 | 20 |
| 4703018 | 20 |
| 4714056 | 20 |
| 4715067 | 20 |
| 4715079 | 20 |
| 4715094 | 20 |
| 4808001 | 20 |
| 4811012 | 20 |
| 4813028 | 20 |
| 4819012 | 20 |
| 4819046 | 20 |
| 4819048 | 20 |
| 5907026 | 20 |
| 5909020 | 20 |
| 4602069 | 15 |
| 4603072 | 15 |
| 4617041 | 15 |
| 4701039 | 15 |
| 4703026 | 15 |
| 4703028 | 15 |
| 4703068 | 15 |
| 4715048 | 15 |
| 4715099 | 15 |
| 4716051 | 15 |
| 4803011 | 15 |
| 4818015 | 15 |
| 5907053 | 15 |
| 5917027 | 15 |
| 5935010 | 15 |
| 4601043 | 10 |
| 4602037 | 10 |
| 4603067 | 10 |
| 4606023 | 10 |
| 4608042 | 10 |
| 4610035 | 10 |
| 4615047 | 10 |
| 4617026 | 10 |
| 4618040 | 10 |
| 4701043 | 10 |
| 4703009 | 10 |
| 4703058 | 10 |
| 4703071 | 10 |
| 4706001 | 10 |
| 4707006 | 10 |
| 4712054 | 10 |
| 4712078 | 10 |
| 4714061 | 10 |
| 4715064 | 10 |
| 4717054 | 10 |
| 4801006 | 10 |
| 4808022 | 10 |
| 4811001 | 10 |
| 4813044 | 10 |
| 4816037 | 10 |
| 4817027 | 10 |
| 4817076 | 10 |
| 4819059 | 10 |
| 5907005 | 10 |
| 5907028 | 10 |
| 5907035 | 10 |
| 5915001 | 10 |
| 5915004 | 10 |
| 5915075 | 10 |
| 5926022 | 10 |
| 5937022 | 10 |
| 4601039 | 5 |
| 4602024 | 5 |
| 4602046 | 5 |
| 4605071 | 5 |
| 4607039 | 5 |
| 4607062 | 5 |
| 4609029 | 5 |
| 4610052 | 5 |
| 4613032 | 5 |
| 4613047 | 5 |
| 4614015 | 5 |
| 4616030 | 5 |
| 4701006 | 5 |
| 4701047 | 5 |
| 4701049 | 5 |
| 4701053 | 5 |
| 4703042 | 5 |
| 4703054 | 5 |
| 4704028 | 5 |
| 4705044 | 5 |
| 4706027 | 5 |
| 4707039 | 5 |
| 4709062 | 5 |
| 4712034 | 5 |
| 4713032 | 5 |
| 4715011 | 5 |
| 4715051 | 5 |
| 4715061 | 5 |
| 4715062 | 5 |
| 4715066 | 5 |
| 4716041 | 5 |
| 4716046 | 5 |
| 4716047 | 5 |
| 4717047 | 5 |
| 4717052 | 5 |
| 4802001 | 5 |
| 4802012 | 5 |
| 4805006 | 5 |
| 4805012 | 5 |
| 4805031 | 5 |
| 4806014 | 5 |
| 4808038 | 5 |
| 4809002 | 5 |
| 4811034 | 5 |
| 4811052 | 5 |
| 4812037 | 5 |
| 4813018 | 5 |
| 4813019 | 5 |
| 4819044 | 5 |
| 5903010 | 5 |
| 5903013 | 5 |
| 5903015 | 5 |
| 5907014 | 5 |
| 5907022 | 5 |
| 5907049 | 5 |
| 5907051 | 5 |
| 5915011 | 5 |
| 5915043 | 5 |
| 5915070 | 5 |
| 5917010 | 5 |
| 5924042 | 5 |
| 5927008 | 5 |
| 5931017 | 5 |
| 5931020 | 5 |
| 5935012 | 5 |
| 5935029 | 5 |
| 5937014 | 5 |
| 5937024 | 5 |
| 5953023 | 5 |
| 5953048 | 5 |
| 4601035 | 0 |
| 4601046 | 0 |
| 4601051 | 0 |
| 4601057 | 0 |
| 4601060 | 0 |
| 4601070 | 0 |
| 4601071 | 0 |
| 4601075 | 0 |
| 4601078 | 0 |
| 4601094 | 0 |
| 4602026 | 0 |
| 4602027 | 0 |
| 4602041 | 0 |
| 4602061 | 0 |
| 4603040 | 0 |
| 4603041 | 0 |
| 4603047 | 0 |
| 4603050 | 0 |
| 4603053 | 0 |
| 4603058 | 0 |
| 4603062 | 0 |
| 4603074 | 0 |
| 4604034 | 0 |
| 4604040 | 0 |
| 4604052 | 0 |
| 4604057 | 0 |
| 4604068 | 0 |
| 4605025 | 0 |
| 4605032 | 0 |
| 4605038 | 0 |
| 4605044 | 0 |
| 4605052 | 0 |
| 4605056 | 0 |
| 4605062 | 0 |
| 4606016 | 0 |
| 4606029 | 0 |
| 4606031 | 0 |
| 4606034 | 0 |
| 4606040 | 0 |
| 4607046 | 0 |
| 4607052 | 0 |
| 4607057 | 0 |
| 4607060 | 0 |
| 4607066 | 0 |
| 4607068 | 0 |
| 4607071 | 0 |
| 4607076 | 0 |
| 4608046 | 0 |
| 4608055 | 0 |
| 4608060 | 0 |
| 4608069 | 0 |
| 4609024 | 0 |
| 4609025 | 0 |
| 4609026 | 0 |
| 4609027 | 0 |
| 4611042 | 0 |
| 4612047 | 0 |
| 4612054 | 0 |
| 4612056 | 0 |
| 4613037 | 0 |
| 4613043 | 0 |
| 4613049 | 0 |
| 4613056 | 0 |
| 4613062 | 0 |
| 4614031 | 0 |
| 4614036 | 0 |
| 4614039 | 0 |
| 4614042 | 0 |
| 4615020 | 0 |
| 4615032 | 0 |
| 4615037 | 0 |
| 4615042 | 0 |
| 4615049 | 0 |
| 4615056 | 0 |
| 4615063 | 0 |
| 4615067 | 0 |
| 4615070 | 0 |
| 4615071 | 0 |
| 4615072 | 0 |
| 4615074 | 0 |
| 4615075 | 0 |
| 4615078 | 0 |
| 4615092 | 0 |
| 4616005 | 0 |
| 4616017 | 0 |
| 4616020 | 0 |
| 4616025 | 0 |
| 4616046 | 0 |
| 4616048 | 0 |
| 4617029 | 0 |
| 4617035 | 0 |
| 4617048 | 0 |
| 4617050 | 0 |
| 4617054 | 0 |
| 4617058 | 0 |
| 4617064 | 0 |
| 4617072 | 0 |
| 4617075 | 0 |
| 4617092 | 0 |
| 4618031 | 0 |
| 4618034 | 0 |
| 4618037 | 0 |
| 4618044 | 0 |
| 4618055 | 0 |
| 4618056 | 0 |
| 4618060 | 0 |
| 4618063 | 0 |
| 4618067 | 0 |
| 4618068 | 0 |
| 4618074 | 0 |
| 4618076 | 0 |
| 4618091 | 0 |
| 4619045 | 0 |
| 4619050 | 0 |
| 4619051 | 0 |
| 4619052 | 0 |
| 4619053 | 0 |
| 4619054 | 0 |
| 4619056 | 0 |
| 4619058 | 0 |
| 4619059 | 0 |
| 4619061 | 0 |
| 4619065 | 0 |
| 4619068 | 0 |
| 4619069 | 0 |
| 4619070 | 0 |
| 4619071 | 0 |
| 4619072 | 0 |
| 4619075 | 0 |
| 4619077 | 0 |
| 4619079 | 0 |
| 4619082 | 0 |
| 4620032 | 0 |
| 4620042 | 0 |
| 4620048 | 0 |
| 4620051 | 0 |
| 4620055 | 0 |
| 4620066 | 0 |
| 4620069 | 0 |
| 4621025 | 0 |
| 4621027 | 0 |
| 4621029 | 0 |
| 4621033 | 0 |
| 4621034 | 0 |
| 4621035 | 0 |
| 4621040 | 0 |
| 4621043 | 0 |
| 4621045 | 0 |
| 4621052 | 0 |
| 4621058 | 0 |
| 4621064 | 0 |
| 4621071 | 0 |
| 4621078 | 0 |
| 4622026 | 0 |
| 4622046 | 0 |
| 4622048 | 0 |
| 4622049 | 0 |
| 4622050 | 0 |
| 4622051 | 0 |
| 4622052 | 0 |
| 4622055 | 0 |
| 4622056 | 0 |
| 4622058 | 0 |
| 4622059 | 0 |
| 4622063 | 0 |
| 4622064 | 0 |
| 4622065 | 0 |
| 4622067 | 0 |
| 4622800 | 0 |
| 4622801 | 0 |
| 4623022 | 0 |
| 4623027 | 0 |
| 4623034 | 0 |
| 4623037 | 0 |
| 4623039 | 0 |
| 4623047 | 0 |
| 4623056 | 0 |
| 4623058 | 0 |
| 4623062 | 0 |
| 4623064 | 0 |
| 4623065 | 0 |
| 4623067 | 0 |
| 4623071 | 0 |
| 4701001 | 0 |
| 4701002 | 0 |
| 4701004 | 0 |
| 4701008 | 0 |
| 4701011 | 0 |
| 4701012 | 0 |
| 4701014 | 0 |
| 4701016 | 0 |
| 4701017 | 0 |
| 4701018 | 0 |
| 4701019 | 0 |
| 4701021 | 0 |
| 4701022 | 0 |
| 4701024 | 0 |
| 4701027 | 0 |
| 4701031 | 0 |
| 4701032 | 0 |
| 4701036 | 0 |
| 4701037 | 0 |
| 4701041 | 0 |
| 4701044 | 0 |
| 4701054 | 0 |
| 4701056 | 0 |
| 4701058 | 0 |
| 4701059 | 0 |
| 4701061 | 0 |
| 4701063 | 0 |
| 4701064 | 0 |
| 4701066 | 0 |
| 4701067 | 0 |
| 4701069 | 0 |
| 4701072 | 0 |
| 4701076 | 0 |
| 4701077 | 0 |
| 4701078 | 0 |
| 4701079 | 0 |
| 4701091 | 0 |
| 4701094 | 0 |
| 4701096 | 0 |
| 4701098 | 0 |
| 4701808 | 0 |
| 4701809 | 0 |
| 4701817 | 0 |
| 4701818 | 0 |
| 4701819 | 0 |
| 4702001 | 0 |
| 4702002 | 0 |
| 4702006 | 0 |
| 4702008 | 0 |
| 4702011 | 0 |
| 4702012 | 0 |
| 4702014 | 0 |
| 4702016 | 0 |
| 4702018 | 0 |
| 4702023 | 0 |
| 4702024 | 0 |
| 4702026 | 0 |
| 4702028 | 0 |
| 4702029 | 0 |
| 4702031 | 0 |
| 4702033 | 0 |
| 4702036 | 0 |
| 4702037 | 0 |
| 4702038 | 0 |
| 4702039 | 0 |
| 4702041 | 0 |
| 4702042 | 0 |
| 4702044 | 0 |
| 4702047 | 0 |
| 4702048 | 0 |
| 4702051 | 0 |
| 4702052 | 0 |
| 4702054 | 0 |
| 4702057 | 0 |
| 4702058 | 0 |
| 4702061 | 0 |
| 4702062 | 0 |
| 4702066 | 0 |
| 4702067 | 0 |
| 4702069 | 0 |
| 4702071 | 0 |
| 4702072 | 0 |
| 4702073 | 0 |
| 4702076 | 0 |
| 4702077 | 0 |
| 4702078 | 0 |
| 4702079 | 0 |
| 4703001 | 0 |
| 4703004 | 0 |
| 4703006 | 0 |
| 4703011 | 0 |
| 4703012 | 0 |
| 4703016 | 0 |
| 4703019 | 0 |
| 4703022 | 0 |
| 4703029 | 0 |
| 4703034 | 0 |
| 4703036 | 0 |
| 4703038 | 0 |
| 4703041 | 0 |
| 4703044 | 0 |
| 4703048 | 0 |
| 4703051 | 0 |
| 4703052 | 0 |
| 4703059 | 0 |
| 4703061 | 0 |
| 4703062 | 0 |
| 4703064 | 0 |
| 4703074 | 0 |
| 4703092 | 0 |
| 4703093 | 0 |
| 4703096 | 0 |
| 4703801 | 0 |
| 4704002 | 0 |
| 4704003 | 0 |
| 4704006 | 0 |
| 4704008 | 0 |
| 4704009 | 0 |
| 4704011 | 0 |
| 4704012 | 0 |
| 4704019 | 0 |
| 4704021 | 0 |
| 4704024 | 0 |
| 4704026 | 0 |
| 4704029 | 0 |
| 4704034 | 0 |
| 4704036 | 0 |
| 4704038 | 0 |
| 4704045 | 0 |
| 4704048 | 0 |
| 4704050 | 0 |
| 4704054 | 0 |
| 4704056 | 0 |
| 4704058 | 0 |
| 4704061 | 0 |
| 4704802 | 0 |
| 4705001 | 0 |
| 4705002 | 0 |
| 4705004 | 0 |
| 4705006 | 0 |
| 4705007 | 0 |
| 4705009 | 0 |
| 4705011 | 0 |
| 4705014 | 0 |
| 4705016 | 0 |
| 4705018 | 0 |
| 4705019 | 0 |
| 4705021 | 0 |
| 4705024 | 0 |
| 4705027 | 0 |
| 4705028 | 0 |
| 4705029 | 0 |
| 4705031 | 0 |
| 4705033 | 0 |
| 4705034 | 0 |
| 4705037 | 0 |
| 4705038 | 0 |
| 4705041 | 0 |
| 4705042 | 0 |
| 4705043 | 0 |
| 4705047 | 0 |
| 4705048 | 0 |
| 4705049 | 0 |
| 4705051 | 0 |
| 4705052 | 0 |
| 4705053 | 0 |
| 4705054 | 0 |
| 4705055 | 0 |
| 4705056 | 0 |
| 4705057 | 0 |
| 4705058 | 0 |
| 4705059 | 0 |
| 4705061 | 0 |
| 4705062 | 0 |
| 4705063 | 0 |
| 4705064 | 0 |
| 4705066 | 0 |
| 4705067 | 0 |
| 4705068 | 0 |
| 4705069 | 0 |
| 4705071 | 0 |
| 4705073 | 0 |
| 4705074 | 0 |
| 4705077 | 0 |
| 4705078 | 0 |
| 4705079 | 0 |
| 4705093 | 0 |
| 4705094 | 0 |
| 4705096 | 0 |
| 4705803 | 0 |
| 4705804 | 0 |
| 4705805 | 0 |
| 4705806 | 0 |
| 4705807 | 0 |
| 4705808 | 0 |
| 4706002 | 0 |
| 4706003 | 0 |
| 4706004 | 0 |
| 4706006 | 0 |
| 4706007 | 0 |
| 4706008 | 0 |
| 4706009 | 0 |
| 4706011 | 0 |
| 4706013 | 0 |
| 4706014 | 0 |
| 4706016 | 0 |
| 4706017 | 0 |
| 4706018 | 0 |
| 4706019 | 0 |
| 4706021 | 0 |
| 4706022 | 0 |
| 4706023 | 0 |
| 4706026 | 0 |
| 4706028 | 0 |
| 4706029 | 0 |
| 4706030 | 0 |
| 4706031 | 0 |
| 4706032 | 0 |
| 4706033 | 0 |
| 4706034 | 0 |
| 4706036 | 0 |
| 4706037 | 0 |
| 4706038 | 0 |
| 4706039 | 0 |
| 4706041 | 0 |
| 4706042 | 0 |
| 4706045 | 0 |
| 4706046 | 0 |
| 4706047 | 0 |
| 4706048 | 0 |
| 4706049 | 0 |
| 4706050 | 0 |
| 4706051 | 0 |
| 4706052 | 0 |
| 4706053 | 0 |
| 4706054 | 0 |
| 4706055 | 0 |
| 4706056 | 0 |
| 4706058 | 0 |
| 4706059 | 0 |
| 4706060 | 0 |
| 4706061 | 0 |
| 4706062 | 0 |
| 4706063 | 0 |
| 4706064 | 0 |
| 4706065 | 0 |
| 4706067 | 0 |
| 4706068 | 0 |
| 4706069 | 0 |
| 4706070 | 0 |
| 4706071 | 0 |
| 4706072 | 0 |
| 4706073 | 0 |
| 4706074 | 0 |
| 4706075 | 0 |
| 4706076 | 0 |
| 4706077 | 0 |
| 4706078 | 0 |
| 4706079 | 0 |
| 4706080 | 0 |
| 4706081 | 0 |
| 4706082 | 0 |
| 4706085 | 0 |
| 4706091 | 0 |
| 4706092 | 0 |
| 4706093 | 0 |
| 4706094 | 0 |
| 4706096 | 0 |
| 4706097 | 0 |
| 4706098 | 0 |
| 4706099 | 0 |
| 4706809 | 0 |
| 4706810 | 0 |
| 4706811 | 0 |
| 4706812 | 0 |
| 4706813 | 0 |
| 4706814 | 0 |
| 4706815 | 0 |
| 4706816 | 0 |
| 4706818 | 0 |
| 4706820 | 0 |
| 4706828 | 0 |
| 4706829 | 0 |
| 4707001 | 0 |
| 4707004 | 0 |
| 4707008 | 0 |
| 4707011 | 0 |
| 4707012 | 0 |
| 4707014 | 0 |
| 4707016 | 0 |
| 4707018 | 0 |
| 4707020 | 0 |
| 4707021 | 0 |
| 4707022 | 0 |
| 4707023 | 0 |
| 4707024 | 0 |
| 4707026 | 0 |
| 4707027 | 0 |
| 4707028 | 0 |
| 4707029 | 0 |
| 4707031 | 0 |
| 4707032 | 0 |
| 4707034 | 0 |
| 4707036 | 0 |
| 4707037 | 0 |
| 4707038 | 0 |
| 4707042 | 0 |
| 4707043 | 0 |
| 4707044 | 0 |
| 4707045 | 0 |
| 4707046 | 0 |
| 4707047 | 0 |
| 4707048 | 0 |
| 4707049 | 0 |
| 4707051 | 0 |
| 4707053 | 0 |
| 4707054 | 0 |
| 4707058 | 0 |
| 4707059 | 0 |
| 4707062 | 0 |
| 4707063 | 0 |
| 4707066 | 0 |
| 4707067 | 0 |
| 4707068 | 0 |
| 4707071 | 0 |
| 4707072 | 0 |
| 4707074 | 0 |
| 4707076 | 0 |
| 4707077 | 0 |
| 4707091 | 0 |
| 4707092 | 0 |
| 4707093 | 0 |
| 4708001 | 0 |
| 4708004 | 0 |
| 4708006 | 0 |
| 4708008 | 0 |
| 4708009 | 0 |
| 4708011 | 0 |
| 4708012 | 0 |
| 4708016 | 0 |
| 4708018 | 0 |
| 4708021 | 0 |
| 4708022 | 0 |
| 4708024 | 0 |
| 4708026 | 0 |
| 4708028 | 0 |
| 4708029 | 0 |
| 4708031 | 0 |
| 4708032 | 0 |
| 4708034 | 0 |
| 4708036 | 0 |
| 4708038 | 0 |
| 4708039 | 0 |
| 4708042 | 0 |
| 4708044 | 0 |
| 4708046 | 0 |
| 4708048 | 0 |
| 4708049 | 0 |
| 4708053 | 0 |
| 4708054 | 0 |
| 4708056 | 0 |
| 4708057 | 0 |
| 4708058 | 0 |
| 4708059 | 0 |
| 4708061 | 0 |
| 4708062 | 0 |
| 4708065 | 0 |
| 4708068 | 0 |
| 4708071 | 0 |
| 4708074 | 0 |
| 4708076 | 0 |
| 4708092 | 0 |
| 4708094 | 0 |
| 4709001 | 0 |
| 4709002 | 0 |
| 4709006 | 0 |
| 4709009 | 0 |
| 4709011 | 0 |
| 4709012 | 0 |
| 4709014 | 0 |
| 4709016 | 0 |
| 4709019 | 0 |
| 4709023 | 0 |
| 4709024 | 0 |
| 4709028 | 0 |
| 4709029 | 0 |
| 4709032 | 0 |
| 4709033 | 0 |
| 4709037 | 0 |
| 4709038 | 0 |
| 4709039 | 0 |
| 4709042 | 0 |
| 4709044 | 0 |
| 4709046 | 0 |
| 4709049 | 0 |
| 4709053 | 0 |
| 4709054 | 0 |
| 4709056 | 0 |
| 4709058 | 0 |
| 4709060 | 0 |
| 4709061 | 0 |
| 4709064 | 0 |
| 4709065 | 0 |
| 4709066 | 0 |
| 4709067 | 0 |
| 4709069 | 0 |
| 4709071 | 0 |
| 4709072 | 0 |
| 4709075 | 0 |
| 4709076 | 0 |
| 4709819 | 0 |
| 4709820 | 0 |
| 4709821 | 0 |
| 4709822 | 0 |
| 4709832 | 0 |
| 4710002 | 0 |
| 4710003 | 0 |
| 4710004 | 0 |
| 4710008 | 0 |
| 4710009 | 0 |
| 4710011 | 0 |
| 4710012 | 0 |
| 4710014 | 0 |
| 4710022 | 0 |
| 4710024 | 0 |
| 4710027 | 0 |
| 4710028 | 0 |
| 4710029 | 0 |
| 4710031 | 0 |
| 4710035 | 0 |
| 4710036 | 0 |
| 4710038 | 0 |
| 4710041 | 0 |
| 4710043 | 0 |
| 4710046 | 0 |
| 4710047 | 0 |
| 4710052 | 0 |
| 4710054 | 0 |
| 4710056 | 0 |
| 4710058 | 0 |
| 4710061 | 0 |
| 4710062 | 0 |
| 4710064 | 0 |
| 4710066 | 0 |
| 4710068 | 0 |
| 4710071 | 0 |
| 4710072 | 0 |
| 4710822 | 0 |
| 4710823 | 0 |
| 4710824 | 0 |
| 4710825 | 0 |
| 4710826 | 0 |
| 4710828 | 0 |
| 4710836 | 0 |
| 4710838 | 0 |
| 4710840 | 0 |
| 4710849 | 0 |
| 4711002 | 0 |
| 4711003 | 0 |
| 4711004 | 0 |
| 4711006 | 0 |
| 4711007 | 0 |
| 4711008 | 0 |
| 4711009 | 0 |
| 4711011 | 0 |
| 4711014 | 0 |
| 4711016 | 0 |
| 4711018 | 0 |
| 4711019 | 0 |
| 4711021 | 0 |
| 4711022 | 0 |
| 4711024 | 0 |
| 4711026 | 0 |
| 4711027 | 0 |
| 4711028 | 0 |
| 4711029 | 0 |
| 4711031 | 0 |
| 4711032 | 0 |
| 4711034 | 0 |
| 4711036 | 0 |
| 4711038 | 0 |
| 4711039 | 0 |
| 4711041 | 0 |
| 4711042 | 0 |
| 4711044 | 0 |
| 4711046 | 0 |
| 4711048 | 0 |
| 4711049 | 0 |
| 4711052 | 0 |
| 4711053 | 0 |
| 4711054 | 0 |
| 4711056 | 0 |
| 4711058 | 0 |
| 4711059 | 0 |
| 4711060 | 0 |
| 4711061 | 0 |
| 4711063 | 0 |
| 4711064 | 0 |
| 4711065 | 0 |
| 4711067 | 0 |
| 4711068 | 0 |
| 4711069 | 0 |
| 4711070 | 0 |
| 4711071 | 0 |
| 4711072 | 0 |
| 4711073 | 0 |
| 4711075 | 0 |
| 4711076 | 0 |
| 4711077 | 0 |
| 4711078 | 0 |
| 4711079 | 0 |
| 4711091 | 0 |
| 4711092 | 0 |
| 4711094 | 0 |
| 4711096 | 0 |
| 4711828 | 0 |
| 4712001 | 0 |
| 4712004 | 0 |
| 4712006 | 0 |
| 4712008 | 0 |
| 4712011 | 0 |
| 4712012 | 0 |
| 4712014 | 0 |
| 4712016 | 0 |
| 4712019 | 0 |
| 4712020 | 0 |
| 4712022 | 0 |
| 4712026 | 0 |
| 4712029 | 0 |
| 4712031 | 0 |
| 4712032 | 0 |
| 4712038 | 0 |
| 4712042 | 0 |
| 4712046 | 0 |
| 4712050 | 0 |
| 4712051 | 0 |
| 4712052 | 0 |
| 4712056 | 0 |
| 4712058 | 0 |
| 4712059 | 0 |
| 4712064 | 0 |
| 4712069 | 0 |
| 4712072 | 0 |
| 4712079 | 0 |
| 4712829 | 0 |
| 4712830 | 0 |
| 4712832 | 0 |
| 4712833 | 0 |
| 4712837 | 0 |
| 4713002 | 0 |
| 4713004 | 0 |
| 4713006 | 0 |
| 4713008 | 0 |
| 4713009 | 0 |
| 4713011 | 0 |
| 4713014 | 0 |
| 4713016 | 0 |
| 4713019 | 0 |
| 4713021 | 0 |
| 4713022 | 0 |
| 4713024 | 0 |
| 4713026 | 0 |
| 4713028 | 0 |
| 4713029 | 0 |
| 4713031 | 0 |
| 4713038 | 0 |
| 4713039 | 0 |
| 4713041 | 0 |
| 4713042 | 0 |
| 4713044 | 0 |
| 4713046 | 0 |
| 4713049 | 0 |
| 4713051 | 0 |
| 4713053 | 0 |
| 4713054 | 0 |
| 4713056 | 0 |
| 4713059 | 0 |
| 4713062 | 0 |
| 4713064 | 0 |
| 4713067 | 0 |
| 4713068 | 0 |
| 4713069 | 0 |
| 4713072 | 0 |
| 4713074 | 0 |
| 4713076 | 0 |
| 4713078 | 0 |
| 4713079 | 0 |
| 4713091 | 0 |
| 4713092 | 0 |
| 4713094 | 0 |
| 4713096 | 0 |
| 4713098 | 0 |
| 4713835 | 0 |
| 4713836 | 0 |
| 4714001 | 0 |
| 4714004 | 0 |
| 4714006 | 0 |
| 4714007 | 0 |
| 4714009 | 0 |
| 4714021 | 0 |
| 4714022 | 0 |
| 4714023 | 0 |
| 4714024 | 0 |
| 4714025 | 0 |
| 4714026 | 0 |
| 4714028 | 0 |
| 4714030 | 0 |
| 4714032 | 0 |
| 4714034 | 0 |
| 4714035 | 0 |
| 4714036 | 0 |
| 4714038 | 0 |
| 4714039 | 0 |
| 4714041 | 0 |
| 4714043 | 0 |
| 4714044 | 0 |
| 4714047 | 0 |
| 4714048 | 0 |
| 4714049 | 0 |
| 4714051 | 0 |
| 4714053 | 0 |
| 4714058 | 0 |
| 4714059 | 0 |
| 4714062 | 0 |
| 4714067 | 0 |
| 4714068 | 0 |
| 4714069 | 0 |
| 4714072 | 0 |
| 4714073 | 0 |
| 4714074 | 0 |
| 4714076 | 0 |
| 4714077 | 0 |
| 4714079 | 0 |
| 4714091 | 0 |
| 4714092 | 0 |
| 4714093 | 0 |
| 4714839 | 0 |
| 4714840 | 0 |
| 4714841 | 0 |
| 4714842 | 0 |
| 4714843 | 0 |
| 4714845 | 0 |
| 4715001 | 0 |
| 4715002 | 0 |
| 4715003 | 0 |
| 4715004 | 0 |
| 4715005 | 0 |
| 4715006 | 0 |
| 4715007 | 0 |
| 4715008 | 0 |
| 4715012 | 0 |
| 4715016 | 0 |
| 4715017 | 0 |
| 4715018 | 0 |
| 4715019 | 0 |
| 4715026 | 0 |
| 4715027 | 0 |
| 4715028 | 0 |
| 4715029 | 0 |
| 4715031 | 0 |
| 4715032 | 0 |
| 4715034 | 0 |
| 4715036 | 0 |
| 4715038 | 0 |
| 4715039 | 0 |
| 4715041 | 0 |
| 4715042 | 0 |
| 4715043 | 0 |
| 4715044 | 0 |
| 4715045 | 0 |
| 4715046 | 0 |
| 4715047 | 0 |
| 4715049 | 0 |
| 4715052 | 0 |
| 4715054 | 0 |
| 4715059 | 0 |
| 4715068 | 0 |
| 4715070 | 0 |
| 4715071 | 0 |
| 4715072 | 0 |
| 4715074 | 0 |
| 4715075 | 0 |
| 4715076 | 0 |
| 4715085 | 0 |
| 4715091 | 0 |
| 4715092 | 0 |
| 4715098 | 0 |
| 4715844 | 0 |
| 4715845 | 0 |
| 4715847 | 0 |
| 4715848 | 0 |
| 4715849 | 0 |
| 4715850 | 0 |
| 4715851 | 0 |
| 4715853 | 0 |
| 4715857 | 0 |
| 4715859 | 0 |
| 4715862 | 0 |
| 4716002 | 0 |
| 4716003 | 0 |
| 4716004 | 0 |
| 4716005 | 0 |
| 4716008 | 0 |
| 4716009 | 0 |
| 4716011 | 0 |
| 4716013 | 0 |
| 4716014 | 0 |
| 4716016 | 0 |
| 4716018 | 0 |
| 4716019 | 0 |
| 4716022 | 0 |
| 4716023 | 0 |
| 4716024 | 0 |
| 4716026 | 0 |
| 4716027 | 0 |
| 4716028 | 0 |
| 4716029 | 0 |
| 4716033 | 0 |
| 4716038 | 0 |
| 4716042 | 0 |
| 4716043 | 0 |
| 4716044 | 0 |
| 4716052 | 0 |
| 4716053 | 0 |
| 4716054 | 0 |
| 4716057 | 0 |
| 4716058 | 0 |
| 4716059 | 0 |
| 4716060 | 0 |
| 4716061 | 0 |
| 4716062 | 0 |
| 4716063 | 0 |
| 4716072 | 0 |
| 4716075 | 0 |
| 4716077 | 0 |
| 4716854 | 0 |
| 4716855 | 0 |
| 4716856 | 0 |
| 4716857 | 0 |
| 4716858 | 0 |
| 4716860 | 0 |
| 4716861 | 0 |
| 4716862 | 0 |
| 4716863 | 0 |
| 4716880 | 0 |
| 4716882 | 0 |
| 4716888 | 0 |
| 4716894 | 0 |
| 4717001 | 0 |
| 4717002 | 0 |
| 4717004 | 0 |
| 4717005 | 0 |
| 4717006 | 0 |
| 4717008 | 0 |
| 4717011 | 0 |
| 4717013 | 0 |
| 4717014 | 0 |
| 4717017 | 0 |
| 4717018 | 0 |
| 4717019 | 0 |
| 4717022 | 0 |
| 4717024 | 0 |
| 4717026 | 0 |
| 4717028 | 0 |
| 4717029 | 0 |
| 4717032 | 0 |
| 4717034 | 0 |
| 4717036 | 0 |
| 4717039 | 0 |
| 4717041 | 0 |
| 4717042 | 0 |
| 4717045 | 0 |
| 4717048 | 0 |
| 4717055 | 0 |
| 4717056 | 0 |
| 4717057 | 0 |
| 4717058 | 0 |
| 4717062 | 0 |
| 4717066 | 0 |
| 4717067 | 0 |
| 4717801 | 0 |
| 4717802 | 0 |
| 4717803 | 0 |
| 4717804 | 0 |
| 4717805 | 0 |
| 4717806 | 0 |
| 4717807 | 0 |
| 4717808 | 0 |
| 4717809 | 0 |
| 4717810 | 0 |
| 4717811 | 0 |
| 4717812 | 0 |
| 4717813 | 0 |
| 4717815 | 0 |
| 4717816 | 0 |
| 4718005 | 0 |
| 4718012 | 0 |
| 4718015 | 0 |
| 4718021 | 0 |
| 4718023 | 0 |
| 4718028 | 0 |
| 4718030 | 0 |
| 4718033 | 0 |
| 4718041 | 0 |
| 4718042 | 0 |
| 4718049 | 0 |
| 4718051 | 0 |
| 4718052 | 0 |
| 4718055 | 0 |
| 4718058 | 0 |
| 4718062 | 0 |
| 4718065 | 0 |
| 4718067 | 0 |
| 4718069 | 0 |
| 4718070 | 0 |
| 4718071 | 0 |
| 4718072 | 0 |
| 4718074 | 0 |
| 4718075 | 0 |
| 4718090 | 0 |
| 4718100 | 0 |
| 4718801 | 0 |
| 4718802 | 0 |
| 4718803 | 0 |
| 4718806 | 0 |
| 4718807 | 0 |
| 4718808 | 0 |
| 4718809 | 0 |
| 4718811 | 0 |
| 4718812 | 0 |
| 4718814 | 0 |
| 4718817 | 0 |
| 4718818 | 0 |
| 4718819 | 0 |
| 4718820 | 0 |
| 4718821 | 0 |
| 4718822 | 0 |
| 4718824 | 0 |
| 4718825 | 0 |
| 4718826 | 0 |
| 4718828 | 0 |
| 4718829 | 0 |
| 4718831 | 0 |
| 4718832 | 0 |
| 4718839 | 0 |
| 4718852 | 0 |
| 4718854 | 0 |
| 4801003 | 0 |
| 4801008 | 0 |
| 4801009 | 0 |
| 4801014 | 0 |
| 4801018 | 0 |
| 4802002 | 0 |
| 4802004 | 0 |
| 4802006 | 0 |
| 4802008 | 0 |
| 4802009 | 0 |
| 4802011 | 0 |
| 4802013 | 0 |
| 4802014 | 0 |
| 4802016 | 0 |
| 4802018 | 0 |
| 4802019 | 0 |
| 4802021 | 0 |
| 4802022 | 0 |
| 4802023 | 0 |
| 4802029 | 0 |
| 4802031 | 0 |
| 4802034 | 0 |
| 4802036 | 0 |
| 4802038 | 0 |
| 4802039 | 0 |
| 4803001 | 0 |
| 4803002 | 0 |
| 4803003 | 0 |
| 4803004 | 0 |
| 4803006 | 0 |
| 4803008 | 0 |
| 4803014 | 0 |
| 4803016 | 0 |
| 4803018 | 0 |
| 4803019 | 0 |
| 4803021 | 0 |
| 4803022 | 0 |
| 4803024 | 0 |
| 4803026 | 0 |
| 4803801 | 0 |
| 4803802 | 0 |
| 4804001 | 0 |
| 4804004 | 0 |
| 4804006 | 0 |
| 4804011 | 0 |
| 4804012 | 0 |
| 4804014 | 0 |
| 4804016 | 0 |
| 4804019 | 0 |
| 4804020 | 0 |
| 4804021 | 0 |
| 4804022 | 0 |
| 4805001 | 0 |
| 4805002 | 0 |
| 4805004 | 0 |
| 4805008 | 0 |
| 4805009 | 0 |
| 4805011 | 0 |
| 4805018 | 0 |
| 4805019 | 0 |
| 4805021 | 0 |
| 4805022 | 0 |
| 4805026 | 0 |
| 4805034 | 0 |
| 4805036 | 0 |
| 4805038 | 0 |
| 4805041 | 0 |
| 4805042 | 0 |
| 4805044 | 0 |
| 4805046 | 0 |
| 4805048 | 0 |
| 4805049 | 0 |
| 4805802 | 0 |
| 4806001 | 0 |
| 4806006 | 0 |
| 4806008 | 0 |
| 4806009 | 0 |
| 4806011 | 0 |
| 4806012 | 0 |
| 4806017 | 0 |
| 4806019 | 0 |
| 4806021 | 0 |
| 4806022 | 0 |
| 4806024 | 0 |
| 4806026 | 0 |
| 4806028 | 0 |
| 4806029 | 0 |
| 4806031 | 0 |
| 4806032 | 0 |
| 4806034 | 0 |
| 4806036 | 0 |
| 4806803 | 0 |
| 4806804 | 0 |
| 4807001 | 0 |
| 4807002 | 0 |
| 4807004 | 0 |
| 4807006 | 0 |
| 4807008 | 0 |
| 4807011 | 0 |
| 4807012 | 0 |
| 4807014 | 0 |
| 4807016 | 0 |
| 4807019 | 0 |
| 4807021 | 0 |
| 4807022 | 0 |
| 4807024 | 0 |
| 4807026 | 0 |
| 4807027 | 0 |
| 4807028 | 0 |
| 4807029 | 0 |
| 4807031 | 0 |
| 4807032 | 0 |
| 4807036 | 0 |
| 4807038 | 0 |
| 4807039 | 0 |
| 4807042 | 0 |
| 4807044 | 0 |
| 4807046 | 0 |
| 4807048 | 0 |
| 4807049 | 0 |
| 4807051 | 0 |
| 4807052 | 0 |
| 4807054 | 0 |
| 4807056 | 0 |
| 4808002 | 0 |
| 4808004 | 0 |
| 4808005 | 0 |
| 4808006 | 0 |
| 4808008 | 0 |
| 4808009 | 0 |
| 4808011 | 0 |
| 4808012 | 0 |
| 4808013 | 0 |
| 4808023 | 0 |
| 4808024 | 0 |
| 4808025 | 0 |
| 4808026 | 0 |
| 4808027 | 0 |
| 4808028 | 0 |
| 4808029 | 0 |
| 4808031 | 0 |
| 4808032 | 0 |
| 4808034 | 0 |
| 4808039 | 0 |
| 4808042 | 0 |
| 4808044 | 0 |
| 4808811 | 0 |
| 4808812 | 0 |
| 4808813 | 0 |
| 4809010 | 0 |
| 4809015 | 0 |
| 4809806 | 0 |
| 4809809 | 0 |
| 4809810 | 0 |
| 4810001 | 0 |
| 4810002 | 0 |
| 4810003 | 0 |
| 4810004 | 0 |
| 4810006 | 0 |
| 4810009 | 0 |
| 4810011 | 0 |
| 4810012 | 0 |
| 4810014 | 0 |
| 4810016 | 0 |
| 4810018 | 0 |
| 4810019 | 0 |
| 4810021 | 0 |
| 4810022 | 0 |
| 4810026 | 0 |
| 4810028 | 0 |
| 4810031 | 0 |
| 4810034 | 0 |
| 4810036 | 0 |
| 4810038 | 0 |
| 4810039 | 0 |
| 4810041 | 0 |
| 4810042 | 0 |
| 4810044 | 0 |
| 4810046 | 0 |
| 4810048 | 0 |
| 4810051 | 0 |
| 4810052 | 0 |
| 4810056 | 0 |
| 4810058 | 0 |
| 4810059 | 0 |
| 4810061 | 0 |
| 4810062 | 0 |
| 4810064 | 0 |
| 4810066 | 0 |
| 4810805 | 0 |
| 4811002 | 0 |
| 4811003 | 0 |
| 4811004 | 0 |
| 4811005 | 0 |
| 4811006 | 0 |
| 4811007 | 0 |
| 4811008 | 0 |
| 4811009 | 0 |
| 4811011 | 0 |
| 4811013 | 0 |
| 4811016 | 0 |
| 4811018 | 0 |
| 4811019 | 0 |
| 4811020 | 0 |
| 4811021 | 0 |
| 4811022 | 0 |
| 4811023 | 0 |
| 4811024 | 0 |
| 4811026 | 0 |
| 4811031 | 0 |
| 4811032 | 0 |
| 4811038 | 0 |
| 4811039 | 0 |
| 4811041 | 0 |
| 4811042 | 0 |
| 4811045 | 0 |
| 4811046 | 0 |
| 4811048 | 0 |
| 4811049 | 0 |
| 4811056 | 0 |
| 4811062 | 0 |
| 4811064 | 0 |
| 4811065 | 0 |
| 4811066 | 0 |
| 4811068 | 0 |
| 4811069 | 0 |
| 4811801 | 0 |
| 4811802 | 0 |
| 4811803 | 0 |
| 4811804 | 0 |
| 4811805 | 0 |
| 4811806 | 0 |
| 4811807 | 0 |
| 4812002 | 0 |
| 4812009 | 0 |
| 4812011 | 0 |
| 4812012 | 0 |
| 4812013 | 0 |
| 4812016 | 0 |
| 4812018 | 0 |
| 4812020 | 0 |
| 4812022 | 0 |
| 4812024 | 0 |
| 4812026 | 0 |
| 4812029 | 0 |
| 4812802 | 0 |
| 4812804 | 0 |
| 4812808 | 0 |
| 4812810 | 0 |
| 4812811 | 0 |
| 4812813 | 0 |
| 4812815 | 0 |
| 4812828 | 0 |
| 4812840 | 0 |
| 4813001 | 0 |
| 4813002 | 0 |
| 4813003 | 0 |
| 4813005 | 0 |
| 4813006 | 0 |
| 4813007 | 0 |
| 4813008 | 0 |
| 4813010 | 0 |
| 4813011 | 0 |
| 4813012 | 0 |
| 4813013 | 0 |
| 4813014 | 0 |
| 4813015 | 0 |
| 4813016 | 0 |
| 4813017 | 0 |
| 4813029 | 0 |
| 4813030 | 0 |
| 4813031 | 0 |
| 4813032 | 0 |
| 4813033 | 0 |
| 4813036 | 0 |
| 4813045 | 0 |
| 4813046 | 0 |
| 4813047 | 0 |
| 4813048 | 0 |
| 4813049 | 0 |
| 4813051 | 0 |
| 4813053 | 0 |
| 4813055 | 0 |
| 4813057 | 0 |
| 4813061 | 0 |
| 4813811 | 0 |
| 4814003 | 0 |
| 4814019 | 0 |
| 4814024 | 0 |
| 4815007 | 0 |
| 4815013 | 0 |
| 4815015 | 0 |
| 4815023 | 0 |
| 4815027 | 0 |
| 4815030 | 0 |
| 4815032 | 0 |
| 4815033 | 0 |
| 4815035 | 0 |
| 4815045 | 0 |
| 4815802 | 0 |
| 4816051 | 0 |
| 4816817 | 0 |
| 4816821 | 0 |
| 4816822 | 0 |
| 4816850 | 0 |
| 4816852 | 0 |
| 4816859 | 0 |
| 4816860 | 0 |
| 4816861 | 0 |
| 4817021 | 0 |
| 4817024 | 0 |
| 4817029 | 0 |
| 4817031 | 0 |
| 4817033 | 0 |
| 4817039 | 0 |
| 4817062 | 0 |
| 4817064 | 0 |
| 4817078 | 0 |
| 4817093 | 0 |
| 4817095 | 0 |
| 4817097 | 0 |
| 4817817 | 0 |
| 4817818 | 0 |
| 4817819 | 0 |
| 4817821 | 0 |
| 4817822 | 0 |
| 4817823 | 0 |
| 4817824 | 0 |
| 4817825 | 0 |
| 4817827 | 0 |
| 4817828 | 0 |
| 4817829 | 0 |
| 4817830 | 0 |
| 4817831 | 0 |
| 4817832 | 0 |
| 4817833 | 0 |
| 4817835 | 0 |
| 4817836 | 0 |
| 4817837 | 0 |
| 4817838 | 0 |
| 4817840 | 0 |
| 4817841 | 0 |
| 4817842 | 0 |
| 4817843 | 0 |
| 4817845 | 0 |
| 4817848 | 0 |
| 4817849 | 0 |
| 4817853 | 0 |
| 4817855 | 0 |
| 4817856 | 0 |
| 4817857 | 0 |
| 4817859 | 0 |
| 4817860 | 0 |
| 4818002 | 0 |
| 4818005 | 0 |
| 4818018 | 0 |
| 4818816 | 0 |
| 4818818 | 0 |
| 4819006 | 0 |
| 4819008 | 0 |
| 4819009 | 0 |
| 4819011 | 0 |
| 4819014 | 0 |
| 4819038 | 0 |
| 4819042 | 0 |
| 4819054 | 0 |
| 4819056 | 0 |
| 4819058 | 0 |
| 4819066 | 0 |
| 4819068 | 0 |
| 4819071 | 0 |
| 4819072 | 0 |
| 4819074 | 0 |
| 4819815 | 0 |
| 4819826 | 0 |
| 5901003 | 0 |
| 5901006 | 0 |
| 5901012 | 0 |
| 5901017 | 0 |
| 5901019 | 0 |
| 5901022 | 0 |
| 5901028 | 0 |
| 5901035 | 0 |
| 5901037 | 0 |
| 5901039 | 0 |
| 5901040 | 0 |
| 5901043 | 0 |
| 5901046 | 0 |
| 5901048 | 0 |
| 5901801 | 0 |
| 5901803 | 0 |
| 5901804 | 0 |
| 5901805 | 0 |
| 5901806 | 0 |
| 5903004 | 0 |
| 5903011 | 0 |
| 5903017 | 0 |
| 5903019 | 0 |
| 5903023 | 0 |
| 5903027 | 0 |
| 5903032 | 0 |
| 5903039 | 0 |
| 5903041 | 0 |
| 5903043 | 0 |
| 5903045 | 0 |
| 5903047 | 0 |
| 5903050 | 0 |
| 5903052 | 0 |
| 5903056 | 0 |
| 5903058 | 0 |
| 5903060 | 0 |
| 5903807 | 0 |
| 5905005 | 0 |
| 5905009 | 0 |
| 5905014 | 0 |
| 5905018 | 0 |
| 5905023 | 0 |
| 5905026 | 0 |
| 5905030 | 0 |
| 5905032 | 0 |
| 5905037 | 0 |
| 5905042 | 0 |
| 5905050 | 0 |
| 5905052 | 0 |
| 5905054 | 0 |
| 5907009 | 0 |
| 5907024 | 0 |
| 5907041 | 0 |
| 5907047 | 0 |
| 5907055 | 0 |
| 5907801 | 0 |
| 5907802 | 0 |
| 5907803 | 0 |
| 5907805 | 0 |
| 5907806 | 0 |
| 5907807 | 0 |
| 5907808 | 0 |
| 5907809 | 0 |
| 5909009 | 0 |
| 5909014 | 0 |
| 5909016 | 0 |
| 5909027 | 0 |
| 5909032 | 0 |
| 5909034 | 0 |
| 5909035 | 0 |
| 5909036 | 0 |
| 5909048 | 0 |
| 5909056 | 0 |
| 5909060 | 0 |
| 5909062 | 0 |
| 5909804 | 0 |
| 5909806 | 0 |
| 5909807 | 0 |
| 5909810 | 0 |
| 5909812 | 0 |
| 5909814 | 0 |
| 5909815 | 0 |
| 5909816 | 0 |
| 5909817 | 0 |
| 5909818 | 0 |
| 5909819 | 0 |
| 5909821 | 0 |
| 5909824 | 0 |
| 5909825 | 0 |
| 5909826 | 0 |
| 5909827 | 0 |
| 5909830 | 0 |
| 5909831 | 0 |
| 5909832 | 0 |
| 5909833 | 0 |
| 5909834 | 0 |
| 5909835 | 0 |
| 5909837 | 0 |
| 5909838 | 0 |
| 5909839 | 0 |
| 5909841 | 0 |
| 5909842 | 0 |
| 5909843 | 0 |
| 5909844 | 0 |
| 5909845 | 0 |
| 5909847 | 0 |
| 5909848 | 0 |
| 5909875 | 0 |
| 5909876 | 0 |
| 5909877 | 0 |
| 5909878 | 0 |
| 5909879 | 0 |
| 5909880 | 0 |
| 5909881 | 0 |
| 5909882 | 0 |
| 5909883 | 0 |
| 5909884 | 0 |
| 5909885 | 0 |
| 5915002 | 0 |
| 5915007 | 0 |
| 5915015 | 0 |
| 5915020 | 0 |
| 5915025 | 0 |
| 5915029 | 0 |
| 5915034 | 0 |
| 5915036 | 0 |
| 5915038 | 0 |
| 5915039 | 0 |
| 5915046 | 0 |
| 5915051 | 0 |
| 5915055 | 0 |
| 5915062 | 0 |
| 5915065 | 0 |
| 5915801 | 0 |
| 5915802 | 0 |
| 5915803 | 0 |
| 5915805 | 0 |
| 5915806 | 0 |
| 5915807 | 0 |
| 5915808 | 0 |
| 5915809 | 0 |
| 5915810 | 0 |
| 5915811 | 0 |
| 5915813 | 0 |
| 5915816 | 0 |
| 5915825 | 0 |
| 5915830 | 0 |
| 5917005 | 0 |
| 5917015 | 0 |
| 5917021 | 0 |
| 5917029 | 0 |
| 5917030 | 0 |
| 5917034 | 0 |
| 5917040 | 0 |
| 5917041 | 0 |
| 5917042 | 0 |
| 5917044 | 0 |
| 5917047 | 0 |
| 5917049 | 0 |
| 5917052 | 0 |
| 5917054 | 0 |
| 5917056 | 0 |
| 5917801 | 0 |
| 5917802 | 0 |
| 5917803 | 0 |
| 5917804 | 0 |
| 5917805 | 0 |
| 5917809 | 0 |
| 5917812 | 0 |
| 5917815 | 0 |
| 5917819 | 0 |
| 5919008 | 0 |
| 5919012 | 0 |
| 5919013 | 0 |
| 5919015 | 0 |
| 5919016 | 0 |
| 5919017 | 0 |
| 5919021 | 0 |
| 5919033 | 0 |
| 5919035 | 0 |
| 5919043 | 0 |
| 5919046 | 0 |
| 5919049 | 0 |
| 5919051 | 0 |
| 5919801 | 0 |
| 5919802 | 0 |
| 5919803 | 0 |
| 5919804 | 0 |
| 5919809 | 0 |
| 5919812 | 0 |
| 5919814 | 0 |
| 5919815 | 0 |
| 5919816 | 0 |
| 5919818 | 0 |
| 5919820 | 0 |
| 5919821 | 0 |
| 5919822 | 0 |
| 5921007 | 0 |
| 5921008 | 0 |
| 5921010 | 0 |
| 5921014 | 0 |
| 5921016 | 0 |
| 5921018 | 0 |
| 5921023 | 0 |
| 5921030 | 0 |
| 5921032 | 0 |
| 5921034 | 0 |
| 5921036 | 0 |
| 5921804 | 0 |
| 5921805 | 0 |
| 5921806 | 0 |
| 5921807 | 0 |
| 5923008 | 0 |
| 5923019 | 0 |
| 5923025 | 0 |
| 5923033 | 0 |
| 5923035 | 0 |
| 5923037 | 0 |
| 5923039 | 0 |
| 5923047 | 0 |
| 5923049 | 0 |
| 5923801 | 0 |
| 5923802 | 0 |
| 5923803 | 0 |
| 5923804 | 0 |
| 5923805 | 0 |
| 5923806 | 0 |
| 5923807 | 0 |
| 5923808 | 0 |
| 5923809 | 0 |
| 5923810 | 0 |
| 5923813 | 0 |
| 5923816 | 0 |
| 5923822 | 0 |
| 5923823 | 0 |
| 5923824 | 0 |
| 5924025 | 0 |
| 5924029 | 0 |
| 5924030 | 0 |
| 5924034 | 0 |
| 5924039 | 0 |
| 5924048 | 0 |
| 5924052 | 0 |
| 5924054 | 0 |
| 5924804 | 0 |
| 5924806 | 0 |
| 5924812 | 0 |
| 5924814 | 0 |
| 5924817 | 0 |
| 5924820 | 0 |
| 5924833 | 0 |
| 5924835 | 0 |
| 5924836 | 0 |
| 5924840 | 0 |
| 5926005 | 0 |
| 5926010 | 0 |
| 5926014 | 0 |
| 5926021 | 0 |
| 5926024 | 0 |
| 5926801 | 0 |
| 5927010 | 0 |
| 5927012 | 0 |
| 5927016 | 0 |
| 5927018 | 0 |
| 5927020 | 0 |
| 5927802 | 0 |
| 5927806 | 0 |
| 5929005 | 0 |
| 5929011 | 0 |
| 5929018 | 0 |
| 5929022 | 0 |
| 5929024 | 0 |
| 5929026 | 0 |
| 5929028 | 0 |
| 5929803 | 0 |
| 5931006 | 0 |
| 5931012 | 0 |
| 5931021 | 0 |
| 5931026 | 0 |
| 5931032 | 0 |
| 5931034 | 0 |
| 5931801 | 0 |
| 5931802 | 0 |
| 5931806 | 0 |
| 5931807 | 0 |
| 5931808 | 0 |
| 5931809 | 0 |
| 5931812 | 0 |
| 5931813 | 0 |
| 5931814 | 0 |
| 5931815 | 0 |
| 5931816 | 0 |
| 5931817 | 0 |
| 5931818 | 0 |
| 5931819 | 0 |
| 5931820 | 0 |
| 5931821 | 0 |
| 5931823 | 0 |
| 5931826 | 0 |
| 5931827 | 0 |
| 5931828 | 0 |
| 5931829 | 0 |
| 5931831 | 0 |
| 5931832 | 0 |
| 5931833 | 0 |
| 5931842 | 0 |
| 5931843 | 0 |
| 5931844 | 0 |
| 5933006 | 0 |
| 5933008 | 0 |
| 5933012 | 0 |
| 5933015 | 0 |
| 5933019 | 0 |
| 5933024 | 0 |
| 5933028 | 0 |
| 5933032 | 0 |
| 5933035 | 0 |
| 5933037 | 0 |
| 5933039 | 0 |
| 5933042 | 0 |
| 5933044 | 0 |
| 5933045 | 0 |
| 5933054 | 0 |
| 5933060 | 0 |
| 5933067 | 0 |
| 5933068 | 0 |
| 5933070 | 0 |
| 5933072 | 0 |
| 5933074 | 0 |
| 5933801 | 0 |
| 5933802 | 0 |
| 5933805 | 0 |
| 5933806 | 0 |
| 5933807 | 0 |
| 5933808 | 0 |
| 5933809 | 0 |
| 5933811 | 0 |
| 5933812 | 0 |
| 5933813 | 0 |
| 5933814 | 0 |
| 5933817 | 0 |
| 5933819 | 0 |
| 5933821 | 0 |
| 5933823 | 0 |
| 5933825 | 0 |
| 5933828 | 0 |
| 5933829 | 0 |
| 5933831 | 0 |
| 5933832 | 0 |
| 5933833 | 0 |
| 5933834 | 0 |
| 5933836 | 0 |
| 5933841 | 0 |
| 5933842 | 0 |
| 5933844 | 0 |
| 5933845 | 0 |
| 5933849 | 0 |
| 5933850 | 0 |
| 5933851 | 0 |
| 5933852 | 0 |
| 5933853 | 0 |
| 5933854 | 0 |
| 5933855 | 0 |
| 5933859 | 0 |
| 5933861 | 0 |
| 5933865 | 0 |
| 5933866 | 0 |
| 5933868 | 0 |
| 5933872 | 0 |
| 5933873 | 0 |
| 5933875 | 0 |
| 5933876 | 0 |
| 5933877 | 0 |
| 5933878 | 0 |
| 5933879 | 0 |
| 5933880 | 0 |
| 5933881 | 0 |
| 5933882 | 0 |
| 5933884 | 0 |
| 5933886 | 0 |
| 5933887 | 0 |
| 5933888 | 0 |
| 5933889 | 0 |
| 5933895 | 0 |
| 5933898 | 0 |
| 5935016 | 0 |
| 5935018 | 0 |
| 5935020 | 0 |
| 5935801 | 0 |
| 5935802 | 0 |
| 5935803 | 0 |
| 5937005 | 0 |
| 5937010 | 0 |
| 5937017 | 0 |
| 5937021 | 0 |
| 5937023 | 0 |
| 5937028 | 0 |
| 5937033 | 0 |
| 5937041 | 0 |
| 5937801 | 0 |
| 5937802 | 0 |
| 5937803 | 0 |
| 5937805 | 0 |
| 5939007 | 0 |
| 5939011 | 0 |
| 5939019 | 0 |
| 5939023 | 0 |
| 5939032 | 0 |
| 5939037 | 0 |
| 5939039 | 0 |
| 5939043 | 0 |
| 5939044 | 0 |
| 5939045 | 0 |
| 5939801 | 0 |
| 5939802 | 0 |
| 5939803 | 0 |
| 5939804 | 0 |
| 5939805 | 0 |
| 5939806 | 0 |
| 5939807 | 0 |
| 5939808 | 0 |
| 5939811 | 0 |
| 5941005 | 0 |
| 5941009 | 0 |
| 5941010 | 0 |
| 5941012 | 0 |
| 5941013 | 0 |
| 5941014 | 0 |
| 5941015 | 0 |
| 5941016 | 0 |
| 5941017 | 0 |
| 5941019 | 0 |
| 5941021 | 0 |
| 5941025 | 0 |
| 5941026 | 0 |
| 5941027 | 0 |
| 5941039 | 0 |
| 5941041 | 0 |
| 5941801 | 0 |
| 5941802 | 0 |
| 5941805 | 0 |
| 5941806 | 0 |
| 5941807 | 0 |
| 5941808 | 0 |
| 5941809 | 0 |
| 5941810 | 0 |
| 5941811 | 0 |
| 5941812 | 0 |
| 5941813 | 0 |
| 5941821 | 0 |
| 5941828 | 0 |
| 5941829 | 0 |
| 5941831 | 0 |
| 5941833 | 0 |
| 5941837 | 0 |
| 5941839 | 0 |
| 5941840 | 0 |
| 5941841 | 0 |
| 5941845 | 0 |
| 5941849 | 0 |
| 5941850 | 0 |
| 5941851 | 0 |
| 5941852 | 0 |
| 5941855 | 0 |
| 5941868 | 0 |
| 5941871 | 0 |
| 5941872 | 0 |
| 5941873 | 0 |
| 5941876 | 0 |
| 5941879 | 0 |
| 5941880 | 0 |
| 5941882 | 0 |
| 5941883 | 0 |
| 5941884 | 0 |
| 5941885 | 0 |
| 5943008 | 0 |
| 5943012 | 0 |
| 5943017 | 0 |
| 5943023 | 0 |
| 5943027 | 0 |
| 5943031 | 0 |
| 5943033 | 0 |
| 5943037 | 0 |
| 5943804 | 0 |
| 5943806 | 0 |
| 5943807 | 0 |
| 5943808 | 0 |
| 5943813 | 0 |
| 5943815 | 0 |
| 5943816 | 0 |
| 5943836 | 0 |
| 5943837 | 0 |
| 5945006 | 0 |
| 5945010 | 0 |
| 5945012 | 0 |
| 5945014 | 0 |
| 5945801 | 0 |
| 5945802 | 0 |
| 5945803 | 0 |
| 5947007 | 0 |
| 5947012 | 0 |
| 5947016 | 0 |
| 5947021 | 0 |
| 5947023 | 0 |
| 5947026 | 0 |
| 5947027 | 0 |
| 5947030 | 0 |
| 5947032 | 0 |
| 5947803 | 0 |
| 5947804 | 0 |
| 5947806 | 0 |
| 5947807 | 0 |
| 5947809 | 0 |
| 5947810 | 0 |
| 5949005 | 0 |
| 5949011 | 0 |
| 5949013 | 0 |
| 5949018 | 0 |
| 5949020 | 0 |
| 5949022 | 0 |
| 5949024 | 0 |
| 5949028 | 0 |
| 5949032 | 0 |
| 5949035 | 0 |
| 5949038 | 0 |
| 5949039 | 0 |
| 5949041 | 0 |
| 5949802 | 0 |
| 5949803 | 0 |
| 5949804 | 0 |
| 5949807 | 0 |
| 5949810 | 0 |
| 5949811 | 0 |
| 5949812 | 0 |
| 5949813 | 0 |
| 5949814 | 0 |
| 5949815 | 0 |
| 5949816 | 0 |
| 5949817 | 0 |
| 5949818 | 0 |
| 5949819 | 0 |
| 5949820 | 0 |
| 5949832 | 0 |
| 5949843 | 0 |
| 5949844 | 0 |
| 5949845 | 0 |
| 5949847 | 0 |
| 5951007 | 0 |
| 5951009 | 0 |
| 5951013 | 0 |
| 5951015 | 0 |
| 5951017 | 0 |
| 5951019 | 0 |
| 5951022 | 0 |
| 5951028 | 0 |
| 5951031 | 0 |
| 5951032 | 0 |
| 5951034 | 0 |
| 5951038 | 0 |
| 5951043 | 0 |
| 5951051 | 0 |
| 5951053 | 0 |
| 5951801 | 0 |
| 5951802 | 0 |
| 5951803 | 0 |
| 5951805 | 0 |
| 5951806 | 0 |
| 5951807 | 0 |
| 5951809 | 0 |
| 5951810 | 0 |
| 5951813 | 0 |
| 5951814 | 0 |
| 5951815 | 0 |
| 5951818 | 0 |
| 5951819 | 0 |
| 5951820 | 0 |
| 5951821 | 0 |
| 5951822 | 0 |
| 5951824 | 0 |
| 5951825 | 0 |
| 5951826 | 0 |
| 5951827 | 0 |
| 5951828 | 0 |
| 5951829 | 0 |
| 5951830 | 0 |
| 5951840 | 0 |
| 5951844 | 0 |
| 5951848 | 0 |
| 5953007 | 0 |
| 5953012 | 0 |
| 5953019 | 0 |
| 5953033 | 0 |
| 5953038 | 0 |
| 5953042 | 0 |
| 5953044 | 0 |
| 5953046 | 0 |
| 5953050 | 0 |
| 5953801 | 0 |
| 5953802 | 0 |
| 5955003 | 0 |
| 5955005 | 0 |
| 5955010 | 0 |
| 5955014 | 0 |
| 5955021 | 0 |
| 5955023 | 0 |
| 5955025 | 0 |
| 5955030 | 0 |
| 5955034 | 0 |
| 5955040 | 0 |
| 5955042 | 0 |
| 5955801 | 0 |
| 5955802 | 0 |
| 5955803 | 0 |
| 5955804 | 0 |
| 5955807 | 0 |
| 5955808 | 0 |
| 5955812 | 0 |
| 5957022 | 0 |
| 5957802 | 0 |
| 5957803 | 0 |
| 5957813 | 0 |
| 5957814 | 0 |
| 5959007 | 0 |
| 5959805 | 0 |
| 5959806 | 0 |
| 5959810 | 0 |
Map 2.b shows that few census subdivisions (CSDs) in Western Canada had a high concentration of Francophone agricultural workers. In 2016, five CSDs had 90 or more Francophone agricultural workers: Smoky River No. 130
2.1 Age group
Between 2006 and 2016, the populations of Francophone agricultural workers in Western Canada aged. The proportion of these workers aged 55 years or older rose over the decade, outpacing the proportion for their Anglophone counterparts. This marked aging is related to the decrease in the number of Francophone workers throughout the decade, as some workers retired or moved to other sectors of employment. It also reflects the high proportion of French-language farms operated exclusively by persons 55 years or older. However, the proportion of Francophone agricultural workers aged 15 to 34 increased between 2006 and 2016 in Manitoba and Alberta.
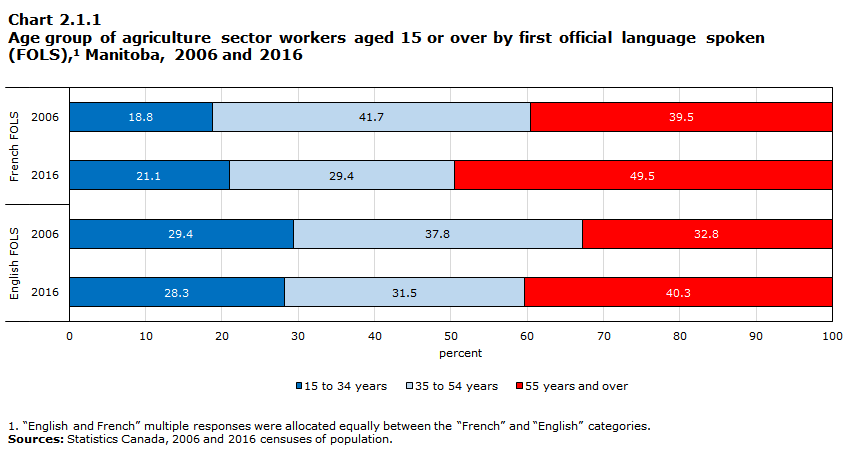
Data table for Chart 2.1.1
| 15 to 34 years | 35 to 54 years | 55 years and over | |
|---|---|---|---|
| percent | |||
| French FOLS | |||
| 2006 | 18.8 | 41.7 | 39.5 |
| 2016 | 21.1 | 29.4 | 49.5 |
| English FOLS | |||
| 2006 | 29.4 | 37.8 | 32.8 |
| 2016 | 28.3 | 31.5 | 40.3 |
|
|||
The median age of Francophone agricultural workers in Manitoba rose from 51.4 years in 2006 to 54.7 years in 2016, while the proportion of Francophone agricultural workers aged 55 years or older increased from 39.5% in 2006 to 49.5% in 2016. In contrast, a slight increase in the share of Francophone agricultural workers aged 15 to 34 (from 18.8% in 2006 to 21.1% in 2016) was also observed over the decade.
In Manitoba, Francophone agricultural workers were older than their Anglophone counterparts. Although the median age of Anglophone agricultural workers rose between 2006 (46.6 years) and 2016 (50.0 years), it remained lower than that of their Francophone counterparts. In 2016, the proportion of Anglophone agricultural workers aged 55 years or older (40.3%) was lower than that of their Francophone counterparts (49.5%), and the share of Anglophone agricultural workers aged 15 to 34 (28.3%) was higher than that of Francophone workers (21.1%).
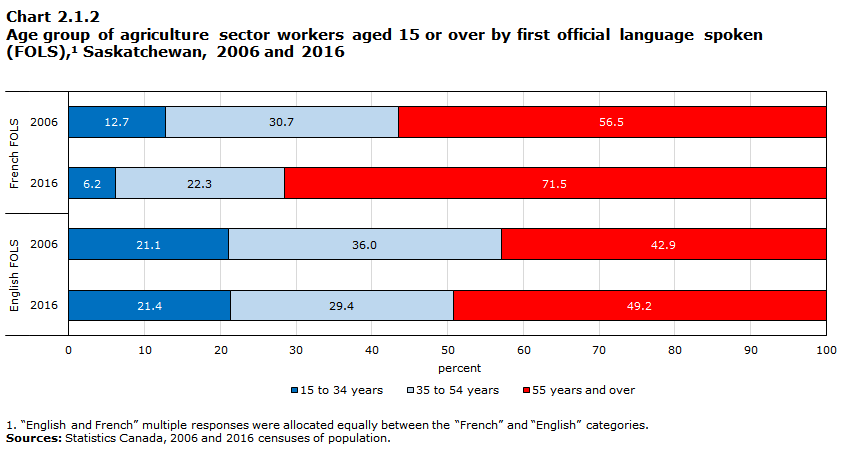
Data table for Chart 2.1.2
| 15 to 34 years | 35 to 54 years | 55 years and over | |
|---|---|---|---|
| percent | |||
| French FOLS | |||
| 2006 | 12.7 | 30.7 | 56.5 |
| 2016 | 6.2 | 22.3 | 71.5 |
| English FOLS | |||
| 2006 | 21.1 | 36.0 | 42.9 |
| 2016 | 21.4 | 29.4 | 49.2 |
|
|||
In Saskatchewan, the proportion of Francophone agricultural workers aged 55 years or older rose from 56.5% to 71.5% over the decade, while the share of those aged 15 to 34 fell from 12.7% in 2006 to 6.2% in 2016. The median age of Francophone agricultural workers increased from 57.1 years in 2006 to 61.3 years in 2016.
The median age of Anglophone agricultural workers (52.0 years in 2006 and 54.6 years in 2016) was well below the median age of their Francophone counterparts. The difference was of about seven years in 2016. The proportion of agricultural workers aged 15 to 34 was more than three times higher among Anglophones (21.4%) than Francophones (6.2%) in 2016. Furthermore, fewer than half of Anglophone agricultural workers were 55 years or older, compared with more than seven in ten Francophone agricultural workers.
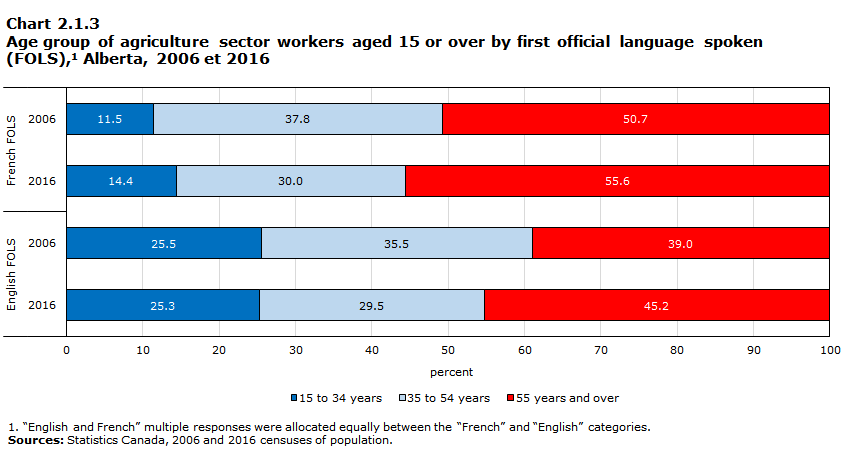
Data table for Chart 2.1.3
| 15 to 34 years | 35 to 54 years | 55 years and over | |
|---|---|---|---|
| percent | |||
| French FOLS | |||
| 2006 | 11.5 | 37.8 | 50.7 |
| 2016 | 14.4 | 30.0 | 55.6 |
| English FOLS | |||
| 2006 | 25.5 | 35.5 | 39.0 |
| 2016 | 25.3 | 29.5 | 45.2 |
|
|||
The median age of Francophone agricultural workers in Alberta rose from 55.9 years in 2006 to 57.0 years in 2016. This slight increase can be seen in the proportion of those aged 55 years or older, which rose from 50.7% in 2006 to 55.6% in 2016. However, the proportion of Francophone agricultural workers aged 15 to 34 also increased between 2006 (11.5%) and 2016 (14.4%).
Francophone agricultural workers in Alberta were older than their English-speaking counterparts, whose median age was lower in 2006 (49.5 years) and in 2016 (52.7 years). The proportion of Anglophone agricultural workers aged 55 or older (45.2%) was lower than the proportion for Francophone workers (55.6%) in 2016. Furthermore, around one in four Anglophone agricultural workers were aged 15 to 34, compared with nearly one in seven Francophone agricultural workers.
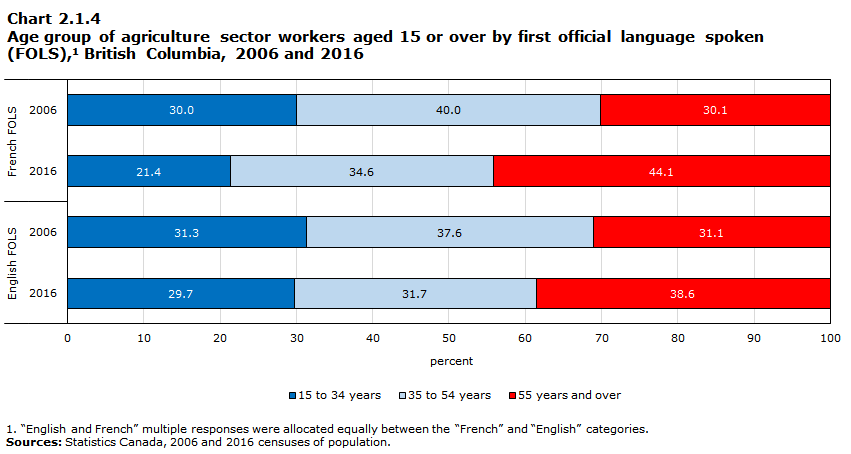
Data table for Chart 2.1.4
| 15 to 34 years | 35 to 54 years | 55 years and over | |
|---|---|---|---|
| percent | |||
| French FOLS | |||
| 2006 | 30.0 | 40.0 | 30.1 |
| 2016 | 21.4 | 34.6 | 44.1 |
| English FOLS | |||
| 2006 | 31.3 | 37.6 | 31.1 |
| 2016 | 29.7 | 31.7 | 38.6 |
|
|||
In British Columbia, the median age of Francophone agricultural workers rose from 45.9 years in 2006 to 53.2 years in 2016, and the proportion of those aged 55 years or older increased between 2006 (30.1%) and 2016 (44.1%). Moreover, the proportion of Francophone agricultural workers aged 15 to 34 years fell from 30.0% in 2006 to 21.4% in 2016.
Anglophone agricultural workers were younger than their Francophone counterparts, with their median age rising from 46.0 years in 2006 to 49.2 years in 2016. The proportion of Anglophone agricultural workers aged 55 years or older (38.6%) was lower than that of their Francophone counterparts (44.1%) in 2016. In addition, the proportion of Anglophone agricultural workers aged 15 to 34 years (29.7%) was higher than that of Francophone workers (21.4%).
2.2 Sex
The proportion of women among Francophone and Anglophone agricultural workers in Western Canada was not close to parity in any province, except among Anglophone agricultural workers in British Columbia.
The proportion of women among Francophone agricultural workers in Manitoba was relatively stable between 2006 (23.8%) and 2016 (23.0%). These proportions were lower than those of their Anglophone counterparts (31.6% in 2006 and 29.1% in 2016).
In Saskatchewan, the proportion of women among agricultural workers was relatively stable between 2006 and 2016 and remained similar among both Francophones (28.1% in 2006 and 26.9% in 2016) and Anglophones (29.3% in 2006 and 29.2% in 2016).
In Alberta, the proportion of women among Francophone agricultural workers increased from 27.2% to 34.3% between 2006 and 2016. Among their Anglophone counterparts, the proportion of women declined from 36.1% in 2006 to 34.7% in 2016. Thus, in 2016, the proportion of women was similar among Anglophone and Francophone agricultural workers in Alberta.
The proportion of women among Francophone agricultural workers in British Columbia declined between 2006 (37.0%) and 2016 (29.8%). Among their Anglophone peers, the proportion of women was close to parity and remained relatively stable over the decade (44.1% in 2006 and 44.5% in 2016).
2.3 Place of birth
The proportion of Francophone agricultural workers born outside their province of residence was up between 2006 and 2016 across Western Canada, except in Manitoba, where the proportion changed little over the decade. In the three other Western provinces, the proportion of Francophone agricultural workers born in a province other than their province of residence was higher than that of their Anglophone counterparts. In contrast, the proportion of Francophone agricultural workers born outside Canada was below that of their Anglophone counterparts in all of Western Canada in 2016.
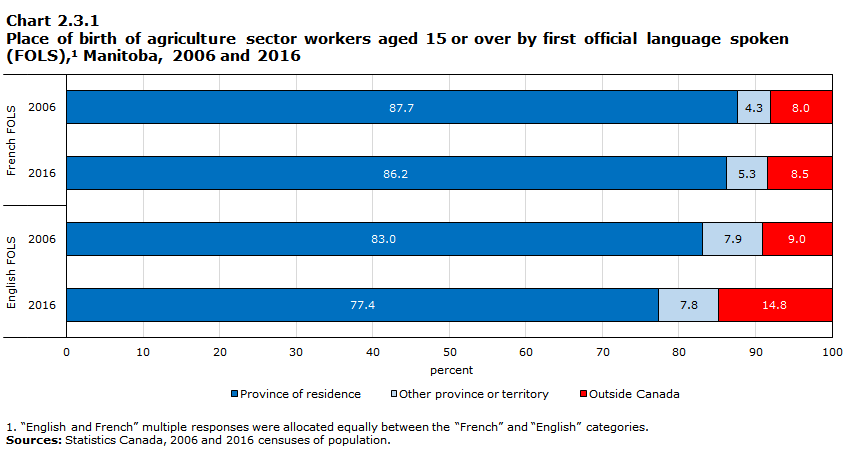
Data table for Chart 2.3.1
| Province of residence | Other province or territory | Outside Canada | |
|---|---|---|---|
| percent | |||
| French FOLS | |||
| 2006 | 87.7 | 4.3 | 8.0 |
| 2016 | 86.2 | 5.3 | 8.5 |
| English FOLS | |||
| 2006 | 83.0 | 7.9 | 9.0 |
| 2016 | 77.4 | 7.8 | 14.8 |
|
|||
The places of birth of Manitoba’s Francophone agricultural workers were similar in 2006 and 2016. More than eight in ten Francophone agricultural workers were born in the province in 2016. The proportions of Anglophone agricultural workers born in a province other than Manitoba (7.8%) or outside Canada (14.8%) were higher than those of their Francophone counterparts (5.3% and 8.5%, respectively). In 2016, about three in four Francophone agricultural workers born outside Canada were born in France.
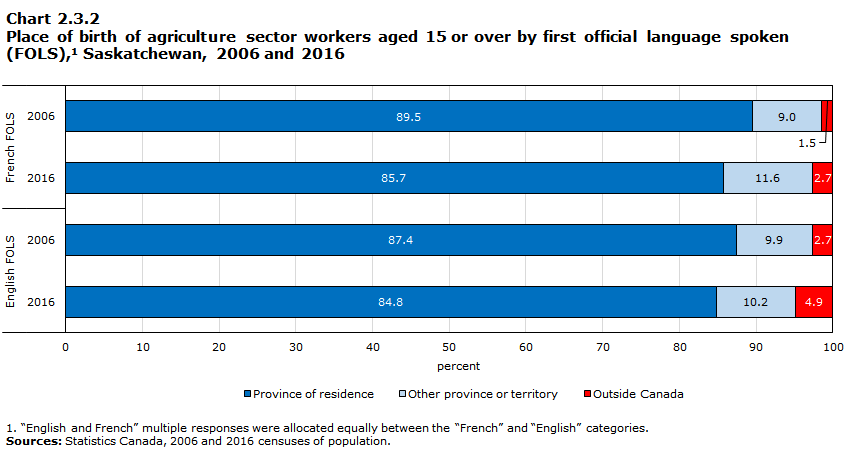
Data table for Chart 2.3.2
| Province of residence | Other province or territory | Outside Canada | |
|---|---|---|---|
| percent | |||
| French FOLS | |||
| 2006 | 89.5 | 9.0 | 1.5 |
| 2016 | 85.7 | 11.6 | 2.7 |
| English FOLS | |||
| 2006 | 87.4 | 9.9 | 2.7 |
| 2016 | 84.8 | 10.2 | 4.9 |
|
|||
In Saskatchewan, more than eight in ten Francophone agricultural workers were born in the province in 2016. There was a slight increase in the proportion of Francophone agricultural workers born in a province other than Saskatchewan between 2006 (9.0%) and 2016 (11.6%). In 2016, more than half of Francophone agricultural workers born in a province other than Saskatchewan were from Quebec.
The places of birth of Francophone agricultural workers were similar to those of their Anglophone counterparts. However, the proportion of Anglophone agricultural workers born outside Canada (4.9%) was slightly higher than that of their Francophone counterparts (2.7%) in 2016.
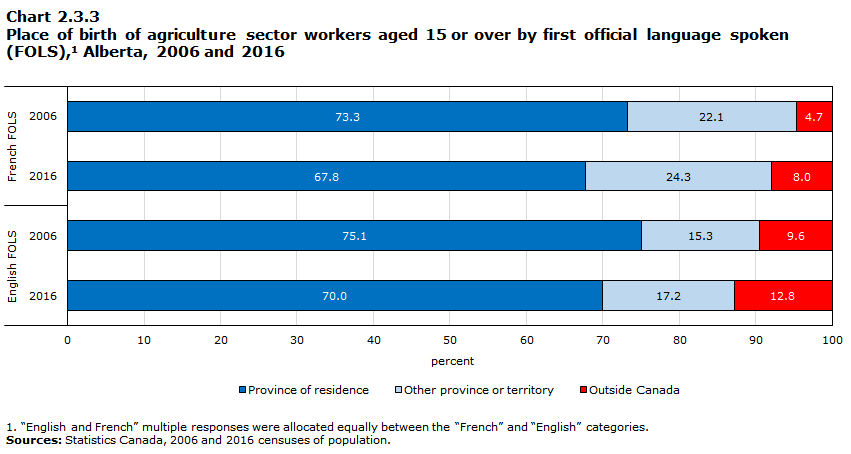
Data table for Chart 2.3.3
| Province of residence | Other province or territory | Outside Canada | |
|---|---|---|---|
| percent | |||
| French FOLS | |||
| 2006 | 73.3 | 22.1 | 4.7 |
| 2016 | 67.8 | 24.3 | 8.0 |
| English FOLS | |||
| 2006 | 75.1 | 15.3 | 9.6 |
| 2016 | 70.0 | 17.2 | 12.8 |
|
|||
In Alberta, the proportion of Francophone agricultural workers born in the province decreased from 73.3% in 2006 to 67.8% in 2016. The share of these workers born outside Canada rose from 4.7% to 8.0% over the decade. In 2016, about one in four Francophone agricultural workers in Alberta were born in another province. This proportion was lower among their Anglophone counterparts (17.2%). However, Anglophone agricultural workers were more likely to be born outside Canada (12.8%) than their Francophone counterparts (8.0%).
Among Francophone agricultural workers born in a province other than Alberta in 2016, more than half were from Quebec. Overall, about one in eight Francophone agricultural workers in Alberta were born in Quebec. Moreover, among Francophone agricultural workers born outside Canada, nearly six in ten were from Europe.
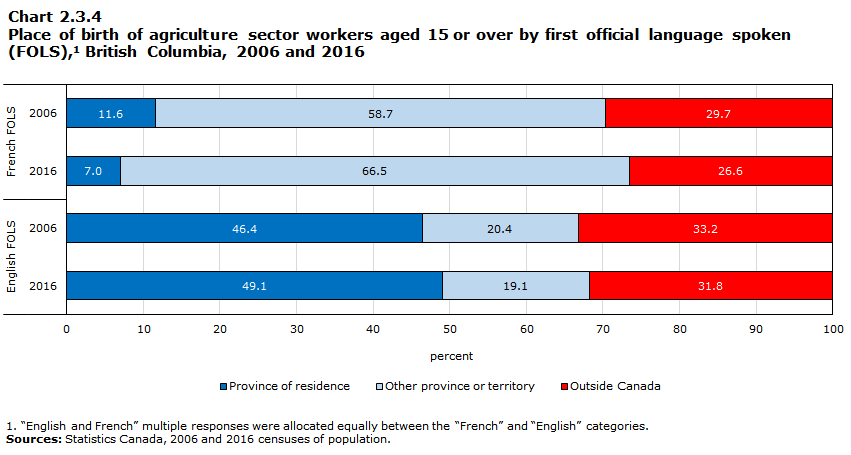
Data table for Chart 2.3.4
| Province of residence | Other province or territory | Outside Canada | |
|---|---|---|---|
| percent | |||
| French FOLS | |||
| 2006 | 11.6 | 58.7 | 29.7 |
| 2016 | 7.0 | 66.5 | 26.6 |
| English FOLS | |||
| 2006 | 46.4 | 20.4 | 33.2 |
| 2016 | 49.1 | 19.1 | 31.8 |
|
|||
In 2016, about two-thirds of Francophone agricultural workers in British Columbia were born in another province. This proportion was up slightly from 2006 (58.7%). In 2016, about one in fourteen Francophone agricultural workers were born in British Columbia, compared with close to half of their Anglophone counterparts. Furthermore, the proportion of Anglophone agricultural workers born outside Canada (31.8%) was higher than that of their Francophone counterparts (26.6%) in 2016.
In 2016, Francophone agricultural workers born in a province other than British Columbia were largely from Quebec (64.6%). Overall, more than four in ten of British Columbia’s Francophone agricultural workers were born in Quebec.
Most Francophone agricultural workers born outside Canada were from Europe (74.0%) in 2016. In other words, in
2.4 Indigenous identity
In Manitoba, the number of IndigenousNote agricultural workers increased from 1,425 in 2006 to 1,520 in 2016. French was the first official language spoken (FOLS) for 12.9% of these workers in 2006 and for 12.1% in 2016. All Indigenous agricultural workers in the province knew English or French in 2016. Moreover, about 5% knew an Indigenous language.
In Saskatchewan, there were 1,480 Indigenous agricultural workers in 2006 and 1,725 in 2016. The proportion with French as their FOLS decreased from 6.0% to 5.1% over the decade. In 2016, all Indigenous agricultural workers in the province knew at least one official language, and about one in ten knew an Indigenous language, often a Cree language.
Between 2006 and 2016, the number of Indigenous agricultural workers in Alberta rose from 1,425 to 1,975. For both years, about 2% had French as their FOLS. In 2016, all Indigenous agricultural workers in the province knew English or French, and 14.3% knew an Indigenous language, such as Blackfoot.
Lastly, the number of Indigenous agricultural workers in British Columbia increased from 1,760 in 2006 to 1,950 in 2016. The proportion with French as their FOLS decreased from about 2% in 2006 to around 1% in 2016. All Indigenous agricultural workers in the province knew at least one official language in 2016, and close to 7% knew an Indigenous language.
2.5 Education
The level of education of Francophone agricultural workers rose between 2006 and 2016 in all Western provinces. The proportion of these workers who did not have a certificate, diploma or degree declined over the decade in each province.
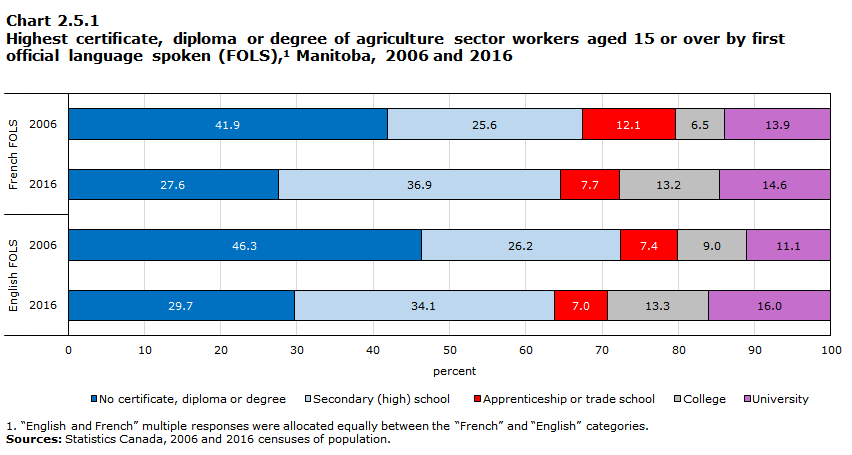
Data table for Chart 2.5.1
| No certificate, diploma or degree | Secondary (high) school | Apprenticeship or trade school | College | University | |
|---|---|---|---|---|---|
| percent | |||||
| French FOLS | |||||
| 2006 | 41.9 | 25.6 | 12.1 | 6.5 | 13.9 |
| 2016 | 27.6 | 36.9 | 7.7 | 13.2 | 14.6 |
| English FOLS | |||||
| 2006 | 46.3 | 26.2 | 7.4 | 9.0 | 11.1 |
| 2016 | 29.7 | 34.1 | 7.0 | 13.3 | 16.0 |
|
|||||
In Manitoba, the proportion of Francophone agricultural workers who did not have a certificate, diploma or degree fell from 41.9% to 27.6% between 2006 and 2016. In addition, while one in five Francophone agricultural workers had a collegeNote or university qualification in 2006, almost 28% of these workers did in 2016. Furthermore, the level of education of Francophone agricultural workers was generally similar to that of their Anglophone counterparts in 2016.
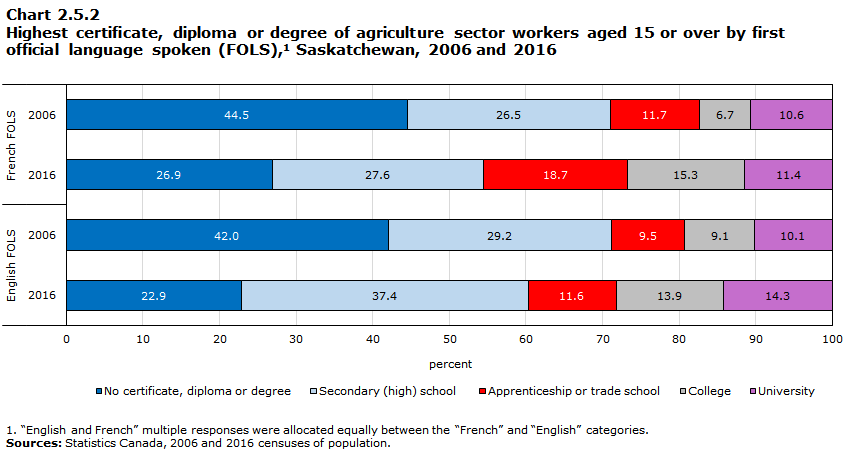
Data table for Chart 2.5.2
| No certificate, diploma or degree | Secondary (high) school | Apprenticeship or trade school | College | University | |
|---|---|---|---|---|---|
| percent | |||||
| French FOLS | |||||
| 2006 | 44.5 | 26.5 | 11.7 | 6.7 | 10.6 |
| 2016 | 26.9 | 27.6 | 18.7 | 15.3 | 11.4 |
| English FOLS | |||||
| 2006 | 42.0 | 29.2 | 9.5 | 9.1 | 10.1 |
| 2016 | 22.9 | 37.4 | 11.6 | 13.9 | 14.3 |
|
|||||
In Saskatchewan, the proportion of Francophone agricultural workers who did not have a certificate, diploma or degree decreased from 44.5% in 2006 to 26.9% in 2016. Conversely, the proportion of Francophone agricultural workers with a postsecondary qualification rose from 29.0% in 2006 to 45.4% in 2016. In 2016, this proportion was higher than that of their Anglophone counterparts (39.8%). This difference is due to the higher proportion of Francophone agricultural workers whose highest qualification was an apprenticeship or trades diploma (18.7% compared with 11.6% among their Anglophone counterparts). In contrast, Francophone agricultural workers were more likely to have no certificate, diploma or degree (26.9%) than their Anglophone peers (22.9%).
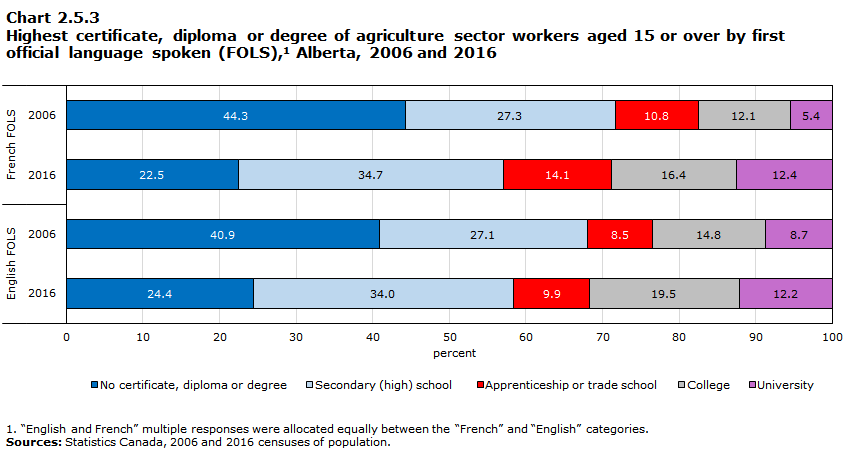
Data table for Chart 2.5.3
| No certificate, diploma or degree | Secondary (high) school | Apprenticeship or trade school | College | University | |
|---|---|---|---|---|---|
| percent | |||||
| French FOLS | |||||
| 2006 | 44.3 | 27.3 | 10.8 | 12.1 | 5.4 |
| 2016 | 22.5 | 34.7 | 14.1 | 16.4 | 12.4 |
| English FOLS | |||||
| 2006 | 40.9 | 27.1 | 8.5 | 14.8 | 8.7 |
| 2016 | 24.4 | 34.0 | 9.9 | 19.5 | 12.2 |
|
|||||
In Alberta, the proportion of Francophone agricultural workers who did not have a certificate, diploma or degree fell from 44.3% to 22.5% between 2006 and 2016, and the share of these workers who had a postsecondary qualification rose from 28.3% to 42.9% over the decade.
In 2016, the levels of education of Francophone and Anglophone agricultural workers in Alberta were similar, with similar proportions of workers who did not have a certificate, diploma or degree or who had a postsecondary qualification. However, Francophone agricultural workers were more likely to have an apprenticeship or trades diploma (14.1%) as their highest qualification than their Anglophone counterparts (9.9%), and Anglophone agricultural workers were more likely to have a college diploma as their highest diploma earned (19.5%) than their Francophone peers (16.4%).
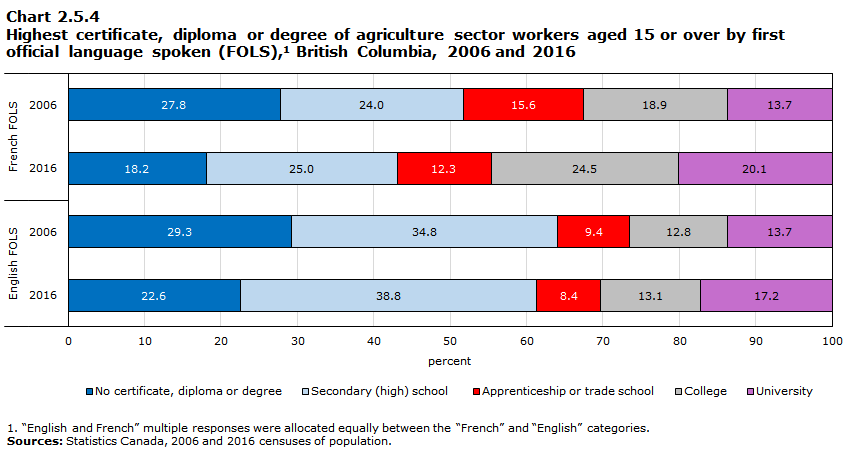
Data table for Chart 2.5.4
| No certificate, diploma or degree | Secondary (high) school | Apprenticeship or trade school | College | University | |
|---|---|---|---|---|---|
| percent | |||||
| French FOLS | |||||
| 2006 | 27.8 | 24.0 | 15.6 | 18.9 | 13.7 |
| 2016 | 18.2 | 25.0 | 12.3 | 24.5 | 20.1 |
| English FOLS | |||||
| 2006 | 29.3 | 34.8 | 9.4 | 12.8 | 13.7 |
| 2016 | 22.6 | 38.8 | 8.4 | 13.1 | 17.2 |
|
|||||
In British Columbia, the proportion of Francophone agricultural workers with no certificate, diploma or degree decreased from 27.8% to 18.2% over the decade, and the proportion of those with college or university qualifications rose from 32.6% in 2006 to 44.6% in 2016.
Francophone agricultural workers in British Columbia had a higher level of education than their Anglophone counterparts in 2016. The proportion of Francophone agricultural workers with a postsecondary qualification (56.9%) was higher than that of their Anglophone peers (38.7%). Furthermore, the proportion of Francophone agricultural workers had no certificate, diploma or degree (18.2%) was lower than that of their Anglophone counterparts (22.6%).
2.6 Class of worker
The proportion of self-employedNote Francophone agricultural workers declined between 2006 and 2016 in Manitoba (from 56.6% to 52.9%) and Alberta (from 67.1% to 60.4%). This proportion was relatively stable in Saskatchewan (68.5% in 2006 and 67.5% in 2016) and increased in British Columbia (from 27.3% in 2006 to 37.1% in 2016).
In 2016, the proportion of self-employed agricultural workers was higher among Francophones than Anglophones across Western Canada: 52.9% versus 45.7% in Manitoba, 67.5% versus 58.1% in Saskatchewan, 60.4% versus 52.2% in Alberta, and 37.1% versus 32.2% in British Columbia. Over the decade, the proportion of self-employed Francophone agricultural workers who were incorporated increased in several provinces. Between 2006 and 2016, this proportion rose from about 28% to nearly 47% in Manitoba, from less than 23% to close to 45% in Saskatchewan, and from less than 34% to around 41% in Alberta. In British Columbia, about one in five self-employed Francophone agricultural workers were incorporated in 2016.
2.7 Employment income
Employment income includes all income received as wages, salaries and commissions from paid employment and net self-employment income from farm or non-farm unincorporated business and/or professional practice during the calendar year preceding the census. The employment income of agricultural workers may include income from sources other than the job held in that sector.
Most of the information in this report includes all individuals categorized as workers, including those who worked during the reference week (e.g. May 1 to 7, 2016) or the census year (e.g. 2016), but who were not working in the year before the census (e.g. 2015). However, since these workers were not working in the year before the census, they are excluded from the information presented in this section. They are identified by the “not applicable” category in the charts below and are excluded from the calculations of median income, work arrangements, and average number of weeks worked per year.
In 2016, the median employment income of Francophone agricultural workers in Western Canada was lower than that of their Anglophone counterparts in all the Western provinces, except British Columbia.
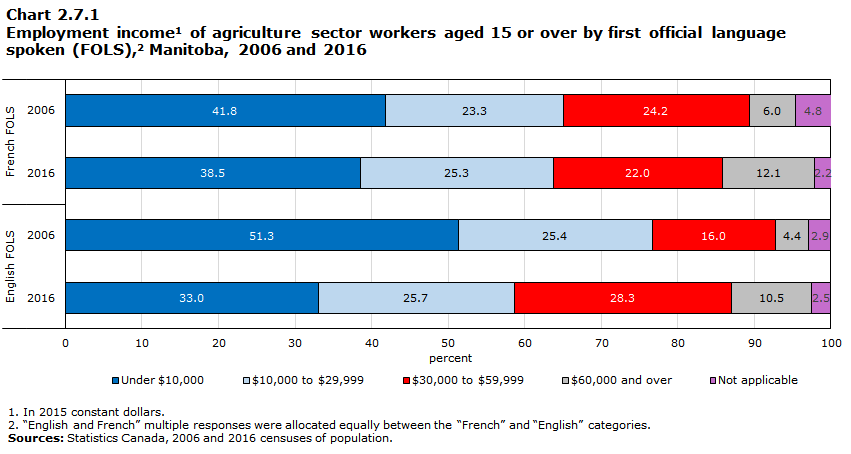
Data table for Chart 2.7.1
| Under $10,000 | $10,000 to $29,999 | $30,000 to $59,999 | $60,000 and over | Not applicable | |
|---|---|---|---|---|---|
| percent | |||||
| French FOLS | |||||
| 2006 | 41.8 | 23.3 | 24.2 | 6.0 | 4.8 |
| 2016 | 38.5 | 25.3 | 22.0 | 12.1 | 2.2 |
| English FOLS | |||||
| 2006 | 51.3 | 25.4 | 16.0 | 4.4 | 2.9 |
| 2016 | 33.0 | 25.7 | 28.3 | 10.5 | 2.5 |
|
|||||
The median employment incomeNote of Francophone agricultural workers in Manitoba increased from $13,210 to $15,645 between 2006 and 2016. Over the decade, the proportion of these workers with low employment income (below $10,000) decreased from 41.8% in 2006 to 38.5% in 2016, while the share of these workers with high employment income ($60,000 or more) rose from 6.0% in 2006 to 12.1% in 2016.
The median employment income of Anglophone agricultural workers increased strongly between 2006 ($9,010) and 2016 ($20,425), outpacing their Francophone counterparts in 2016. The proportion of Anglophone agricultural workers with employment income below $10,000 was lower (33.0%) than that of their Francophone peers (38.5%) in 2016. Moreover, Anglophone agricultural workers were more likely to report an employment income of $30,000 or more (38.8%) than their Francophone counterparts (34.1%).
The average number of weeks worked per yearNote was similar among Francophone (42.8) and Anglophone (43.7) agricultural workers in 2016. In addition, Francophone agricultural workers were somewhat more likely to work
The gap in median employment income between Francophone men and women who worked in Manitoba’s agriculture sector rose slightly between 2006 ($4,690) and 2016 ($5,220). The median employment income of Francophone women working in the agriculture sector increased from $9,655 in 2006 to $11,700 in 2016, and that of Francophone men, from $14,345 in 2006 to $16,920 in 2016.
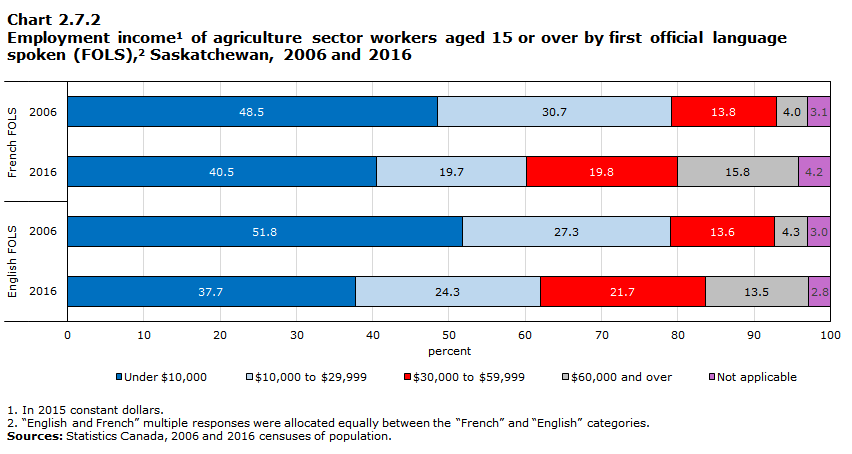
Data table for Chart 2.7.2
| Under $10,000 | $10,000 to $29,999 | $30,000 to $59,999 | $60,000 and over | Not applicable | |
|---|---|---|---|---|---|
| percent | |||||
| French FOLS | |||||
| 2006 | 48.5 | 30.7 | 13.8 | 4.0 | 3.1 |
| 2016 | 40.5 | 19.7 | 19.8 | 15.8 | 4.2 |
| English FOLS | |||||
| 2006 | 51.8 | 27.3 | 13.6 | 4.3 | 3.0 |
| 2016 | 37.7 | 24.3 | 21.7 | 13.5 | 2.8 |
|
|||||
The employment income of Francophone agricultural workers in Saskatchewan increased between 2006 and 2016. The proportion of these workers whose employment income was greater than or equal to $30,000 doubled over the decade, from 17.8% to 35.6%. The proportion of Francophone agricultural workers with employment income of $60,000 or more showed a sharp increase, almost quadrupling over the decade, from 4.0% in 2006 to 15.8% in 2016. Conversely, the share of these workers who reported employment income of less than $10,000 decreased between 2006 (48.5%) and 2016 (40.5%).
The median employment income of Francophone agricultural workers in Saskatchewan was $9,905 in 2006 and $13,935 in 2016. It was higher than the median employment income of their Anglophone counterparts in 2006, but not in 2016. The median employment income of Anglophone agricultural workers increased from $8,580 in 2006 to $17,150 in 2016. Furthermore, in 2016, a similar proportion of Francophone and Anglophone agricultural workers (about 35%) had employment income of $30,000 or more.
In 2016, the average number of weeks worked per year was slightly higher among Francophone agricultural workers (44.6) than among their Anglophone peers (43.6). The proportion who worked full-time was also higher among Francophone agricultural workers (82.9%) than among their Anglophone counterparts (79.7%).
The gap in median employment income between Francophone men and women who worked in Saskatchewan’s agriculture sector increased between 2006 ($5,750) and 2016 ($9,205). The median employment income of Francophone women working in the agriculture sector rose from $5,845 in 2006 to $8,270 in 2016, and that of Francophone men, from $11,595 in 2006 to $17,475 in 2016.
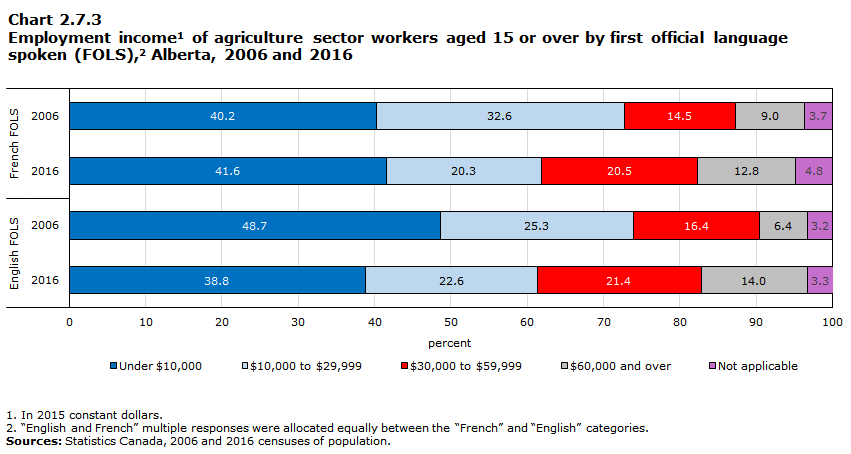
Data table for Chart 2.7.3
| Under $10,000 | $10,000 to $29,999 | $30,000 to $59,999 | $60,000 and over | Not applicable | |
|---|---|---|---|---|---|
| percent | |||||
| French FOLS | |||||
| 2006 | 40.2 | 32.6 | 14.5 | 9.0 | 3.7 |
| 2016 | 41.6 | 20.3 | 20.5 | 12.8 | 4.8 |
| English FOLS | |||||
| 2006 | 48.7 | 25.3 | 16.4 | 6.4 | 3.2 |
| 2016 | 38.8 | 22.6 | 21.4 | 14.0 | 3.3 |
|
|||||
The median employment income of Alberta’s Francophone agricultural workers was relatively stable between 2006 ($14,560) and 2016 ($14,430). However, the proportion of these workers whose employment income was greater than or equal to $30,000 increased over the decade, from 23.5% to 33.3%. In 2016, this proportion was slightly lower than that of their Anglophone counterparts (35.4%). The median employment income of Anglophone agricultural workers increased significantly over the decade, from $9,895 in 2006 to $16,960 in 2016, outpacing their Francophone counterparts in 2016.
In 2016, 76.8% of Francophone agricultural workers worked full-time, compared with 74.9% of their Anglophone counterparts. On average, Francophone agricultural workers worked 44.1 weeks per year and their Anglophone counterparts worked 43.4 weeks per year.
In Alberta, the gap in median employment income between Francophone men and women who worked in the agriculture sector increased significantly between 2006 ($3,920) and 2016 ($18,000). The median employment income of Francophone women working in the agriculture sector declined over the decade, from $12,535 in 2006 to $4,005 in 2016, while that of Francophone men rose from $16,450 in 2006 to $22,000 in 2016.
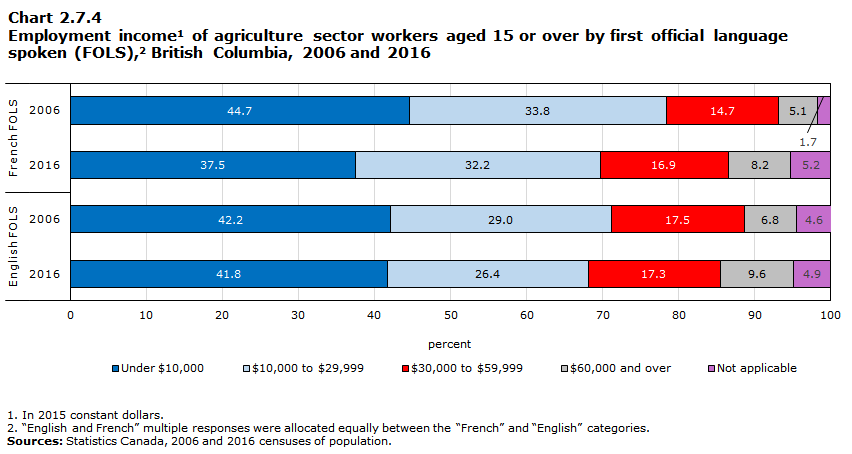
Data table for Chart 2.7.4
| Under $10,000 | $10,000 to $29,999 | $30,000 to $59,999 | $60,000 and over | Not applicable | |
|---|---|---|---|---|---|
| percent | |||||
| French FOLS | |||||
| 2006 | 44.7 | 33.8 | 14.7 | 5.1 | 1.7 |
| 2016 | 37.5 | 32.2 | 16.9 | 8.2 | 5.2 |
| English FOLS | |||||
| 2006 | 42.2 | 29.0 | 17.5 | 6.8 | 4.6 |
| 2016 | 41.8 | 26.4 | 17.3 | 9.6 | 4.9 |
|
|||||
In British Columbia, the median employment income of Francophone agricultural workers increased between 2006 ($10,650) and 2016 ($12,770). Therefore, the proportion of these workers who reported low employment income (below $10,000) decreased over the decade (from 44.7% in 2006 to 37.5% in 2016). While nearly one in five Francophone agricultural workers had employment income of $30,000 or more in 2006, this was the case for about one in four in 2016.
The median employment income of Anglophone agricultural workers increased very little between 2006 ($12,435) and 2016 ($12,795). The median employment income of Francophone and Anglophone agricultural workers was therefore very similar in 2016. However, about 42% of British Columbia’s Anglophone agricultural workers had employment income below $10,000 in 2016, compared with less than 38% of their Francophone counterparts.
The proportion of Francophone agricultural workers who worked full-time (78.0%) was higher than that of their Anglophone counterparts (69.6%) in 2016. However, the average number of weeks worked per year was slightly lower among Francophones (36.0) than among their Anglophone peers (38.5).
The gap in median employment income between Francophone men and women in the agriculture sector increased in British Columbia between 2006 and 2016, from $1,580 to $8,790. The median employment income of Francophone women working in the agriculture sector was $10,650 in 2006 and $8,920 in 2016, and that of Francophone men was $12,230 in 2006 and $17,710 in 2016.
2.8 Languages used at work
A small proportion of Francophone agricultural workers in Western Canada used only FrenchNote at work. This proportion was less than 4% in all Western provinces in 2016, except Manitoba. In this province, the proportion of Francophone agricultural workers who used only French at work increased from 10.9% to 13.6% between 2006 and 2016.
The proportion of Francophone agricultural workers who used English and FrenchNote at work was higher, although it decreased between 2006 and 2016. Over the decade, the proportion of Francophone agricultural workers who used both of these languages at work decreased from 50.7% to 46.3% in Manitoba, 26.6% to 18.1% in Saskatchewan, 40.9% to 37.3% in Alberta and 23.1% to 20.8% in British Columbia. At the same time, the proportion of Francophone agricultural workers who used only English at work increased in each of these provinces between 2006 and 2016, from 36.6% to 39.6% in Manitoba, 68.1% to 78.3% in Saskatchewan, 50.4% to 58.4% in Alberta, and 60.9% to 66.4% in British Columbia.
3. Social, economic and linguistic profile of French-speaking agri-food workers in Western Canada and the territories
This section tracks the evolution of the social, economic and linguistic profile of French-speaking agri-food workers in each Western province as well as the territories between 2006 and 2016.
In this report, agri-food workers include any person 15 years of age or older who worked in input and service supply
| Province or territories | FOLS | |||||||
|---|---|---|---|---|---|---|---|---|
| 2006 | 2016 | |||||||
| French | English | Neither English nor French |
Total | French | English | Neither English nor French |
Total | |
| number | ||||||||
| Manitoba | 2,150 | 71,745 | 605 | 74,500 | 1,695 | 77,295 | 1,630 | 80,620 |
| Saskatchewan | 645 | 63,450 | 230 | 64,325 | 600 | 65,975 | 740 | 67,315 |
| Alberta | 3,710 | 216,385 | 3,715 | 223,810 | 4,190 | 246,155 | 5,195 | 255,535 |
| British Columbia | 3,560 | 276,505 | 11,485 | 291,540 | 3,450 | 313,675 | 14,550 | 331,675 |
| Total: Western Canada | 10,065 | 628,075 | 16,030 | 654,175 | 9,930 | 703,100 | 22,120 | 735,145 |
| Territories | 140 | 4,220 | 70 | 4,430 | 135 | 5,520 | 70 | 5,725 |
| percent | ||||||||
| Manitoba | 2.9 | 96.3 | 0.8 | 100.0 | 2.1 | 95.9 | 2.0 | 100.0 |
| Saskatchewan | 1.0 | 98.6 | 0.4 | 100.0 | 0.9 | 98.0 | 1.1 | 100.0 |
| Alberta | 1.7 | 96.7 | 1.7 | 100.0 | 1.6 | 96.3 | 2.0 | 100.0 |
| British Columbia | 1.2 | 94.8 | 3.9 | 100.0 | 1.0 | 94.6 | 4.4 | 100.0 |
| Total: Western Canada | 1.5 | 96.0 | 2.5 | 100.0 | 1.4 | 95.6 | 3.0 | 100.0 |
| Territories | 3.1 | 95.3 | 1.6 | 100.0 | 2.3 | 96.5 | 1.2 | 100.0 |
Sources: Statistics Canada, 2006 and 2016 censuses of population. |
||||||||
The agri-food sector in Canada’s Western provinces employed a growing number of workers between 2006 (654,175 workers) and 2016 (735,145 workers). British Columbia is the province where the most agri-food workers (331,675) lived in 2016, followed by Alberta (255,535 workers). The number of agri-food workers also increased in the territories between 2006 (4,430) and 2016 (5,725).
Between 2006 and 2016, the number of Francophone agri-food workers in the Western provinces was relatively stable, going from 10,065 workers to 9,930 workers over the decade. Francophones accounted for 1.4% of the sector’s workers in 2016, compared with 1.5% in 2006.
In 2016, the province with the most Francophone agri-food workers was Alberta (4,190 workers). This province was the only one in Western Canada where the number of Francophone agri-food workers increased between 2006 and 2016. In 2016, there were 3,450 Francophone agri-food workers in British Columbia, 1,695 in Manitoba and 600 in Saskatchewan. Manitoba was the province with the highest proportion of Francophones among agri-food workers (2.1%) in 2016, followed by Alberta (1.6%). This proportion was about 1% in Saskatchewan and British Columbia.
The number of Francophone agri-food workers in the territories was relatively similar in 2006 (140 workers) and in 2016 (135 workers). In 2016, 2.3% of agri-food workers in the territories were Francophones.
For each province, there were some specificities with regards to changes in the number of agri-food workers between 2006 and 2016 as well as to the concentration of Francophone workers in certain census agricultural regions (CARs). Appendix C thus presents the number of Francophone and Anglophone agri-food workers by their CAR of residence for each Western province.
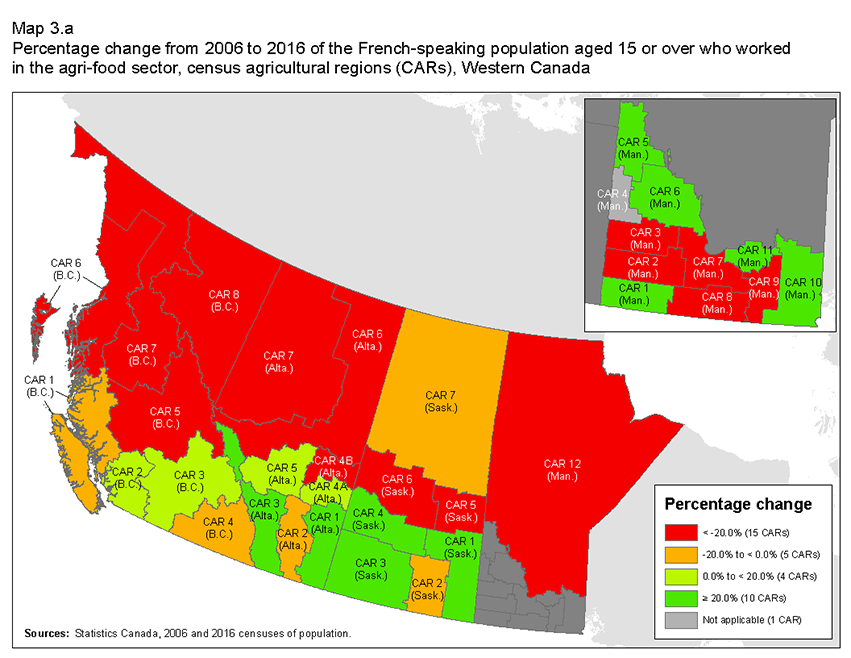
Description for Map 3.a
This map shows the percentage change from 2006 to 2016 of the French-speaking population aged 15 or over who worked in the agri-food sector, in each of Western Canada’s census agricultural regions.
On this map, five different colours are used to identify values. Grey represent census agricultural regions where the French-speaking population aged 15 or over who worked in the agri-food sector was too small to calculate its percentage change from 2006 to 2016. In this group, there is one census agricultural region.
Red represents census agricultural regions where the French-speaking population aged 15 or over who worked in the agri-food sector decreased by more than 20% between 2006 and 2016. In this group, there are 15 census agricultural regions.
Orange represents census agricultural regions where the French-speaking population aged 15 or over who worked in the agri-food sector decreased by 20 % or less between 2006 and 2016. In this group, there are five census agricultural regions.
Light green represents census agricultural regions where the French-speaking population aged 15 or over who worked in the agri-food sector increased by less than 20 % between 2006 and 2016. In this group, there are four census agricultural regions.
Dark green represents census agricultural regions where the French-speaking population aged 15 or over who worked in the agri-food sector increased by 20% or more between 2006 and 2016. In this group, there are ten census agricultural regions.
The borders of each census agricultural region are delineated by a grey line. Each census agricultural region is assigned a colour based on the table below.
| Census agricultural region | Percentage change |
|---|---|
| 4601 | 170.6 |
| 4602 | -24.8 |
| 4603 | -29.3 |
| 4605 | 321.0 |
| 4606 | 55.2 |
| 4607 | -40.4 |
| 4608 | -32.8 |
| 4609 | -20.7 |
| 4610 | 29.8 |
| 4611 | 45.2 |
| 4612 | -49.8 |
| 4701 | 25.4 |
| 4702 | -4.7 |
| 4703 | 153.5 |
| 4704 | 21.0 |
| 4705 | -26.1 |
| 4706 | -62.9 |
| 4707 | -15.8 |
| 4801 | 261.6 |
| 4802 | -11.5 |
| 4803 | 29.5 |
| 4804A | 19.1 |
| 4804B | -30.4 |
| 4805 | 19.9 |
| 4806 | -21.6 |
| 4807 | -32.0 |
| 5901 | -13.3 |
| 5902 | 2.1 |
| 5903 | 4.6 |
| 5904 | -9.6 |
| 5905 | -21.0 |
| 5906 | -55.6 |
| 5907 | -37.8 |
| 5908 | -42.0 |
Map 3.a shows that the number of Francophone agri-food workers decreased in 20 CARs in the Western provinces between 2006 and 2016. This decrease was of more than 20% in 15 CARs. In contrast, the number of Francophone
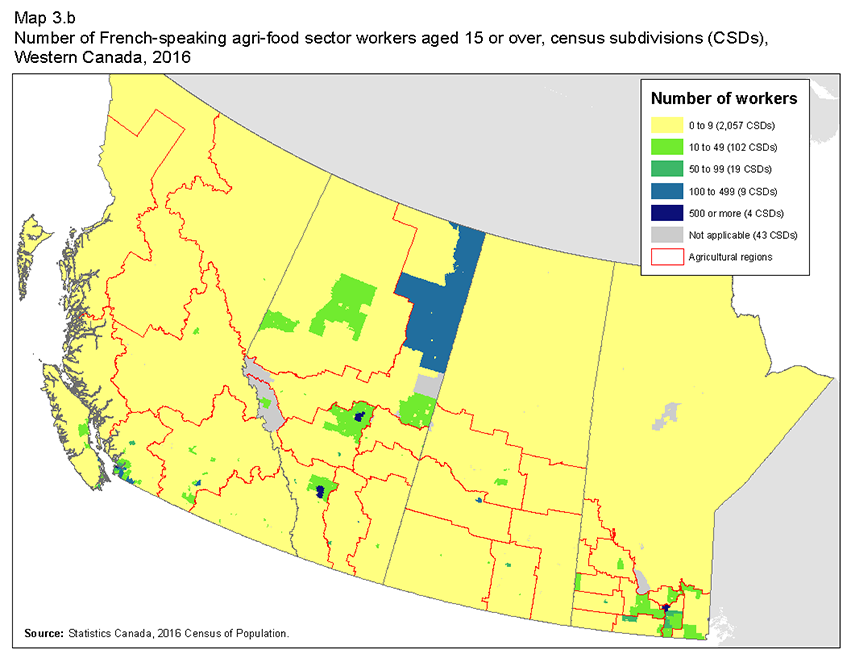
Description for Map 3.b
This map shows the number of French-speaking agri-food sector workers aged 15 or over in 2016 in each of Western Canada’s census subdivisions.
On this map, we use six different colours to identify values. Dark grey represents census subdivisions for which data is unavailable. In this group, there are 43 census subdivisions.
Yellow represents census subdivisions where there were between zero and nine French-speaking agri-food sector workers aged 15 or over in 2016. In this group, there are 2,057 census subdivisions.
Light green represents census subdivisions where there were between 10 and 49 French-speaking agri-food sector workers aged 15 or over in 2016. In this group, there are 102 census subdivisions.
Dark green represents census subdivisions where there were between 50 and 99 French-speaking agri-food sector workers aged 15 or over in 2016. In this group, there are 19 census subdivisions.
Light blue represents census subdivisions where there were between 100 and 499 French-speaking agri-food sector workers aged 15 or over in 2016. In this group, there are nine census subdivisions.
Dark blue represents census subdivisions where there were 500 or more French-speaking agri-food sector workers aged 15 or over in 2016. In this group, there are four census subdivisions.
The borders of each census agricultural region are delineated by a red line. Each census subdivision is assigned a colour based on the table below.
| Census subdivision | Number of workers |
|---|---|
| 4601035 | 0 |
| 4601039 | 10 |
| 4601043 | 0 |
| 4601046 | 0 |
| 4601051 | 0 |
| 4601057 | 5 |
| 4601060 | 0 |
| 4601070 | 0 |
| 4601071 | 10 |
| 4601075 | 0 |
| 4601078 | 0 |
| 4601094 | 0 |
| 4602024 | 15 |
| 4602026 | 0 |
| 4602027 | 0 |
| 4602032 | 50 |
| 4602037 | 30 |
| 4602041 | 15 |
| 4602044 | 15 |
| 4602046 | 0 |
| 4602053 | 25 |
| 4602057 | 25 |
| 4602061 | 20 |
| 4602069 | 50 |
| 4602075 | 50 |
| 4603030 | 25 |
| 4603040 | 5 |
| 4603041 | 0 |
| 4603047 | 0 |
| 4603050 | 0 |
| 4603053 | 0 |
| 4603058 | 0 |
| 4603062 | 0 |
| 4603065 | 0 |
| 4603067 | 10 |
| 4603072 | 0 |
| 4603074 | 0 |
| 4604034 | 0 |
| 4604040 | 0 |
| 4604052 | 0 |
| 4604057 | 0 |
| 4604064 | 50 |
| 4604068 | 0 |
| 4605025 | 0 |
| 4605032 | 0 |
| 4605038 | 0 |
| 4605044 | 0 |
| 4605052 | 0 |
| 4605056 | 0 |
| 4605062 | 0 |
| 4605071 | 0 |
| 4606016 | 0 |
| 4606023 | 0 |
| 4606029 | 0 |
| 4606031 | 0 |
| 4606034 | 0 |
| 4606040 | 0 |
| 4607039 | 0 |
| 4607046 | 0 |
| 4607052 | 0 |
| 4607057 | 0 |
| 4607060 | 5 |
| 4607062 | 55 |
| 4607066 | 0 |
| 4607068 | 0 |
| 4607071 | 0 |
| 4607076 | 0 |
| 4608032 | 20 |
| 4608042 | 0 |
| 4608046 | 0 |
| 4608055 | 0 |
| 4608060 | 0 |
| 4608069 | 0 |
| 4609018 | 40 |
| 4609024 | 10 |
| 4609025 | 0 |
| 4609026 | 0 |
| 4609027 | 0 |
| 4609029 | 5 |
| 4610035 | 15 |
| 4610043 | 0 |
| 4610052 | 0 |
| 4611040 | 870 |
| 4611042 | 0 |
| 4612047 | 5 |
| 4612054 | 5 |
| 4612056 | 0 |
| 4613032 | 0 |
| 4613037 | 0 |
| 4613043 | 10 |
| 4613047 | 0 |
| 4613049 | 0 |
| 4613056 | 10 |
| 4613062 | 0 |
| 4614015 | 0 |
| 4614031 | 5 |
| 4614036 | 0 |
| 4614039 | 5 |
| 4614042 | 0 |
| 4615020 | 0 |
| 4615032 | 0 |
| 4615037 | 0 |
| 4615042 | 0 |
| 4615047 | 10 |
| 4615049 | 0 |
| 4615056 | 0 |
| 4615063 | 0 |
| 4615067 | 0 |
| 4615070 | 0 |
| 4615071 | 0 |
| 4615072 | 0 |
| 4615074 | 0 |
| 4615075 | 0 |
| 4615078 | 0 |
| 4615092 | 0 |
| 4616005 | 0 |
| 4616017 | 0 |
| 4616020 | 0 |
| 4616025 | 0 |
| 4616030 | 0 |
| 4616046 | 0 |
| 4616048 | 0 |
| 4617026 | 0 |
| 4617029 | 0 |
| 4617035 | 0 |
| 4617041 | 30 |
| 4617048 | 0 |
| 4617050 | 0 |
| 4617054 | 0 |
| 4617058 | 0 |
| 4617064 | 0 |
| 4617072 | 0 |
| 4617075 | 0 |
| 4617092 | 0 |
| 4618031 | 0 |
| 4618034 | 0 |
| 4618037 | 0 |
| 4618040 | 0 |
| 4618044 | 0 |
| 4618055 | 0 |
| 4618056 | 0 |
| 4618060 | 0 |
| 4618063 | 0 |
| 4618067 | 0 |
| 4618068 | 0 |
| 4618074 | 0 |
| 4618076 | 0 |
| 4618091 | 0 |
| 4619045 | 0 |
| 4619050 | 0 |
| 4619051 | 0 |
| 4619052 | 0 |
| 4619053 | 0 |
| 4619054 | 0 |
| 4619056 | 0 |
| 4619058 | 0 |
| 4619059 | 0 |
| 4619061 | 0 |
| 4619065 | 0 |
| 4619068 | 0 |
| 4619069 | 0 |
| 4619070 | 0 |
| 4619071 | 0 |
| 4619072 | 0 |
| 4619075 | 0 |
| 4619077 | 0 |
| 4619079 | 0 |
| 4619082 | 0 |
| 4620032 | 0 |
| 4620042 | 0 |
| 4620048 | 0 |
| 4620051 | 0 |
| 4620055 | 0 |
| 4620066 | 0 |
| 4620069 | 0 |
| 4621025 | 0 |
| 4621027 | 0 |
| 4621029 | 0 |
| 4621033 | 0 |
| 4621034 | 0 |
| 4621035 | 0 |
| 4621040 | 0 |
| 4621043 | 0 |
| 4621045 | 0 |
| 4621052 | 0 |
| 4621058 | 0 |
| 4621064 | 0 |
| 4621071 | 0 |
| 4621078 | 0 |
| 4622026 | 5 |
| 4622046 | 0 |
| 4622048 | 0 |
| 4622049 | 0 |
| 4622050 | 0 |
| 4622051 | 0 |
| 4622052 | 0 |
| 4622055 | 0 |
| 4622056 | 0 |
| 4622058 | 0 |
| 4622059 | 0 |
| 4622063 | 0 |
| 4622064 | 0 |
| 4622065 | 0 |
| 4622067 | 0 |
| 4622800 | 0 |
| 4622801 | 0 |
| 4623022 | 0 |
| 4623027 | 0 |
| 4623034 | 0 |
| 4623037 | 0 |
| 4623039 | 0 |
| 4623047 | 0 |
| 4623056 | 0 |
| 4623058 | 0 |
| 4623062 | 0 |
| 4623064 | 0 |
| 4623065 | 0 |
| 4623067 | 0 |
| 4623071 | 0 |
| 4701001 | 0 |
| 4701002 | 0 |
| 4701004 | 0 |
| 4701006 | 0 |
| 4701008 | 0 |
| 4701011 | 0 |
| 4701012 | 0 |
| 4701014 | 0 |
| 4701016 | 0 |
| 4701017 | 0 |
| 4701018 | 0 |
| 4701019 | 0 |
| 4701021 | 0 |
| 4701022 | 0 |
| 4701024 | 0 |
| 4701027 | 0 |
| 4701031 | 0 |
| 4701032 | 0 |
| 4701036 | 0 |
| 4701037 | 0 |
| 4701039 | 0 |
| 4701041 | 0 |
| 4701043 | 0 |
| 4701044 | 0 |
| 4701047 | 0 |
| 4701049 | 5 |
| 4701053 | 0 |
| 4701054 | 0 |
| 4701056 | 0 |
| 4701058 | 0 |
| 4701059 | 0 |
| 4701061 | 0 |
| 4701063 | 0 |
| 4701064 | 0 |
| 4701066 | 0 |
| 4701067 | 0 |
| 4701069 | 0 |
| 4701072 | 0 |
| 4701076 | 0 |
| 4701077 | 0 |
| 4701078 | 0 |
| 4701079 | 0 |
| 4701091 | 0 |
| 4701094 | 0 |
| 4701096 | 0 |
| 4701098 | 0 |
| 4701808 | 0 |
| 4701809 | 0 |
| 4701817 | 0 |
| 4701818 | 0 |
| 4701819 | 0 |
| 4702001 | 0 |
| 4702002 | 0 |
| 4702006 | 0 |
| 4702008 | 0 |
| 4702011 | 0 |
| 4702012 | 0 |
| 4702014 | 0 |
| 4702016 | 0 |
| 4702018 | 0 |
| 4702023 | 0 |
| 4702024 | 0 |
| 4702026 | 0 |
| 4702028 | 0 |
| 4702029 | 0 |
| 4702031 | 0 |
| 4702033 | 0 |
| 4702036 | 0 |
| 4702037 | 0 |
| 4702038 | 0 |
| 4702039 | 0 |
| 4702041 | 0 |
| 4702042 | 0 |
| 4702044 | 0 |
| 4702047 | 10 |
| 4702048 | 0 |
| 4702051 | 0 |
| 4702052 | 0 |
| 4702054 | 0 |
| 4702057 | 0 |
| 4702058 | 0 |
| 4702061 | 0 |
| 4702062 | 0 |
| 4702066 | 0 |
| 4702067 | 0 |
| 4702069 | 0 |
| 4702071 | 0 |
| 4702072 | 0 |
| 4702073 | 0 |
| 4702076 | 0 |
| 4702077 | 0 |
| 4702078 | 0 |
| 4702079 | 0 |
| 4703001 | 0 |
| 4703004 | 0 |
| 4703006 | 0 |
| 4703009 | 0 |
| 4703011 | 0 |
| 4703012 | 0 |
| 4703016 | 0 |
| 4703018 | 0 |
| 4703019 | 0 |
| 4703022 | 0 |
| 4703026 | 0 |
| 4703028 | 10 |
| 4703029 | 0 |
| 4703034 | 0 |
| 4703036 | 5 |
| 4703038 | 0 |
| 4703041 | 0 |
| 4703042 | 0 |
| 4703044 | 0 |
| 4703048 | 0 |
| 4703051 | 0 |
| 4703052 | 0 |
| 4703054 | 5 |
| 4703058 | 5 |
| 4703059 | 0 |
| 4703061 | 0 |
| 4703062 | 5 |
| 4703064 | 0 |
| 4703068 | 0 |
| 4703071 | 25 |
| 4703074 | 0 |
| 4703092 | 0 |
| 4703093 | 0 |
| 4703096 | 0 |
| 4703801 | 0 |
| 4704002 | 0 |
| 4704003 | 0 |
| 4704006 | 0 |
| 4704008 | 0 |
| 4704009 | 0 |
| 4704011 | 0 |
| 4704012 | 0 |
| 4704019 | 0 |
| 4704021 | 0 |
| 4704024 | 0 |
| 4704026 | 0 |
| 4704028 | 0 |
| 4704029 | 0 |
| 4704034 | 0 |
| 4704036 | 0 |
| 4704038 | 0 |
| 4704045 | 0 |
| 4704048 | 0 |
| 4704050 | 0 |
| 4704054 | 0 |
| 4704056 | 0 |
| 4704058 | 0 |
| 4704061 | 0 |
| 4704802 | 0 |
| 4705001 | 0 |
| 4705002 | 0 |
| 4705004 | 0 |
| 4705006 | 0 |
| 4705007 | 0 |
| 4705009 | 0 |
| 4705011 | 0 |
| 4705014 | 0 |
| 4705016 | 0 |
| 4705018 | 0 |
| 4705019 | 0 |
| 4705021 | 0 |
| 4705024 | 0 |
| 4705027 | 0 |
| 4705028 | 0 |
| 4705029 | 0 |
| 4705031 | 0 |
| 4705033 | 0 |
| 4705034 | 0 |
| 4705037 | 0 |
| 4705038 | 0 |
| 4705041 | 0 |
| 4705042 | 0 |
| 4705043 | 0 |
| 4705044 | 0 |
| 4705047 | 0 |
| 4705048 | 0 |
| 4705049 | 0 |
| 4705051 | 0 |
| 4705052 | 0 |
| 4705053 | 0 |
| 4705054 | 0 |
| 4705055 | 0 |
| 4705056 | 0 |
| 4705057 | 0 |
| 4705058 | 0 |
| 4705059 | 0 |
| 4705061 | 0 |
| 4705062 | 0 |
| 4705063 | 0 |
| 4705064 | 0 |
| 4705066 | 0 |
| 4705067 | 0 |
| 4705068 | 0 |
| 4705069 | 0 |
| 4705071 | 0 |
| 4705073 | 0 |
| 4705074 | 0 |
| 4705077 | 0 |
| 4705078 | 0 |
| 4705079 | 0 |
| 4705093 | 0 |
| 4705094 | 0 |
| 4705096 | 0 |
| 4705803 | 0 |
| 4705804 | 0 |
| 4705805 | 0 |
| 4705806 | 0 |
| 4705807 | 0 |
| 4705808 | 0 |
| 4706001 | 0 |
| 4706002 | 0 |
| 4706003 | 0 |
| 4706004 | 0 |
| 4706006 | 0 |
| 4706007 | 0 |
| 4706008 | 0 |
| 4706009 | 0 |
| 4706011 | 0 |
| 4706013 | 0 |
| 4706014 | 0 |
| 4706016 | 0 |
| 4706017 | 0 |
| 4706018 | 0 |
| 4706019 | 0 |
| 4706021 | 0 |
| 4706022 | 0 |
| 4706023 | 0 |
| 4706026 | 0 |
| 4706027 | 95 |
| 4706028 | 0 |
| 4706029 | 0 |
| 4706030 | 0 |
| 4706031 | 0 |
| 4706032 | 0 |
| 4706033 | 0 |
| 4706034 | 0 |
| 4706036 | 0 |
| 4706037 | 0 |
| 4706038 | 0 |
| 4706039 | 0 |
| 4706041 | 0 |
| 4706042 | 0 |
| 4706045 | 0 |
| 4706046 | 0 |
| 4706047 | 0 |
| 4706048 | 0 |
| 4706049 | 0 |
| 4706050 | 0 |
| 4706051 | 0 |
| 4706052 | 0 |
| 4706053 | 0 |
| 4706054 | 0 |
| 4706055 | 0 |
| 4706056 | 0 |
| 4706058 | 0 |
| 4706059 | 0 |
| 4706060 | 0 |
| 4706061 | 0 |
| 4706062 | 0 |
| 4706063 | 0 |
| 4706064 | 0 |
| 4706065 | 0 |
| 4706067 | 0 |
| 4706068 | 0 |
| 4706069 | 0 |
| 4706070 | 0 |
| 4706071 | 0 |
| 4706072 | 0 |
| 4706073 | 0 |
| 4706074 | 0 |
| 4706075 | 0 |
| 4706076 | 0 |
| 4706077 | 0 |
| 4706078 | 0 |
| 4706079 | 0 |
| 4706080 | 0 |
| 4706081 | 0 |
| 4706082 | 0 |
| 4706085 | 0 |
| 4706091 | 0 |
| 4706092 | 0 |
| 4706093 | 0 |
| 4706094 | 0 |
| 4706096 | 0 |
| 4706097 | 0 |
| 4706098 | 0 |
| 4706099 | 0 |
| 4706809 | 0 |
| 4706810 | 0 |
| 4706811 | 0 |
| 4706812 | 0 |
| 4706813 | 0 |
| 4706814 | 0 |
| 4706815 | 0 |
| 4706816 | 0 |
| 4706818 | 0 |
| 4706820 | 0 |
| 4706828 | 0 |
| 4706829 | 0 |
| 4707001 | 0 |
| 4707004 | 0 |
| 4707006 | 0 |
| 4707008 | 0 |
| 4707011 | 0 |
| 4707012 | 0 |
| 4707014 | 0 |
| 4707016 | 0 |
| 4707018 | 0 |
| 4707020 | 0 |
| 4707021 | 0 |
| 4707022 | 0 |
| 4707023 | 0 |
| 4707024 | 0 |
| 4707026 | 0 |
| 4707027 | 0 |
| 4707028 | 0 |
| 4707029 | 0 |
| 4707031 | 0 |
| 4707032 | 0 |
| 4707034 | 0 |
| 4707036 | 0 |
| 4707037 | 0 |
| 4707038 | 0 |
| 4707039 | 15 |
| 4707042 | 0 |
| 4707043 | 0 |
| 4707044 | 0 |
| 4707045 | 0 |
| 4707046 | 0 |
| 4707047 | 0 |
| 4707048 | 0 |
| 4707049 | 0 |
| 4707051 | 0 |
| 4707053 | 0 |
| 4707054 | 0 |
| 4707058 | 0 |
| 4707059 | 0 |
| 4707062 | 0 |
| 4707063 | 0 |
| 4707066 | 0 |
| 4707067 | 0 |
| 4707068 | 0 |
| 4707071 | 0 |
| 4707072 | 0 |
| 4707074 | 0 |
| 4707076 | 0 |
| 4707077 | 0 |
| 4707091 | 0 |
| 4707092 | 0 |
| 4707093 | 0 |
| 4708001 | 0 |
| 4708004 | 10 |
| 4708006 | 0 |
| 4708008 | 0 |
| 4708009 | 0 |
| 4708011 | 0 |
| 4708012 | 0 |
| 4708016 | 0 |
| 4708018 | 0 |
| 4708021 | 0 |
| 4708022 | 0 |
| 4708024 | 0 |
| 4708026 | 0 |
| 4708028 | 0 |
| 4708029 | 0 |
| 4708031 | 0 |
| 4708032 | 0 |
| 4708034 | 0 |
| 4708036 | 0 |
| 4708038 | 0 |
| 4708039 | 0 |
| 4708042 | 0 |
| 4708044 | 0 |
| 4708046 | 0 |
| 4708048 | 0 |
| 4708049 | 0 |
| 4708053 | 0 |
| 4708054 | 0 |
| 4708056 | 0 |
| 4708057 | 0 |
| 4708058 | 0 |
| 4708059 | 0 |
| 4708061 | 0 |
| 4708062 | 0 |
| 4708065 | 0 |
| 4708068 | 0 |
| 4708071 | 0 |
| 4708074 | 0 |
| 4708076 | 0 |
| 4708092 | 5 |
| 4708094 | 0 |
| 4709001 | 0 |
| 4709002 | 0 |
| 4709006 | 0 |
| 4709009 | 0 |
| 4709011 | 0 |
| 4709012 | 0 |
| 4709014 | 0 |
| 4709016 | 0 |
| 4709019 | 0 |
| 4709023 | 0 |
| 4709024 | 0 |
| 4709028 | 0 |
| 4709029 | 0 |
| 4709032 | 0 |
| 4709033 | 0 |
| 4709037 | 0 |
| 4709038 | 0 |
| 4709039 | 0 |
| 4709042 | 0 |
| 4709044 | 0 |
| 4709046 | 0 |
| 4709049 | 0 |
| 4709053 | 0 |
| 4709054 | 0 |
| 4709056 | 0 |
| 4709058 | 0 |
| 4709060 | 0 |
| 4709061 | 0 |
| 4709062 | 0 |
| 4709064 | 0 |
| 4709065 | 0 |
| 4709066 | 0 |
| 4709067 | 0 |
| 4709069 | 0 |
| 4709071 | 0 |
| 4709072 | 0 |
| 4709075 | 0 |
| 4709076 | 0 |
| 4709819 | 0 |
| 4709820 | 0 |
| 4709821 | 0 |
| 4709822 | 0 |
| 4709832 | 0 |
| 4710002 | 0 |
| 4710003 | 0 |
| 4710004 | 0 |
| 4710008 | 0 |
| 4710009 | 0 |
| 4710011 | 0 |
| 4710012 | 0 |
| 4710014 | 0 |
| 4710022 | 0 |
| 4710024 | 0 |
| 4710027 | 0 |
| 4710028 | 0 |
| 4710029 | 0 |
| 4710031 | 0 |
| 4710035 | 0 |
| 4710036 | 0 |
| 4710038 | 0 |
| 4710041 | 0 |
| 4710043 | 0 |
| 4710046 | 0 |
| 4710047 | 0 |
| 4710052 | 0 |
| 4710054 | 0 |
| 4710056 | 0 |
| 4710058 | 0 |
| 4710061 | 0 |
| 4710062 | 0 |
| 4710064 | 0 |
| 4710066 | 0 |
| 4710068 | 5 |
| 4710071 | 0 |
| 4710072 | 0 |
| 4710822 | 0 |
| 4710823 | 0 |
| 4710824 | 0 |
| 4710825 | 0 |
| 4710826 | 0 |
| 4710828 | 0 |
| 4710836 | 0 |
| 4710838 | 0 |
| 4710840 | 0 |
| 4710849 | 0 |
| 4711002 | 0 |
| 4711003 | 0 |
| 4711004 | 0 |
| 4711006 | 0 |
| 4711007 | 0 |
| 4711008 | 0 |
| 4711009 | 0 |
| 4711011 | 0 |
| 4711014 | 0 |
| 4711016 | 0 |
| 4711018 | 0 |
| 4711019 | 0 |
| 4711021 | 0 |
| 4711022 | 0 |
| 4711024 | 0 |
| 4711026 | 0 |
| 4711027 | 5 |
| 4711028 | 0 |
| 4711029 | 0 |
| 4711031 | 0 |
| 4711032 | 0 |
| 4711034 | 0 |
| 4711036 | 0 |
| 4711038 | 0 |
| 4711039 | 0 |
| 4711041 | 0 |
| 4711042 | 0 |
| 4711044 | 0 |
| 4711046 | 0 |
| 4711048 | 0 |
| 4711049 | 0 |
| 4711052 | 0 |
| 4711053 | 0 |
| 4711054 | 0 |
| 4711056 | 0 |
| 4711058 | 0 |
| 4711059 | 0 |
| 4711060 | 0 |
| 4711061 | 0 |
| 4711063 | 0 |
| 4711064 | 0 |
| 4711065 | 0 |
| 4711066 | 165 |
| 4711067 | 0 |
| 4711068 | 5 |
| 4711069 | 0 |
| 4711070 | 0 |
| 4711071 | 0 |
| 4711072 | 0 |
| 4711073 | 0 |
| 4711075 | 0 |
| 4711076 | 0 |
| 4711077 | 0 |
| 4711078 | 0 |
| 4711079 | 0 |
| 4711091 | 0 |
| 4711092 | 0 |
| 4711094 | 0 |
| 4711096 | 0 |
| 4711828 | 0 |
| 4712001 | 0 |
| 4712004 | 0 |
| 4712006 | 0 |
| 4712008 | 0 |
| 4712011 | 0 |
| 4712012 | 0 |
| 4712014 | 0 |
| 4712016 | 0 |
| 4712019 | 0 |
| 4712020 | 0 |
| 4712022 | 0 |
| 4712026 | 0 |
| 4712029 | 0 |
| 4712031 | 0 |
| 4712032 | 0 |
| 4712034 | 0 |
| 4712038 | 0 |
| 4712042 | 0 |
| 4712046 | 0 |
| 4712050 | 0 |
| 4712051 | 0 |
| 4712052 | 0 |
| 4712054 | 0 |
| 4712056 | 0 |
| 4712058 | 0 |
| 4712059 | 0 |
| 4712064 | 0 |
| 4712069 | 0 |
| 4712072 | 0 |
| 4712078 | 0 |
| 4712079 | 0 |
| 4712829 | 0 |
| 4712830 | 0 |
| 4712832 | 0 |
| 4712833 | 0 |
| 4712837 | 0 |
| 4713002 | 0 |
| 4713004 | 0 |
| 4713006 | 0 |
| 4713008 | 0 |
| 4713009 | 0 |
| 4713011 | 0 |
| 4713014 | 0 |
| 4713016 | 0 |
| 4713019 | 0 |
| 4713021 | 0 |
| 4713022 | 0 |
| 4713024 | 0 |
| 4713026 | 0 |
| 4713028 | 0 |
| 4713029 | 0 |
| 4713031 | 0 |
| 4713032 | 0 |
| 4713038 | 0 |
| 4713039 | 0 |
| 4713041 | 0 |
| 4713042 | 0 |
| 4713044 | 0 |
| 4713046 | 0 |
| 4713049 | 0 |
| 4713051 | 0 |
| 4713053 | 0 |
| 4713054 | 0 |
| 4713056 | 0 |
| 4713059 | 0 |
| 4713062 | 0 |
| 4713064 | 0 |
| 4713067 | 5 |
| 4713068 | 0 |
| 4713069 | 0 |
| 4713072 | 0 |
| 4713074 | 0 |
| 4713076 | 0 |
| 4713078 | 0 |
| 4713079 | 0 |
| 4713091 | 0 |
| 4713092 | 0 |
| 4713094 | 0 |
| 4713096 | 0 |
| 4713098 | 0 |
| 4713835 | 0 |
| 4713836 | 0 |
| 4714001 | 0 |
| 4714004 | 0 |
| 4714006 | 0 |
| 4714007 | 0 |
| 4714009 | 0 |
| 4714021 | 0 |
| 4714022 | 0 |
| 4714023 | 0 |
| 4714024 | 0 |
| 4714025 | 0 |
| 4714026 | 0 |
| 4714028 | 0 |
| 4714030 | 0 |
| 4714032 | 0 |
| 4714034 | 0 |
| 4714035 | 0 |
| 4714036 | 0 |
| 4714038 | 0 |
| 4714039 | 0 |
| 4714041 | 0 |
| 4714043 | 0 |
| 4714044 | 0 |
| 4714047 | 0 |
| 4714048 | 0 |
| 4714049 | 0 |
| 4714051 | 0 |
| 4714053 | 0 |
| 4714056 | 0 |
| 4714058 | 0 |
| 4714059 | 0 |
| 4714061 | 0 |
| 4714062 | 0 |
| 4714067 | 0 |
| 4714068 | 0 |
| 4714069 | 0 |
| 4714072 | 0 |
| 4714073 | 0 |
| 4714074 | 0 |
| 4714076 | 0 |
| 4714077 | 0 |
| 4714079 | 0 |
| 4714091 | 0 |
| 4714092 | 0 |
| 4714093 | 0 |
| 4714839 | 0 |
| 4714840 | 0 |
| 4714841 | 0 |
| 4714842 | 0 |
| 4714843 | 0 |
| 4714845 | 0 |
| 4715001 | 0 |
| 4715002 | 0 |
| 4715003 | 0 |
| 4715004 | 0 |
| 4715005 | 0 |
| 4715006 | 0 |
| 4715007 | 0 |
| 4715008 | 0 |
| 4715011 | 0 |
| 4715012 | 0 |
| 4715014 | 0 |
| 4715016 | 0 |
| 4715017 | 0 |
| 4715018 | 0 |
| 4715019 | 0 |
| 4715026 | 0 |
| 4715027 | 0 |
| 4715028 | 0 |
| 4715029 | 0 |
| 4715031 | 0 |
| 4715032 | 0 |
| 4715034 | 0 |
| 4715036 | 0 |
| 4715038 | 0 |
| 4715039 | 0 |
| 4715041 | 0 |
| 4715042 | 0 |
| 4715043 | 0 |
| 4715044 | 0 |
| 4715045 | 0 |
| 4715046 | 0 |
| 4715047 | 0 |
| 4715048 | 0 |
| 4715049 | 0 |
| 4715051 | 0 |
| 4715052 | 0 |
| 4715054 | 0 |
| 4715057 | 20 |
| 4715059 | 0 |
| 4715061 | 0 |
| 4715062 | 0 |
| 4715064 | 0 |
| 4715066 | 20 |
| 4715067 | 0 |
| 4715068 | 0 |
| 4715070 | 0 |
| 4715071 | 0 |
| 4715072 | 0 |
| 4715074 | 0 |
| 4715075 | 0 |
| 4715076 | 0 |
| 4715079 | 0 |
| 4715085 | 0 |
| 4715091 | 0 |
| 4715092 | 0 |
| 4715094 | 0 |
| 4715098 | 0 |
| 4715099 | 0 |
| 4715844 | 0 |
| 4715845 | 0 |
| 4715847 | 0 |
| 4715848 | 0 |
| 4715849 | 0 |
| 4715850 | 0 |
| 4715851 | 0 |
| 4715853 | 0 |
| 4715857 | 0 |
| 4715859 | 0 |
| 4715862 | 0 |
| 4716002 | 0 |
| 4716003 | 0 |
| 4716004 | 0 |
| 4716005 | 0 |
| 4716008 | 0 |
| 4716009 | 0 |
| 4716011 | 0 |
| 4716013 | 0 |
| 4716014 | 0 |
| 4716016 | 0 |
| 4716018 | 0 |
| 4716019 | 0 |
| 4716022 | 0 |
| 4716023 | 0 |
| 4716024 | 0 |
| 4716026 | 0 |
| 4716027 | 0 |
| 4716028 | 0 |
| 4716029 | 10 |
| 4716033 | 0 |
| 4716038 | 0 |
| 4716041 | 0 |
| 4716042 | 0 |
| 4716043 | 0 |
| 4716044 | 0 |
| 4716046 | 0 |
| 4716047 | 0 |
| 4716051 | 0 |
| 4716052 | 0 |
| 4716053 | 0 |
| 4716054 | 5 |
| 4716056 | 0 |
| 4716057 | 0 |
| 4716058 | 0 |
| 4716059 | 0 |
| 4716060 | 0 |
| 4716061 | 0 |
| 4716062 | 0 |
| 4716063 | 0 |
| 4716072 | 0 |
| 4716075 | 0 |
| 4716077 | 0 |
| 4716854 | 0 |
| 4716855 | 0 |
| 4716856 | 0 |
| 4716857 | 0 |
| 4716858 | 0 |
| 4716860 | 0 |
| 4716861 | 0 |
| 4716862 | 0 |
| 4716863 | 0 |
| 4716880 | 0 |
| 4716882 | 0 |
| 4716888 | 0 |
| 4716894 | 0 |
| 4717001 | 0 |
| 4717002 | 0 |
| 4717004 | 0 |
| 4717005 | 0 |
| 4717006 | 0 |
| 4717008 | 0 |
| 4717011 | 0 |
| 4717013 | 0 |
| 4717014 | 0 |
| 4717017 | 0 |
| 4717018 | 0 |
| 4717019 | 0 |
| 4717022 | 0 |
| 4717024 | 0 |
| 4717026 | 0 |
| 4717028 | 0 |
| 4717029 | 0 |
| 4717032 | 0 |
| 4717034 | 0 |
| 4717036 | 0 |
| 4717039 | 0 |
| 4717041 | 0 |
| 4717042 | 0 |
| 4717045 | 0 |
| 4717047 | 0 |
| 4717048 | 0 |
| 4717052 | 0 |
| 4717054 | 0 |
| 4717055 | 0 |
| 4717056 | 0 |
| 4717057 | 0 |
| 4717058 | 0 |
| 4717062 | 0 |
| 4717066 | 0 |
| 4717067 | 0 |
| 4717801 | 0 |
| 4717802 | 0 |
| 4717803 | 0 |
| 4717804 | 0 |
| 4717805 | 0 |
| 4717806 | 0 |
| 4717807 | 0 |
| 4717808 | 0 |
| 4717809 | 0 |
| 4717810 | 0 |
| 4717811 | 0 |
| 4717812 | 0 |
| 4717813 | 0 |
| 4717815 | 0 |
| 4717816 | 0 |
| 4718005 | 0 |
| 4718012 | 0 |
| 4718015 | 0 |
| 4718021 | 0 |
| 4718023 | 0 |
| 4718028 | 0 |
| 4718030 | 0 |
| 4718033 | 0 |
| 4718041 | 0 |
| 4718042 | 0 |
| 4718049 | 0 |
| 4718051 | 0 |
| 4718052 | 0 |
| 4718055 | 0 |
| 4718058 | 0 |
| 4718062 | 0 |
| 4718065 | 0 |
| 4718067 | 0 |
| 4718069 | 0 |
| 4718070 | 0 |
| 4718071 | 0 |
| 4718072 | 0 |
| 4718074 | 0 |
| 4718075 | 0 |
| 4718090 | 0 |
| 4718100 | 0 |
| 4718801 | 0 |
| 4718802 | 0 |
| 4718803 | 0 |
| 4718806 | 0 |
| 4718807 | 0 |
| 4718808 | 0 |
| 4718809 | 0 |
| 4718811 | 0 |
| 4718812 | 0 |
| 4718814 | 0 |
| 4718817 | 0 |
| 4718818 | 0 |
| 4718819 | 0 |
| 4718820 | 0 |
| 4718821 | 0 |
| 4718822 | 0 |
| 4718824 | 0 |
| 4718825 | 0 |
| 4718826 | 0 |
| 4718828 | 0 |
| 4718829 | 0 |
| 4718831 | 0 |
| 4718832 | 0 |
| 4718839 | 0 |
| 4718852 | 0 |
| 4718854 | 0 |
| 4801003 | 0 |
| 4801006 | 15 |
| 4801008 | 0 |
| 4801009 | 0 |
| 4801014 | 0 |
| 4801018 | 0 |
| 4802001 | 0 |
| 4802002 | 0 |
| 4802004 | 0 |
| 4802006 | 0 |
| 4802008 | 0 |
| 4802009 | 0 |
| 4802011 | 0 |
| 4802012 | 95 |
| 4802013 | 0 |
| 4802014 | 0 |
| 4802016 | 0 |
| 4802018 | 0 |
| 4802019 | 0 |
| 4802021 | 0 |
| 4802022 | 0 |
| 4802023 | 0 |
| 4802029 | 0 |
| 4802031 | 0 |
| 4802034 | 100 |
| 4802036 | 0 |
| 4802038 | 0 |
| 4802039 | 0 |
| 4803001 | 0 |
| 4803002 | 0 |
| 4803003 | 0 |
| 4803004 | 0 |
| 4803006 | 0 |
| 4803008 | 0 |
| 4803011 | 0 |
| 4803014 | 0 |
| 4803016 | 0 |
| 4803018 | 5 |
| 4803019 | 5 |
| 4803021 | 0 |
| 4803022 | 0 |
| 4803024 | 0 |
| 4803026 | 0 |
| 4803801 | 0 |
| 4803802 | 0 |
| 4804001 | 0 |
| 4804004 | 0 |
| 4804006 | 0 |
| 4804011 | 0 |
| 4804012 | 0 |
| 4804014 | 0 |
| 4804016 | 0 |
| 4804019 | 0 |
| 4804020 | 0 |
| 4804021 | 0 |
| 4804022 | 0 |
| 4805001 | 0 |
| 4805002 | 0 |
| 4805004 | 0 |
| 4805006 | 0 |
| 4805008 | 0 |
| 4805009 | 0 |
| 4805011 | 0 |
| 4805012 | 5 |
| 4805018 | 0 |
| 4805019 | 0 |
| 4805021 | 0 |
| 4805022 | 0 |
| 4805026 | 0 |
| 4805031 | 0 |
| 4805034 | 0 |
| 4805036 | 0 |
| 4805038 | 0 |
| 4805041 | 0 |
| 4805042 | 0 |
| 4805044 | 0 |
| 4805046 | 0 |
| 4805048 | 5 |
| 4805049 | 0 |
| 4805802 | 0 |
| 4806001 | 5 |
| 4806006 | 0 |
| 4806008 | 10 |
| 4806009 | 0 |
| 4806011 | 0 |
| 4806012 | 15 |
| 4806014 | 20 |
| 4806016 | 1350 |
| 4806017 | 10 |
| 4806019 | 10 |
| 4806021 | 45 |
| 4806022 | 0 |
| 4806024 | 0 |
| 4806026 | 0 |
| 4806028 | 5 |
| 4806029 | 0 |
| 4806031 | 0 |
| 4806032 | 0 |
| 4806034 | 0 |
| 4806036 | 0 |
| 4806803 | 0 |
| 4806804 | 5 |
| 4807001 | 0 |
| 4807002 | 0 |
| 4807004 | 0 |
| 4807006 | 0 |
| 4807008 | 0 |
| 4807011 | 0 |
| 4807012 | 0 |
| 4807014 | 0 |
| 4807016 | 0 |
| 4807019 | 0 |
| 4807021 | 0 |
| 4807022 | 0 |
| 4807024 | 0 |
| 4807026 | 0 |
| 4807027 | 0 |
| 4807028 | 0 |
| 4807029 | 0 |
| 4807031 | 0 |
| 4807032 | 0 |
| 4807036 | 0 |
| 4807038 | 0 |
| 4807039 | 0 |
| 4807042 | 0 |
| 4807044 | 0 |
| 4807046 | 0 |
| 4807048 | 0 |
| 4807049 | 0 |
| 4807051 | 0 |
| 4807052 | 0 |
| 4807054 | 15 |
| 4807056 | 0 |
| 4808001 | 5 |
| 4808002 | 0 |
| 4808004 | 0 |
| 4808005 | 0 |
| 4808006 | 0 |
| 4808008 | 0 |
| 4808009 | 0 |
| 4808011 | 90 |
| 4808012 | 0 |
| 4808013 | 0 |
| 4808022 | 5 |
| 4808023 | 0 |
| 4808024 | 0 |
| 4808025 | 0 |
| 4808026 | 0 |
| 4808027 | 0 |
| 4808028 | 0 |
| 4808029 | 5 |
| 4808031 | 5 |
| 4808032 | 0 |
| 4808034 | 0 |
| 4808038 | 0 |
| 4808039 | 0 |
| 4808042 | 0 |
| 4808044 | 0 |
| 4808811 | 0 |
| 4808812 | 0 |
| 4808813 | 0 |
| 4809002 | 0 |
| 4809010 | 0 |
| 4809015 | 0 |
| 4809806 | 0 |
| 4809809 | 0 |
| 4809810 | 0 |
| 4810001 | 0 |
| 4810002 | 0 |
| 4810003 | 0 |
| 4810004 | 0 |
| 4810006 | 0 |
| 4810009 | 0 |
| 4810011 | 15 |
| 4810012 | 0 |
| 4810014 | 0 |
| 4810016 | 5 |
| 4810018 | 0 |
| 4810019 | 0 |
| 4810021 | 0 |
| 4810022 | 0 |
| 4810026 | 0 |
| 4810028 | 0 |
| 4810031 | 0 |
| 4810034 | 0 |
| 4810036 | 0 |
| 4810038 | 0 |
| 4810039 | 10 |
| 4810041 | 0 |
| 4810042 | 0 |
| 4810044 | 0 |
| 4810046 | 0 |
| 4810048 | 0 |
| 4810051 | 0 |
| 4810052 | 0 |
| 4810056 | 0 |
| 4810058 | 0 |
| 4810059 | 0 |
| 4810061 | 0 |
| 4810062 | 0 |
| 4810064 | 0 |
| 4810066 | 0 |
| 4810805 | 0 |
| 4811001 | 15 |
| 4811002 | 5 |
| 4811003 | 0 |
| 4811004 | 0 |
| 4811005 | 0 |
| 4811006 | 0 |
| 4811007 | 0 |
| 4811008 | 0 |
| 4811009 | 0 |
| 4811011 | 0 |
| 4811012 | 20 |
| 4811013 | 20 |
| 4811016 | 20 |
| 4811018 | 10 |
| 4811019 | 0 |
| 4811020 | 0 |
| 4811021 | 0 |
| 4811022 | 0 |
| 4811023 | 0 |
| 4811024 | 0 |
| 4811026 | 0 |
| 4811031 | 0 |
| 4811032 | 0 |
| 4811034 | 20 |
| 4811038 | 0 |
| 4811039 | 0 |
| 4811041 | 0 |
| 4811042 | 0 |
| 4811045 | 0 |
| 4811046 | 0 |
| 4811048 | 15 |
| 4811049 | 45 |
| 4811052 | 25 |
| 4811056 | 20 |
| 4811059 | 40 |
| 4811061 | 1140 |
| 4811062 | 75 |
| 4811064 | 0 |
| 4811065 | 0 |
| 4811066 | 0 |
| 4811068 | 10 |
| 4811069 | 0 |
| 4811801 | 0 |
| 4811802 | 0 |
| 4811803 | 0 |
| 4811804 | 0 |
| 4811805 | 0 |
| 4811806 | 0 |
| 4811807 | 0 |
| 4812002 | 20 |
| 4812004 | 25 |
| 4812009 | 5 |
| 4812011 | 0 |
| 4812012 | 0 |
| 4812013 | 0 |
| 4812014 | 15 |
| 4812016 | 0 |
| 4812018 | 15 |
| 4812020 | 0 |
| 4812022 | 0 |
| 4812024 | 0 |
| 4812026 | 0 |
| 4812029 | 0 |
| 4812037 | 5 |
| 4812802 | 0 |
| 4812804 | 0 |
| 4812808 | 0 |
| 4812810 | 0 |
| 4812811 | 0 |
| 4812813 | 0 |
| 4812815 | 0 |
| 4812828 | 0 |
| 4812840 | 0 |
| 4813001 | 0 |
| 4813002 | 0 |
| 4813003 | 0 |
| 4813005 | 0 |
| 4813006 | 0 |
| 4813007 | 0 |
| 4813008 | 0 |
| 4813010 | 0 |
| 4813011 | 0 |
| 4813012 | 0 |
| 4813013 | 0 |
| 4813014 | 0 |
| 4813015 | 0 |
| 4813016 | 0 |
| 4813017 | 0 |
| 4813018 | 0 |
| 4813019 | 10 |
| 4813028 | 0 |
| 4813029 | 0 |
| 4813030 | 5 |
| 4813031 | 5 |
| 4813032 | 0 |
| 4813033 | 0 |
| 4813036 | 0 |
| 4813044 | 0 |
| 4813045 | 0 |
| 4813046 | 0 |
| 4813047 | 0 |
| 4813048 | 0 |
| 4813049 | 5 |
| 4813051 | 0 |
| 4813053 | 0 |
| 4813055 | 0 |
| 4813057 | 0 |
| 4813061 | 0 |
| 4813811 | 0 |
| 4814003 | 0 |
| 4814019 | 15 |
| 4814024 | 20 |
| 4815007 | 0 |
| 4815013 | 0 |
| 4815015 | 0 |
| 4815023 | 80 |
| 4815027 | 0 |
| 4815030 | 0 |
| 4815032 | 0 |
| 4815033 | 10 |
| 4815035 | 75 |
| 4815045 | 0 |
| 4815802 | 0 |
| 4816037 | 135 |
| 4816051 | 0 |
| 4816817 | 0 |
| 4816821 | 0 |
| 4816822 | 0 |
| 4816850 | 0 |
| 4816852 | 0 |
| 4816859 | 0 |
| 4816860 | 0 |
| 4816861 | 0 |
| 4817021 | 0 |
| 4817024 | 0 |
| 4817026 | 10 |
| 4817027 | 5 |
| 4817029 | 0 |
| 4817031 | 0 |
| 4817033 | 0 |
| 4817039 | 0 |
| 4817062 | 0 |
| 4817064 | 0 |
| 4817076 | 0 |
| 4817078 | 0 |
| 4817093 | 0 |
| 4817095 | 0 |
| 4817097 | 0 |
| 4817817 | 0 |
| 4817818 | 0 |
| 4817819 | 0 |
| 4817821 | 0 |
| 4817822 | 0 |
| 4817823 | 0 |
| 4817824 | 0 |
| 4817825 | 0 |
| 4817827 | 0 |
| 4817828 | 0 |
| 4817829 | 0 |
| 4817830 | 0 |
| 4817831 | 0 |
| 4817832 | 0 |
| 4817833 | 0 |
| 4817835 | 0 |
| 4817836 | 0 |
| 4817837 | 0 |
| 4817838 | 0 |
| 4817840 | 0 |
| 4817841 | 0 |
| 4817842 | 0 |
| 4817843 | 0 |
| 4817845 | 0 |
| 4817848 | 0 |
| 4817849 | 0 |
| 4817853 | 0 |
| 4817855 | 0 |
| 4817856 | 0 |
| 4817857 | 0 |
| 4817859 | 0 |
| 4817860 | 0 |
| 4818002 | 0 |
| 4818005 | 0 |
| 4818015 | 0 |
| 4818018 | 0 |
| 4818816 | 0 |
| 4818818 | 0 |
| 4819006 | 10 |
| 4819008 | 0 |
| 4819009 | 0 |
| 4819011 | 0 |
| 4819012 | 45 |
| 4819014 | 0 |
| 4819038 | 0 |
| 4819041 | 35 |
| 4819042 | 0 |
| 4819044 | 0 |
| 4819046 | 0 |
| 4819048 | 0 |
| 4819049 | 0 |
| 4819054 | 0 |
| 4819056 | 0 |
| 4819058 | 0 |
| 4819059 | 0 |
| 4819066 | 0 |
| 4819068 | 0 |
| 4819071 | 0 |
| 4819072 | 0 |
| 4819074 | 0 |
| 4819815 | 0 |
| 4819826 | 0 |
| 5901003 | 0 |
| 5901006 | 0 |
| 5901012 | 15 |
| 5901017 | 0 |
| 5901019 | 0 |
| 5901022 | 15 |
| 5901028 | 10 |
| 5901035 | 0 |
| 5901037 | 0 |
| 5901039 | 0 |
| 5901040 | 0 |
| 5901043 | 0 |
| 5901046 | 0 |
| 5901048 | 0 |
| 5901801 | 0 |
| 5901803 | 0 |
| 5901804 | 0 |
| 5901805 | 0 |
| 5901806 | 0 |
| 5903004 | 0 |
| 5903010 | 0 |
| 5903011 | 0 |
| 5903013 | 0 |
| 5903015 | 35 |
| 5903017 | 0 |
| 5903019 | 0 |
| 5903023 | 0 |
| 5903027 | 0 |
| 5903032 | 0 |
| 5903039 | 0 |
| 5903041 | 0 |
| 5903043 | 0 |
| 5903045 | 0 |
| 5903047 | 0 |
| 5903050 | 0 |
| 5903052 | 0 |
| 5903056 | 0 |
| 5903058 | 0 |
| 5903060 | 0 |
| 5903807 | 0 |
| 5905005 | 0 |
| 5905009 | 0 |
| 5905014 | 0 |
| 5905018 | 0 |
| 5905023 | 10 |
| 5905026 | 0 |
| 5905030 | 0 |
| 5905032 | 0 |
| 5905037 | 0 |
| 5905042 | 0 |
| 5905050 | 0 |
| 5905052 | 0 |
| 5905054 | 0 |
| 5907005 | 0 |
| 5907009 | 0 |
| 5907014 | 15 |
| 5907022 | 0 |
| 5907024 | 0 |
| 5907026 | 0 |
| 5907028 | 0 |
| 5907035 | 15 |
| 5907041 | 45 |
| 5907047 | 15 |
| 5907049 | 5 |
| 5907051 | 0 |
| 5907053 | 0 |
| 5907055 | 0 |
| 5907801 | 0 |
| 5907802 | 0 |
| 5907803 | 0 |
| 5907805 | 0 |
| 5907806 | 0 |
| 5907807 | 0 |
| 5907808 | 0 |
| 5907809 | 0 |
| 5909009 | 5 |
| 5909014 | 0 |
| 5909016 | 0 |
| 5909020 | 30 |
| 5909027 | 5 |
| 5909032 | 0 |
| 5909034 | 0 |
| 5909035 | 5 |
| 5909036 | 0 |
| 5909048 | 0 |
| 5909052 | 100 |
| 5909056 | 5 |
| 5909060 | 0 |
| 5909062 | 0 |
| 5909804 | 0 |
| 5909806 | 0 |
| 5909807 | 0 |
| 5909810 | 0 |
| 5909812 | 0 |
| 5909814 | 0 |
| 5909815 | 0 |
| 5909816 | 0 |
| 5909817 | 0 |
| 5909818 | 0 |
| 5909819 | 0 |
| 5909821 | 0 |
| 5909824 | 0 |
| 5909825 | 0 |
| 5909826 | 0 |
| 5909827 | 0 |
| 5909830 | 0 |
| 5909831 | 0 |
| 5909832 | 0 |
| 5909833 | 0 |
| 5909834 | 0 |
| 5909835 | 0 |
| 5909837 | 0 |
| 5909838 | 0 |
| 5909839 | 0 |
| 5909841 | 0 |
| 5909842 | 0 |
| 5909843 | 0 |
| 5909844 | 0 |
| 5909845 | 0 |
| 5909847 | 0 |
| 5909848 | 0 |
| 5909875 | 0 |
| 5909876 | 0 |
| 5909877 | 0 |
| 5909878 | 0 |
| 5909879 | 0 |
| 5909880 | 0 |
| 5909881 | 0 |
| 5909882 | 0 |
| 5909883 | 0 |
| 5909884 | 0 |
| 5909885 | 0 |
| 5915001 | 25 |
| 5915002 | 10 |
| 5915004 | 225 |
| 5915007 | 15 |
| 5915011 | 35 |
| 5915015 | 80 |
| 5915020 | 10 |
| 5915022 | 780 |
| 5915025 | 135 |
| 5915029 | 50 |
| 5915034 | 100 |
| 5915036 | 0 |
| 5915038 | 0 |
| 5915039 | 70 |
| 5915043 | 35 |
| 5915046 | 60 |
| 5915051 | 70 |
| 5915055 | 40 |
| 5915062 | 15 |
| 5915065 | 0 |
| 5915070 | 5 |
| 5915075 | 45 |
| 5915801 | 0 |
| 5915802 | 0 |
| 5915803 | 0 |
| 5915805 | 0 |
| 5915806 | 0 |
| 5915807 | 0 |
| 5915808 | 5 |
| 5915809 | 0 |
| 5915810 | 0 |
| 5915811 | 0 |
| 5915813 | 0 |
| 5915816 | 0 |
| 5915825 | 0 |
| 5915830 | 0 |
| 5917005 | 0 |
| 5917010 | 0 |
| 5917015 | 5 |
| 5917021 | 90 |
| 5917027 | 35 |
| 5917029 | 0 |
| 5917030 | 5 |
| 5917034 | 75 |
| 5917040 | 30 |
| 5917041 | 10 |
| 5917042 | 0 |
| 5917044 | 25 |
| 5917047 | 5 |
| 5917049 | 0 |
| 5917052 | 0 |
| 5917054 | 0 |
| 5917056 | 0 |
| 5917801 | 0 |
| 5917802 | 0 |
| 5917803 | 0 |
| 5917804 | 0 |
| 5917805 | 0 |
| 5917809 | 0 |
| 5917812 | 0 |
| 5917815 | 0 |
| 5917819 | 0 |
| 5919008 | 5 |
| 5919012 | 0 |
| 5919013 | 0 |
| 5919015 | 0 |
| 5919016 | 0 |
| 5919017 | 0 |
| 5919021 | 15 |
| 5919033 | 0 |
| 5919035 | 0 |
| 5919043 | 0 |
| 5919046 | 0 |
| 5919049 | 5 |
| 5919051 | 0 |
| 5919801 | 0 |
| 5919802 | 0 |
| 5919803 | 0 |
| 5919804 | 0 |
| 5919809 | 0 |
| 5919812 | 0 |
| 5919814 | 0 |
| 5919815 | 0 |
| 5919816 | 0 |
| 5919818 | 0 |
| 5919820 | 0 |
| 5919821 | 0 |
| 5919822 | 0 |
| 5921007 | 105 |
| 5921008 | 0 |
| 5921010 | 0 |
| 5921014 | 0 |
| 5921016 | 0 |
| 5921018 | 0 |
| 5921023 | 0 |
| 5921030 | 0 |
| 5921032 | 0 |
| 5921034 | 0 |
| 5921036 | 10 |
| 5921804 | 0 |
| 5921805 | 0 |
| 5921806 | 0 |
| 5921807 | 0 |
| 5923008 | 0 |
| 5923019 | 0 |
| 5923025 | 20 |
| 5923033 | 0 |
| 5923035 | 0 |
| 5923037 | 0 |
| 5923039 | 0 |
| 5923047 | 0 |
| 5923049 | 0 |
| 5923801 | 0 |
| 5923802 | 0 |
| 5923803 | 0 |
| 5923804 | 0 |
| 5923805 | 0 |
| 5923806 | 0 |
| 5923807 | 0 |
| 5923808 | 0 |
| 5923809 | 0 |
| 5923810 | 0 |
| 5923813 | 0 |
| 5923816 | 0 |
| 5923822 | 0 |
| 5923823 | 0 |
| 5923824 | 0 |
| 5924025 | 0 |
| 5924029 | 0 |
| 5924030 | 0 |
| 5924034 | 20 |
| 5924039 | 0 |
| 5924042 | 0 |
| 5924048 | 0 |
| 5924052 | 0 |
| 5924054 | 0 |
| 5924804 | 0 |
| 5924806 | 0 |
| 5924812 | 0 |
| 5924814 | 0 |
| 5924817 | 0 |
| 5924820 | 0 |
| 5924833 | 0 |
| 5924835 | 0 |
| 5924836 | 0 |
| 5924840 | 0 |
| 5926005 | 15 |
| 5926010 | 25 |
| 5926014 | 0 |
| 5926021 | 0 |
| 5926022 | 5 |
| 5926024 | 10 |
| 5926801 | 0 |
| 5927008 | 10 |
| 5927010 | 0 |
| 5927012 | 0 |
| 5927016 | 0 |
| 5927018 | 0 |
| 5927020 | 0 |
| 5927802 | 0 |
| 5927806 | 0 |
| 5929005 | 0 |
| 5929011 | 0 |
| 5929018 | 0 |
| 5929022 | 0 |
| 5929024 | 5 |
| 5929026 | 0 |
| 5929028 | 0 |
| 5929803 | 0 |
| 5931006 | 30 |
| 5931012 | 0 |
| 5931017 | 0 |
| 5931020 | 85 |
| 5931021 | 0 |
| 5931026 | 0 |
| 5931032 | 0 |
| 5931034 | 0 |
| 5931801 | 0 |
| 5931802 | 0 |
| 5931806 | 0 |
| 5931807 | 0 |
| 5931808 | 0 |
| 5931809 | 0 |
| 5931812 | 0 |
| 5931813 | 0 |
| 5931814 | 0 |
| 5931815 | 0 |
| 5931816 | 0 |
| 5931817 | 0 |
| 5931818 | 0 |
| 5931819 | 0 |
| 5931820 | 0 |
| 5931821 | 0 |
| 5931823 | 0 |
| 5931826 | 0 |
| 5931827 | 0 |
| 5931828 | 0 |
| 5931829 | 0 |
| 5931831 | 0 |
| 5931832 | 0 |
| 5931833 | 0 |
| 5931842 | 0 |
| 5931843 | 0 |
| 5931844 | 0 |
| 5933006 | 0 |
| 5933008 | 5 |
| 5933012 | 0 |
| 5933015 | 0 |
| 5933019 | 0 |
| 5933024 | 0 |
| 5933028 | 0 |
| 5933032 | 5 |
| 5933035 | 0 |
| 5933037 | 0 |
| 5933039 | 0 |
| 5933042 | 20 |
| 5933044 | 0 |
| 5933045 | 0 |
| 5933054 | 5 |
| 5933060 | 0 |
| 5933067 | 0 |
| 5933068 | 0 |
| 5933070 | 0 |
| 5933072 | 0 |
| 5933074 | 0 |
| 5933801 | 0 |
| 5933802 | 0 |
| 5933805 | 0 |
| 5933806 | 0 |
| 5933807 | 0 |
| 5933808 | 0 |
| 5933809 | 0 |
| 5933811 | 0 |
| 5933812 | 0 |
| 5933813 | 0 |
| 5933814 | 0 |
| 5933817 | 0 |
| 5933819 | 0 |
| 5933821 | 0 |
| 5933823 | 0 |
| 5933825 | 0 |
| 5933828 | 0 |
| 5933829 | 0 |
| 5933831 | 0 |
| 5933832 | 0 |
| 5933833 | 0 |
| 5933834 | 0 |
| 5933836 | 0 |
| 5933841 | 0 |
| 5933842 | 0 |
| 5933844 | 0 |
| 5933845 | 0 |
| 5933849 | 0 |
| 5933850 | 0 |
| 5933851 | 0 |
| 5933852 | 0 |
| 5933853 | 0 |
| 5933854 | 0 |
| 5933855 | 0 |
| 5933859 | 0 |
| 5933861 | 0 |
| 5933865 | 0 |
| 5933866 | 0 |
| 5933868 | 0 |
| 5933872 | 0 |
| 5933873 | 0 |
| 5933875 | 0 |
| 5933876 | 0 |
| 5933877 | 0 |
| 5933878 | 0 |
| 5933879 | 0 |
| 5933880 | 0 |
| 5933881 | 0 |
| 5933882 | 0 |
| 5933884 | 0 |
| 5933886 | 0 |
| 5933887 | 0 |
| 5933888 | 0 |
| 5933889 | 0 |
| 5933895 | 0 |
| 5933898 | 0 |
| 5935010 | 100 |
| 5935012 | 0 |
| 5935016 | 0 |
| 5935018 | 0 |
| 5935020 | 0 |
| 5935029 | 10 |
| 5935801 | 10 |
| 5935802 | 0 |
| 5935803 | 0 |
| 5937005 | 0 |
| 5937010 | 5 |
| 5937014 | 15 |
| 5937017 | 0 |
| 5937021 | 0 |
| 5937022 | 0 |
| 5937023 | 5 |
| 5937024 | 0 |
| 5937028 | 5 |
| 5937033 | 0 |
| 5937041 | 0 |
| 5937801 | 0 |
| 5937802 | 0 |
| 5937803 | 10 |
| 5937805 | 0 |
| 5939007 | 5 |
| 5939011 | 5 |
| 5939019 | 15 |
| 5939023 | 0 |
| 5939032 | 15 |
| 5939037 | 0 |
| 5939039 | 0 |
| 5939043 | 0 |
| 5939044 | 0 |
| 5939045 | 0 |
| 5939801 | 0 |
| 5939802 | 0 |
| 5939803 | 0 |
| 5939804 | 0 |
| 5939805 | 0 |
| 5939806 | 0 |
| 5939807 | 0 |
| 5939808 | 0 |
| 5939811 | 0 |
| 5941005 | 0 |
| 5941009 | 0 |
| 5941010 | 0 |
| 5941012 | 0 |
| 5941013 | 0 |
| 5941014 | 5 |
| 5941015 | 0 |
| 5941016 | 0 |
| 5941017 | 0 |
| 5941019 | 0 |
| 5941021 | 0 |
| 5941025 | 0 |
| 5941026 | 0 |
| 5941027 | 0 |
| 5941039 | 0 |
| 5941041 | 0 |
| 5941801 | 0 |
| 5941802 | 0 |
| 5941805 | 0 |
| 5941806 | 0 |
| 5941807 | 0 |
| 5941808 | 0 |
| 5941809 | 0 |
| 5941810 | 0 |
| 5941811 | 0 |
| 5941812 | 0 |
| 5941813 | 0 |
| 5941821 | 0 |
| 5941828 | 0 |
| 5941829 | 0 |
| 5941831 | 0 |
| 5941833 | 0 |
| 5941837 | 0 |
| 5941839 | 0 |
| 5941840 | 0 |
| 5941841 | 0 |
| 5941845 | 0 |
| 5941849 | 0 |
| 5941850 | 0 |
| 5941851 | 0 |
| 5941852 | 0 |
| 5941855 | 0 |
| 5941868 | 0 |
| 5941871 | 0 |
| 5941872 | 0 |
| 5941873 | 0 |
| 5941876 | 0 |
| 5941879 | 0 |
| 5941880 | 0 |
| 5941882 | 0 |
| 5941883 | 0 |
| 5941884 | 0 |
| 5941885 | 0 |
| 5943008 | 0 |
| 5943012 | 0 |
| 5943017 | 0 |
| 5943023 | 5 |
| 5943027 | 0 |
| 5943031 | 0 |
| 5943033 | 0 |
| 5943037 | 0 |
| 5943804 | 0 |
| 5943806 | 0 |
| 5943807 | 0 |
| 5943808 | 0 |
| 5943813 | 0 |
| 5943815 | 0 |
| 5943816 | 0 |
| 5943836 | 0 |
| 5943837 | 0 |
| 5945006 | 0 |
| 5945010 | 5 |
| 5945012 | 0 |
| 5945014 | 0 |
| 5945801 | 0 |
| 5945802 | 0 |
| 5945803 | 0 |
| 5947007 | 0 |
| 5947012 | 5 |
| 5947016 | 0 |
| 5947021 | 0 |
| 5947023 | 0 |
| 5947026 | 0 |
| 5947027 | 0 |
| 5947030 | 0 |
| 5947032 | 0 |
| 5947803 | 0 |
| 5947804 | 0 |
| 5947806 | 0 |
| 5947807 | 0 |
| 5947809 | 0 |
| 5947810 | 0 |
| 5949005 | 0 |
| 5949011 | 0 |
| 5949013 | 5 |
| 5949018 | 0 |
| 5949020 | 0 |
| 5949022 | 0 |
| 5949024 | 0 |
| 5949028 | 0 |
| 5949032 | 0 |
| 5949035 | 0 |
| 5949038 | 0 |
| 5949039 | 0 |
| 5949041 | 0 |
| 5949802 | 0 |
| 5949803 | 0 |
| 5949804 | 0 |
| 5949807 | 0 |
| 5949810 | 0 |
| 5949811 | 0 |
| 5949812 | 0 |
| 5949813 | 0 |
| 5949814 | 0 |
| 5949815 | 0 |
| 5949816 | 0 |
| 5949817 | 0 |
| 5949818 | 0 |
| 5949819 | 0 |
| 5949820 | 0 |
| 5949832 | 0 |
| 5949843 | 0 |
| 5949844 | 0 |
| 5949845 | 0 |
| 5949847 | 0 |
| 5951007 | 5 |
| 5951009 | 0 |
| 5951013 | 0 |
| 5951015 | 0 |
| 5951017 | 0 |
| 5951019 | 0 |
| 5951022 | 0 |
| 5951028 | 0 |
| 5951031 | 0 |
| 5951032 | 0 |
| 5951034 | 0 |
| 5951038 | 0 |
| 5951043 | 0 |
| 5951051 | 0 |
| 5951053 | 0 |
| 5951801 | 0 |
| 5951802 | 0 |
| 5951803 | 0 |
| 5951805 | 0 |
| 5951806 | 0 |
| 5951807 | 0 |
| 5951809 | 0 |
| 5951810 | 0 |
| 5951813 | 0 |
| 5951814 | 0 |
| 5951815 | 0 |
| 5951818 | 0 |
| 5951819 | 0 |
| 5951820 | 0 |
| 5951821 | 0 |
| 5951822 | 0 |
| 5951824 | 0 |
| 5951825 | 0 |
| 5951826 | 0 |
| 5951827 | 0 |
| 5951828 | 0 |
| 5951829 | 0 |
| 5951830 | 0 |
| 5951840 | 0 |
| 5951844 | 0 |
| 5951848 | 0 |
| 5953007 | 0 |
| 5953012 | 0 |
| 5953019 | 0 |
| 5953023 | 25 |
| 5953033 | 0 |
| 5953038 | 0 |
| 5953042 | 0 |
| 5953044 | 0 |
| 5953046 | 0 |
| 5953048 | 0 |
| 5953050 | 0 |
| 5953801 | 0 |
| 5953802 | 0 |
| 5955003 | 0 |
| 5955005 | 0 |
| 5955010 | 0 |
| 5955014 | 0 |
| 5955021 | 5 |
| 5955023 | 0 |
| 5955025 | 0 |
| 5955030 | 0 |
| 5955034 | 15 |
| 5955040 | 0 |
| 5955042 | 0 |
| 5955801 | 0 |
| 5955802 | 0 |
| 5955803 | 0 |
| 5955804 | 0 |
| 5955807 | 0 |
| 5955808 | 0 |
| 5955812 | 0 |
| 5957022 | 0 |
| 5957802 | 0 |
| 5957803 | 0 |
| 5957813 | 0 |
| 5957814 | 0 |
| 5959007 | 0 |
| 5959805 | 0 |
| 5959806 | 0 |
| 5959810 | 0 |
Map 3.b shows that there was a large concentration of 500 or more Francophone agri-food workers in four census subdivisions (CSDs) in Western Canada in 2016: Calgary (1,350 workers) and Edmonton (1,145 workers) in Alberta; Winnipeg (875 workers) in Manitoba; and Vancouver (780 workers) in British Columbia. In Saskatchewan, the CSD where the most Francophone agri-food workers lived in 2016 was Saskatoon (165 workers).
3.1 Age group
The aging of Francophone agri-food workers in Western Canada was less pronounced than that of their counterparts in the agriculture sector, with smaller proportions of those workers being 55 years or older. However, Francophone
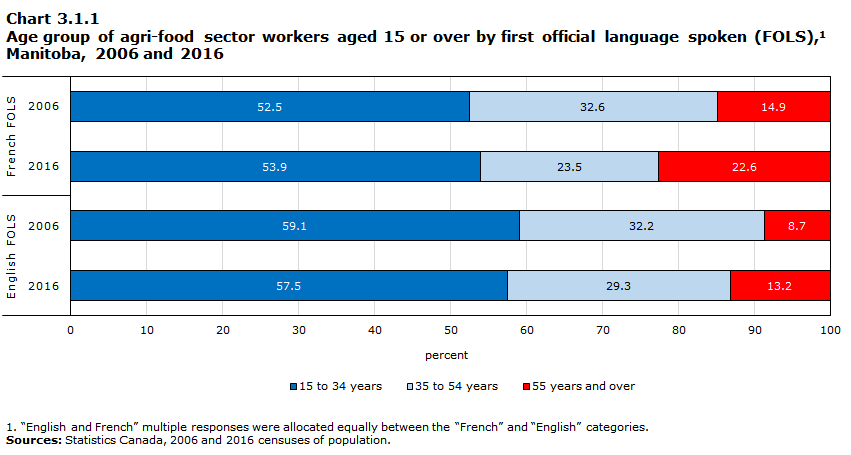
Data table for Chart 3.1.1
| 15 to 34 years | 35 to 54 years | 55 years and over | |
|---|---|---|---|
| percent | |||
| French FOLS | |||
| 2006 | 52.5 | 32.6 | 14.9 |
| 2016 | 53.9 | 23.5 | 22.6 |
| English FOLS | |||
| 2006 | 59.1 | 32.2 | 8.7 |
| 2016 | 57.5 | 29.3 | 13.2 |
|
|||
The median age of Manitoba’s Francophone agri-food workers was relatively stable between 2006 (33.7 years) and 2016 (32.6 years). Over the decade, there was an increase in the proportion of those aged 55 years or older (from 14.9% in 2006 to 22.6% in 2016). However, the share of young Francophone agri-food workers aged 15 to 34 slightly increased between 2006 (52.5%) and 2016 (53.9%).
Manitoba’s Francophone agri-food workers were relatively older than their Anglophone counterparts, whose median age was 29.0 years in 2006 and 30.7 years in 2016. Less than one in seven Anglophone agri-food workers was 55 years or older in 2016, compared with more than one in five Francophone workers. In addition, the share of young agri-food workers aged 15 to 34 was higher among Anglophone workers (57.5%) than Francophone workers (53.9%).
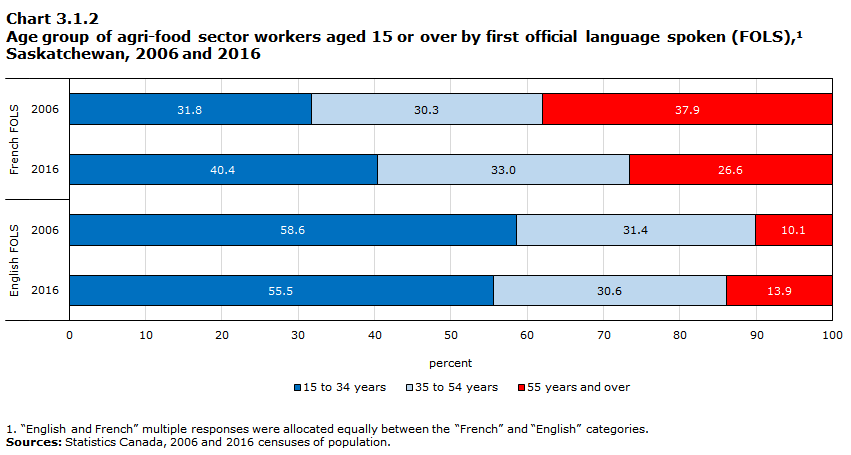
Data table for Chart 3.1.2
| 15 to 34 years | 35 to 54 years | 55 years and over | |
|---|---|---|---|
| percent | |||
| French FOLS | |||
| 2006 | 31.8 | 30.3 | 37.9 |
| 2016 | 40.4 | 33.0 | 26.6 |
| English FOLS | |||
| 2006 | 58.6 | 31.4 | 10.1 |
| 2016 | 55.5 | 30.6 | 13.9 |
|
|||
Unlike their counterparts in the agriculture sector, Francophone agri-food workers in Saskatchewan were relatively younger in 2016 than in 2006. Their median age went down over the decade, from 48.4 years in 2006 to 41.6 years in 2016, while the proportion of these workers aged 55 years or older decreased from 37.9% to 26.6%. At the same time, the share of Francophone agri-food workers aged 15 to 34 increased from 31.8% to 40.4%.
In contrast to these trends, Francophone agri-food workers remained older than their Anglophone counterparts, whose median age was 29.0 years in 2006 and 32.1 years in 2016. The proportion of Anglophone agri-food workers 55 years or older (13.9%) was nearly half that of their Francophone counterparts (26.6%) in 2016. Furthermore, more than 55% of Anglophone agri-food workers were between the ages of 15 and 34 in 2016, compared with about 40% of the Francophone peers.
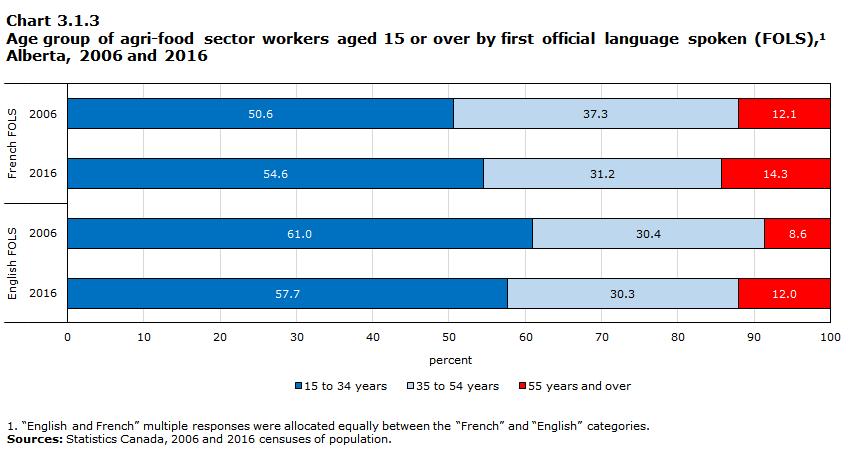
Data table for Chart 3.1.3
| 15 to 34 years | 35 to 54 years | 55 years and over | |
|---|---|---|---|
| percent | |||
| French FOLS | |||
| 2006 | 50.6 | 37.3 | 12.1 |
| 2016 | 54.6 | 31.2 | 14.3 |
| English FOLS | |||
| 2006 | 61.0 | 30.4 | 8.6 |
| 2016 | 57.7 | 30.3 | 12.0 |
|
|||
In Alberta, the median age of Francophone agri-food workers fell slightly between 2006 and 2016, from 34.5 years to 32.4 years. These workers have become somewhat younger, as can be seen by the proportion of workers aged 15 to 34 years, which increased from 50.6% in 2006 to 54.6% in 2016. Meanwhile, the share of Francophone agri-food workers aged 55 years or older slightly increased over the decade, from 12.1% in 2006 to 14.3% in 2016.
Francophone agri-food workers in Alberta were somewhat older than their Anglophone counterparts. The median age of Alberta’s Anglophone agri-food workers rose from 28.1 years in 2006 to 31.3 years in 2016. The proportion of Anglophone agri-food workers aged 15 to 34 (57.7%) was slightly higher than the share among their Francophone counterparts (54.6%) in 2016.
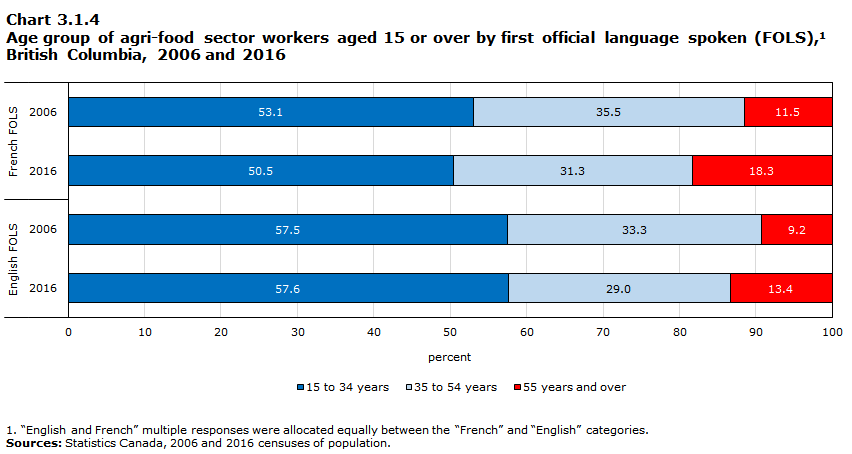
Data table for Chart 3.1.4
| 15 to 34 years | 35 to 54 years | 55 years and over | |
|---|---|---|---|
| percent | |||
| French FOLS | |||
| 2006 | 53.1 | 35.5 | 11.5 |
| 2016 | 50.5 | 31.3 | 18.3 |
| English FOLS | |||
| 2006 | 57.5 | 33.3 | 9.2 |
| 2016 | 57.6 | 29.0 | 13.4 |
|
|||
In British Columbia, the proportion of Francophone agri-food workers aged 55 years or older increased from 11.5% to 18.3% between 2006 and 2016. However, the median age of these workers was relatively stable over the decade
Anglophone agri-food workers in British Columbia were relatively younger than their Francophone counterparts. The proportion of Anglophone agri-food workers aged 15 to 34 (57.6%) was higher than the proportion of their Francophone peers (50.5%) in 2016. Moreover, the median age of Anglophone agri-food workers was relatively stable between 2006 (30.2 years) and 2016 (30.5 years), and lower than that of their Francophone peers.
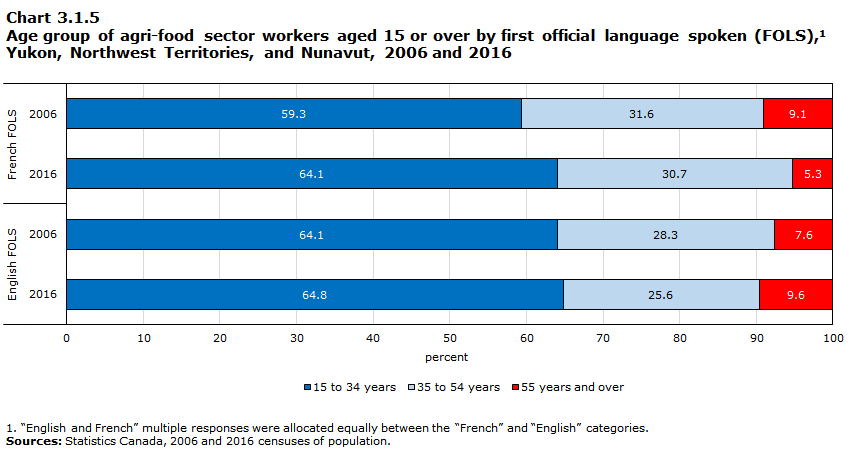
Data table for Chart 3.1.5
| 15 to 34 years | 35 to 54 years | 55 years and over | |
|---|---|---|---|
| percent | |||
| French FOLS | |||
| 2006 | 59.3 | 31.6 | 9.1 |
| 2016 | 64.1 | 30.7 | 5.3 |
| English FOLS | |||
| 2006 | 64.1 | 28.3 | 7.6 |
| 2016 | 64.8 | 25.6 | 9.6 |
|
|||
In the territories, the median age of Francophone agri-food workers rose from 24.1 years in 2006 to 32.4 years in 2016. In 2016, about six in ten Francophone agri-food workers were between the ages of 15 and 34. This proportion was similar among their Anglophone counterparts, whose median age was relatively stable between 2006 (26.9 years) and 2016
3.2 Sex
The proportion of women among Francophone and Anglophone agri-food workers was close to parity across Western Canada and in the territories in 2006 and 2016. However, with the exception of the territories, the proportion of women was lower among Francophone agri-food workers than among their Anglophone counterparts in 2016.
In Manitoba, the proportion of women among Francophone agri-food workers was 49.0% in 2006 and 47.0% in 2016. This proportion was higher among their Anglophone counterparts (52.4% in both years).
In Saskatchewan, the proportion of women among Francophone agri-food workers decreased between 2006 and 2016, from 63.0% to 50.2%. In 2016, this proportion was lower than that of Anglophone agri-food workers (54.1% in 2006 and 54.0% in 2016).
In Alberta, women represented a similar proportion of Francophone agri-food workers in 2006 (53.2%) and 2016 (52.1%). These proportions were lower than those observed among their Anglophone counterparts (55.5% in 2006 and 55.0% in 2016).
In British Columbia, the proportion of women among Francophone agri-food workers decreased between 2006 and 2016, from 56.6% to 50.0%. Among their Anglophone counterparts, the proportion of women among agri-food workers was 56.8% in 2006 and 55.8% in 2016.
Lastly, in the territories, the proportion of women among Francophone agri-food workers increased between 2006 and 2016, from 50.2% to 60.6%. Among their Anglophone peers, women represented 53.2% of workers in 2006 and 55.2% in 2016.
3.3 Place of birth
The proportion of Francophone agri-food workers born outside Canada grew in all the Western provinces and in the territories between 2006 and 2016. In 2016, it was similar to the proportion among their Anglophone counterparts in Saskatchewan, Alberta and British Columbia.
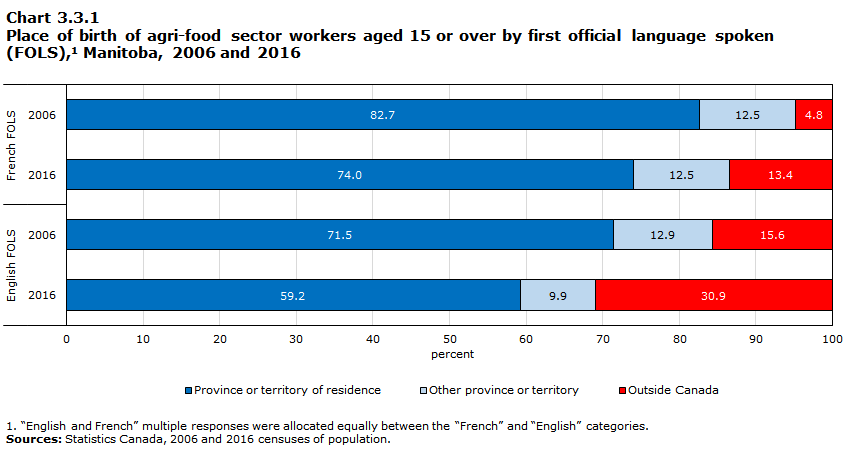
Data table for Chart 3.3.1
| Province or territory of residence | Other province or territory | Outside Canada | |
|---|---|---|---|
| percent | |||
| French FOLS | |||
| 2006 | 82.7 | 12.5 | 4.8 |
| 2016 | 74.0 | 12.5 | 13.4 |
| English FOLS | |||
| 2006 | 71.5 | 12.9 | 15.6 |
| 2016 | 59.2 | 9.9 | 30.9 |
|
|||
In Manitoba, one in eight Francophone agri-food workers were born in another province in both 2006 and 2016. In addition, the proportion of Francophone agri-food workers born outside Canada almost tripled over the decade, increasing from 4.8% to 13.4%. However, in 2016, Anglophone agri-food workers were more likely to be born outside Canada (30.9%) than their Francophone counterparts (13.4%).
In 2016, among Francophone agri-food workers born in a province other than Manitoba, about half were born in Quebec (49.0%). As for their counterparts born outside Canada, about two-thirds were from Africa.
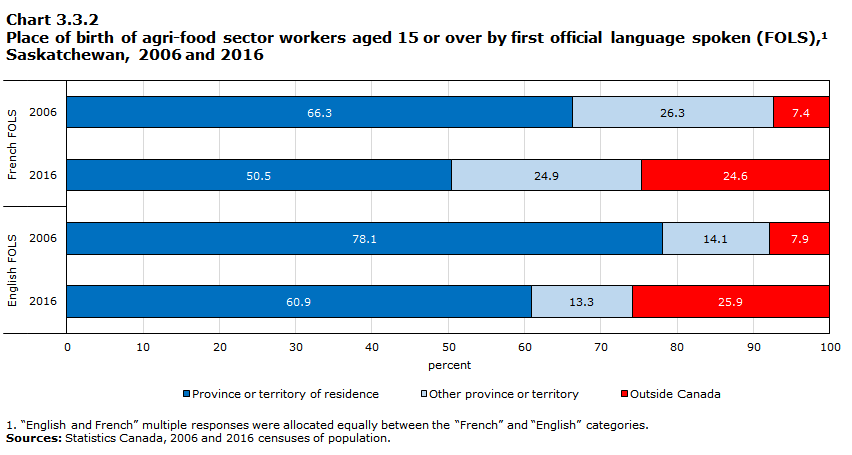
Data table for Chart 3.3.2
| Province or territory of residence | Other province or territory | Outside Canada | |
|---|---|---|---|
| percent | |||
| French FOLS | |||
| 2006 | 66.3 | 26.3 | 7.4 |
| 2016 | 50.5 | 24.9 | 24.6 |
| English FOLS | |||
| 2006 | 78.1 | 14.1 | 7.9 |
| 2016 | 60.9 | 13.3 | 25.9 |
|
|||
In Saskatchewan, the proportion of Francophone agri-food workers born outside Canada increased between 2006 (7.4%) and 2016 (24.6%). These proportions were similar among their Anglophone counterparts. Moreover, in 2016, about
In 2016, more than half of Francophone agri-food workers born in a province other than Saskatchewan were from Quebec (52.1%). As for their counterparts born outside Canada, 55.9% were born in Africa. Thus, in 2016 in Saskatchewan, about one in seven Francophone agri-food workers were born in Africa, and around one in eight were born in Quebec.
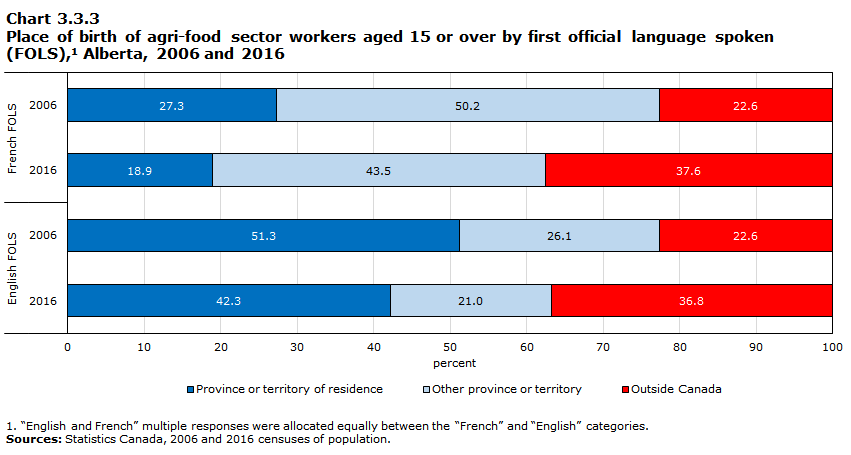
Data table for Chart 3.3.3
| Province or territory of residence | Other province or territory | Outside Canada | |
|---|---|---|---|
| percent | |||
| French FOLS | |||
| 2006 | 27.3 | 50.2 | 22.6 |
| 2016 | 18.9 | 43.5 | 37.6 |
| English FOLS | |||
| 2006 | 51.3 | 26.1 | 22.6 |
| 2016 | 42.3 | 21.0 | 36.8 |
|
|||
In Alberta, between 2006 and 2016, the proportion of Francophone agri-food workers born in the province declined from 27.3% to 18.9%. The proportion of these workers born in another province also decreased (50.2% in 2006 and 43.5% in 2016), while the share of those born outside Canada increased from about 23% in 2006 to more than 37% in 2016. This last proportion was similar to that among Anglophone agri-food workers in 2016 (36.8%). However, Anglophone
In 2016, Francophone agri-food workers born in another province were mainly born in Quebec (62.7%), Ontario (16.1%), and New Brunswick (11.5%). Thus, in 2016, more than one-quarter of Francophone agri-food workers in Alberta were born in Quebec.
As for Francophone agricultural workers born outside Canada in 2016, 58.5% were from Africa, 14.5% from Europe, 14.4% from elsewhere in the AmericasNote and 12.5% from Asia. The main countries of birth of these workers were the Democratic Republic of the Congo (11.4%), France (8.2%), and Morocco (6.9%). In 2016 in Alberta, more than one in five Francophone agri-food workers were born in Africa.
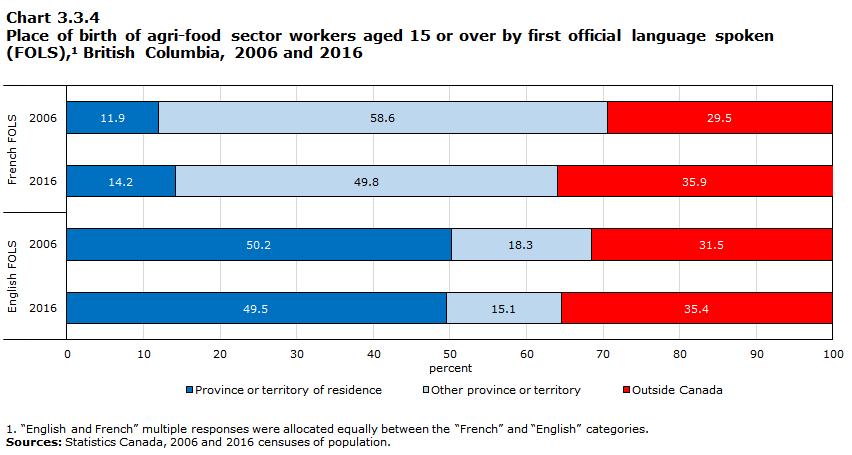
Data table for Chart 3.3.4
| Province or territory of residence | Other province or territory | Outside Canada | |
|---|---|---|---|
| percent | |||
| French FOLS | |||
| 2006 | 11.9 | 58.6 | 29.5 |
| 2016 | 14.2 | 49.8 | 35.9 |
| English FOLS | |||
| 2006 | 50.2 | 18.3 | 31.5 |
| 2016 | 49.5 | 15.1 | 35.4 |
|
|||
The proportion of Francophone agri-food workers in British Columbia who were born in another province decreased from 58.6% to 49.8% between 2006 and 2016. Moreover, the proportion of these workers born outside Canada rose from 29.5% in 2006 to 35.9% in 2016. A similar proportion of Anglophone agri-food workers were born outside Canada in 2016 (35.4%). However, less than one in six Anglophone agri-food workers were born in another province, compared with about half of Francophone agri-food workers.
In 2016, Francophone agri-food workers born in another province than British Columbia were mainly from Quebec (67.2%) and Ontario (13.5%). Therefore, more than one-third of British Columbia’s Francophone agri-food workers were born in Quebec.
Among Francophone agri-food workers born outside Canada in 2016, 50.1% were born in Europe, 22.7% in Asia, 16.6% in Africa and 10.2% elsewhere in the Americas. The main country of birth of these workers was France (32.5%). Thus, more than 11% of Francophone agri-food workers in British Columbia were born in France in 2016.
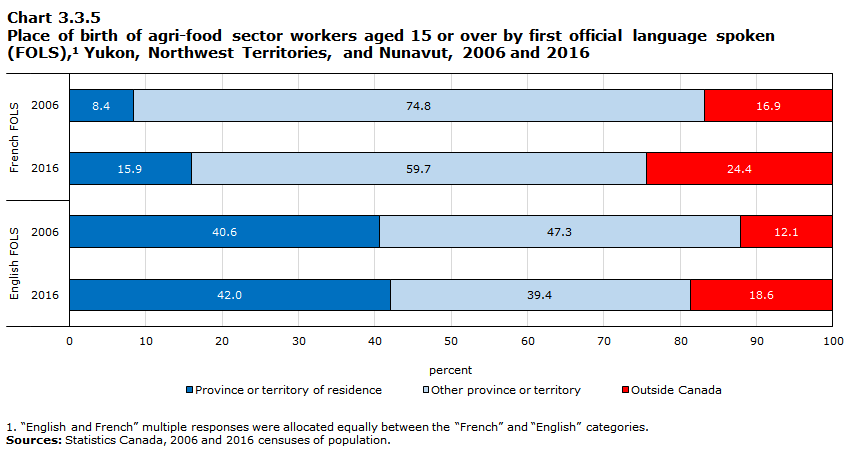
Data table for Chart 3.3.5
| Province or territory of residence | Other province or territory | Outside Canada | |
|---|---|---|---|
| percent | |||
| French FOLS | |||
| 2006 | 8.4 | 74.8 | 16.9 |
| 2016 | 15.9 | 59.7 | 24.4 |
| English FOLS | |||
| 2006 | 40.6 | 47.3 | 12.1 |
| 2016 | 42.0 | 39.4 | 18.6 |
|
|||
In the territories, about three in four Francophone agri-food workers were born in another province or territoryNote in 2006, compared with less than six in ten in 2016. Nearly one in four Francophone agri-food workers were born outside Canada in 2016.
In 2016, Anglophone agri-food workers in the territories were less likely to be born in another province or territory (39.4%) or outside Canada (18.6%) than their Francophone counterparts (59.7% and 24.4%, respectively).
3.4 Indigenous identity
The number of Indigenous agri-food workers in Manitoba rose from 8,390 in 2006 to 10,575 in 2016. The proportion whose first official language spoken (FOLS) was French was 5.5% in 2006 and 3.2% in 2016. A very small number of Indigenous agri-food workers knew neither official language in 2016. Moreover, 10.1% knew an Indigenous language, often a Cree language, Oji-Cree or Ojibway.
In Saskatchewan, there were 7,210 Indigenous agri-food workers in 2006 and 8,040 in 2016. In both years, French was the FOLS of less than 1% of these workers. In 2016, all Indigenous agri-food workers in the province knew English or French and 13.4% knew an Indigenous language, often a Cree language or Dene.
Between 2006 and 2016, the number of Indigenous agri-food workers in Alberta increased from 12,090 to 13,905. French was the FOLS of about 1% of them in both years. In 2016, a very small number of these workers knew neither official language. Furthermore, 5.7% knew an Indigenous language, often a Cree language or Blackfoot.
In British Columbia, the number of Indigenous agri-food workers was up from 13,730 in 2006 to 20,110 in 2016. About 1% of them had French as FOLS in both years. In 2016, all these workers knew English or French and 3.1% knew an Indigenous language, such as the Carrier language.
Lastly, there were 1,785 Indigenous agri-food workers in the territories in 2006 and 2,890 in 2016. In both years, a very small number had French as FOLS and a very small number had no knowledge of an official language. Moreover, about 57% knew an Indigenous language in 2016, mainly Inuktitut.
3.5 Education
The level of education of Francophone agri-food workers generally increased between 2006 and 2016 in all Western provinces. The proportion of Francophone agri-food workers who had not completed secondary studies decreased over the decade in each province and in the territories. In addition, the proportion of Francophone agri-food workers with a postsecondary qualification was higher than that of their Anglophone counterparts in 2016.
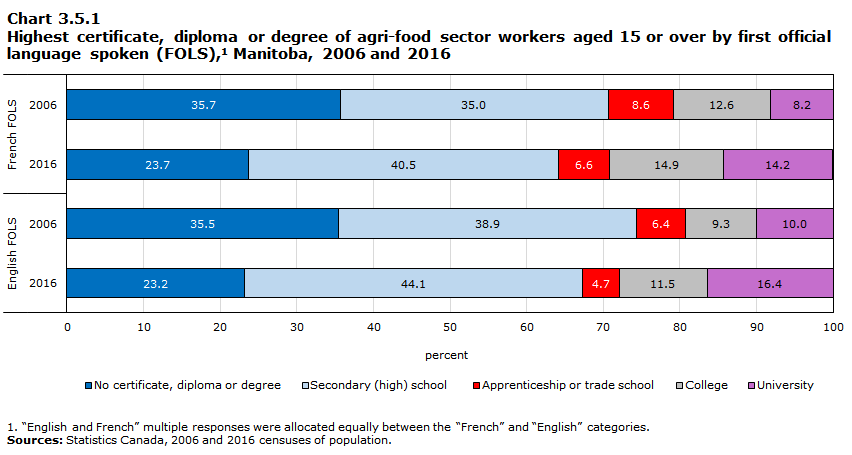
Data table for Chart 3.5.1
| No certificate, diploma or degree | Secondary (high) school | Apprenticeship or trade school | College | University | |
|---|---|---|---|---|---|
| percent | |||||
| French FOLS | |||||
| 2006 | 35.7 | 35.0 | 8.6 | 12.6 | 8.2 |
| 2016 | 23.7 | 40.5 | 6.6 | 14.9 | 14.2 |
| English FOLS | |||||
| 2006 | 35.5 | 38.9 | 6.4 | 9.3 | 10.0 |
| 2016 | 23.2 | 44.1 | 4.7 | 11.5 | 16.4 |
|
|||||
In Manitoba, the proportion of Francophone agri-food workers who had not completed secondary studies decreased from 35.7% to 23.7% over the decade, and the proportion of Francophone agri-food workers with a college or university qualification increased from 20.8% to 29.1% over the same period.
The levels of education of Francophone and Anglophone agri-food workers were similar in 2016. However, the proportion of Francophone agri-food workers with a postsecondary qualification (35.7%) was slightly higher than that of Anglophone agri-food workers (32.6%).
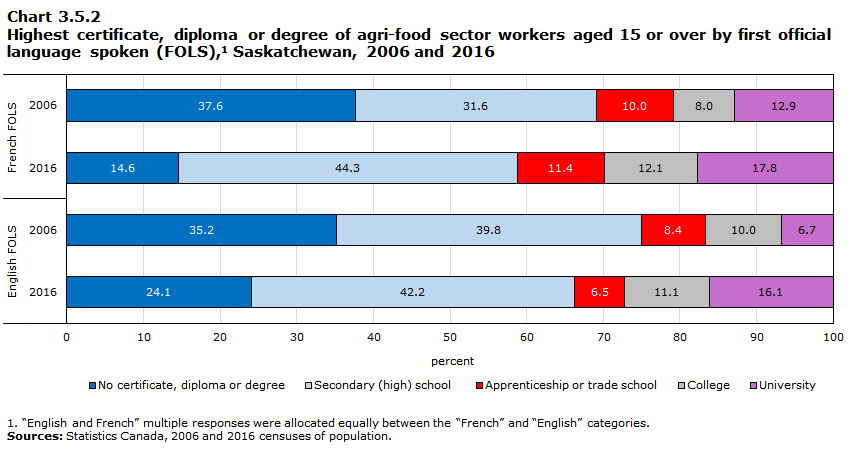
Data table for Chart 3.5.2
| No certificate, diploma or degree | Secondary (high) school | Apprenticeship or trade school | College | University | |
|---|---|---|---|---|---|
| percent | |||||
| French FOLS | |||||
| 2006 | 37.6 | 31.6 | 10.0 | 8.0 | 12.9 |
| 2016 | 14.6 | 44.3 | 11.4 | 12.1 | 17.8 |
| English FOLS | |||||
| 2006 | 35.2 | 39.8 | 8.4 | 10.0 | 6.7 |
| 2016 | 24.1 | 42.2 | 6.5 | 11.1 | 16.1 |
|
|||||
In Saskatchewan, the proportion of Francophone agri-food workers who did not have a certificate, diploma or degree fell markedly between 2006 and 2016, from 37.6% to 14.6%, and the share with a postsecondary qualification rose from 30.9% in 2006 to 41.3% in 2016. This proportion was higher than that of their Anglophone counterparts in 2016 (33.7%). Furthermore, in 2016, about one in four Anglophone agri-food workers had not completed secondary studies, compared to about one in seven among their Francophone counterparts.
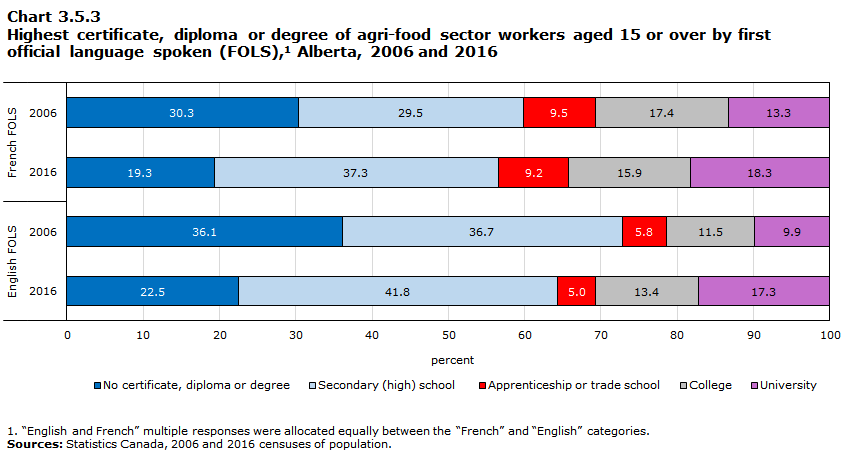
Data table for Chart 3.5.3
| No certificate, diploma or degree | Secondary (high) school | Apprenticeship or trade school | College | University | |
|---|---|---|---|---|---|
| percent | |||||
| French FOLS | |||||
| 2006 | 30.3 | 29.5 | 9.5 | 17.4 | 13.3 |
| 2016 | 19.3 | 37.3 | 9.2 | 15.9 | 18.3 |
| English FOLS | |||||
| 2006 | 36.1 | 36.7 | 5.8 | 11.5 | 9.9 |
| 2016 | 22.5 | 41.8 | 5.0 | 13.4 | 17.3 |
|
|||||
In Alberta, the proportion of Francophone agri-food workers with no secondary diploma decreased between 2006 (30.3%) and 2016 (19.3%), and the share with a postsecondary qualification increased (40.2% in 2006 and 43.4% in 2016). Their Anglophone counterparts had a relatively lower level of education. In 2016, 22.5% of them did not have a certificate, diploma or degree, and 35.7% had a postsecondary diploma.
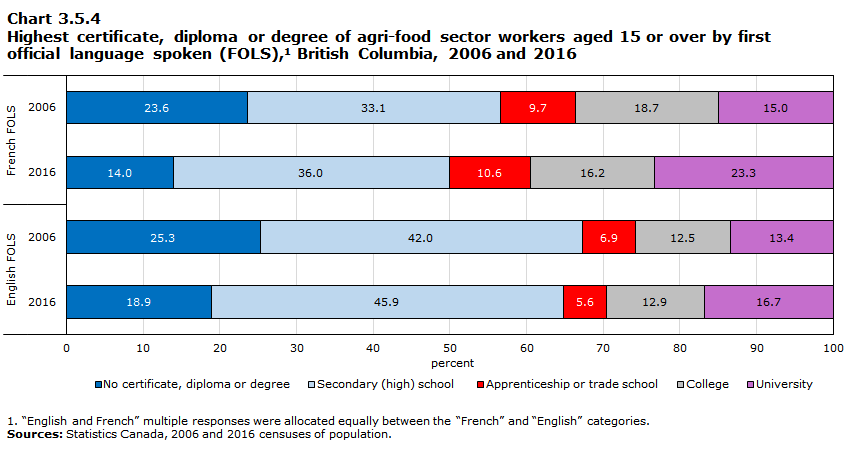
Data table for Chart 3.5.4
| No certificate, diploma or degree | Secondary (high) school | Apprenticeship or trade school | College | University | |
|---|---|---|---|---|---|
| percent | |||||
| French FOLS | |||||
| 2006 | 23.6 | 33.1 | 9.7 | 18.7 | 15.0 |
| 2016 | 14.0 | 36.0 | 10.6 | 16.2 | 23.3 |
| English FOLS | |||||
| 2006 | 25.3 | 42.0 | 6.9 | 12.5 | 13.4 |
| 2016 | 18.9 | 45.9 | 5.6 | 12.9 | 16.7 |
|
|||||
In British Columbia, the proportion of Francophone agricultural workers with no certificate, diploma or degree declined from 23.6% to 14.0% between 2006 and 2016, and the share of these workers with a postsecondary qualification increased from 43.4% to 50.1%. In 2016, slightly less than one-quarter of Francophone agri-food workers had a university degree. The level of education of Anglophone agri-food workers was relatively lower than that of their Francophone counterparts in 2016, as seen by the proportion of these workers who had not completed secondary studies (18.9%) and the share of these workers with a postsecondary qualification (35.2%).
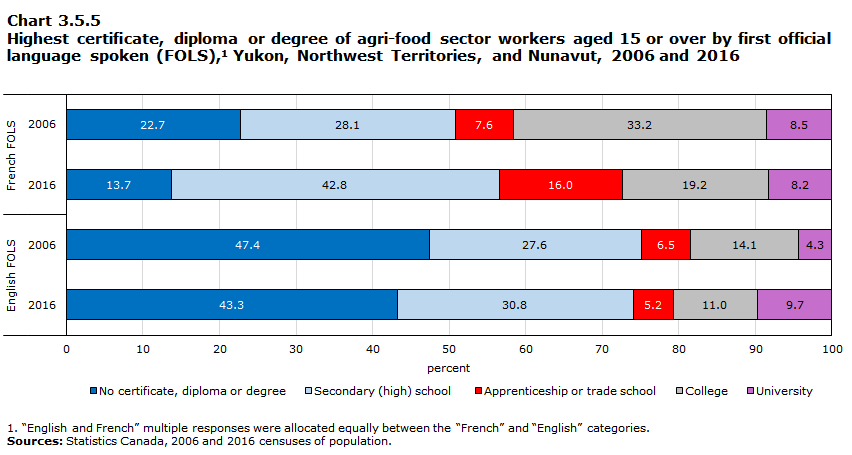
Data table for Chart 3.5.5
| No certificate, diploma or degree | Secondary (high) school | Apprenticeship or trade school | College | University | |
|---|---|---|---|---|---|
| percent | |||||
| French FOLS | |||||
| 2006 | 22.7 | 28.1 | 7.6 | 33.2 | 8.5 |
| 2016 | 13.7 | 42.8 | 16.0 | 19.2 | 8.2 |
| English FOLS | |||||
| 2006 | 47.4 | 27.6 | 6.5 | 14.1 | 4.3 |
| 2016 | 43.3 | 30.8 | 5.2 | 11.0 | 9.7 |
|
|||||
Between 2006 and 2016, the proportion of Francophone agri-food workers in the territories who had not completed secondary studies declined from 22.7% to 13.7%. Moreover, the share of these workers with a college diploma as their highest qualification also decreased, from 33.2% in 2006 to 19.2% in 2016. In 2016, about 43% of Francophone agri-food workers had a postsecondary qualification, compared with around a quarter of their Anglophone counterparts.
3.6 Class of worker
Across Western Canada and the territories, more than nine in ten agri-food workers were employees in 2006 and 2016. This proportion was similar among Anglophones and Francophones.
The proportion of self-employed persons among Francophone agri-food workers increased between 2006 and 2016 in Manitoba, from about 5% to around 8%. This share was relatively stable over the decade in Saskatchewan (about 7%) and British Columbia (about 10%). In Alberta, the proportion of self-employed workers among Francophone agri-food workers was down over the decade, from more than 8% to about 5%. Few Francophone agri-food workers in the territories were self-employed in 2016.
In 2016, the proportion of self-employment among Francophone agri-food workers was higher than that of their Anglophone counterparts in Manitoba (7.7% compared with 4.8%), Saskatchewan (6.8% versus 5.3%), and
3.7 Employment income
Employment income includes all income received as wages, salaries and commissions from paid employment and net self-employment income from farm or non-farm unincorporated business and/or professional practice during the calendar year preceding the census. The employment income of agri-food workers may include income from sources other than the job held in that sector.
Most of the information in this report includes all individuals categorized as workers, including those who worked during the reference week (e.g. May 1 to 7, 2016) or the census year (e.g. 2016), but who were not working in the year before the census (e.g. 2015). However, since these workers were not working in the year before the census, they are excluded from the information presented in this section. They are identified by the “not applicable” category in the charts below and are excluded from the calculations of median income, work arrangements, and the number of weeks worked per year.
The median employment income of Francophone agri-food workers was higher than that of their Anglophone counterparts in 2016 in all the Western provinces, except Alberta, as well as in the territories. Differences in median employment income between Francophone and Anglophone agri-food workers can partly be explained by the specific industry in which they work. The next section addresses this topic.
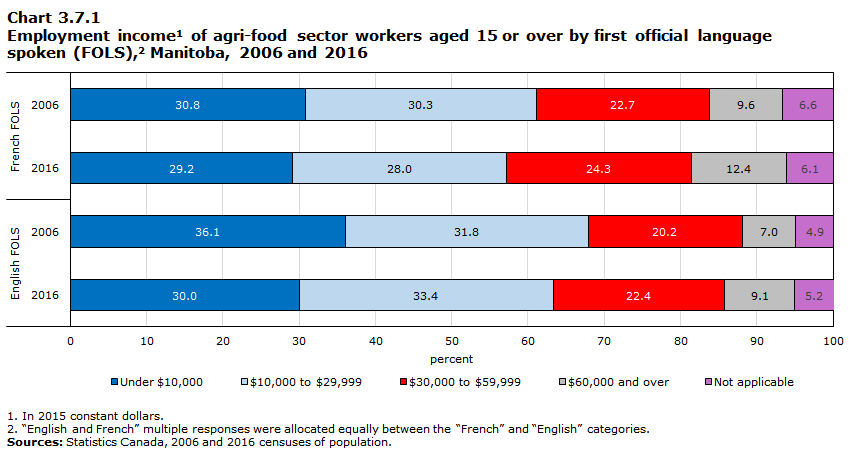
Data table for Chart 3.7.1
| Under $10,000 | $10,000 to $29,999 | $30,000 to $59,999 | $60,000 and over | Not applicable | |
|---|---|---|---|---|---|
| percent | |||||
| French FOLS | |||||
| 2006 | 30.8 | 30.3 | 22.7 | 9.6 | 6.6 |
| 2016 | 29.2 | 28.0 | 24.3 | 12.4 | 6.1 |
| English FOLS | |||||
| 2006 | 36.1 | 31.8 | 20.2 | 7.0 | 4.9 |
| 2016 | 30.0 | 33.4 | 22.4 | 9.1 | 5.2 |
|
|||||
Between 2006 and 2016, the median employment income of Francophone agri-food workers in Manitoba rose from $16,250 to $20,650. The proportion of these workers whose employment income was $30,000 or more thus increased from about 32% to nearly 37% over the decade.
The employment income of Francophone agri-food workers was slightly above that of their Anglophone counterparts, whose median employment income was $15,170 in 2006 and $18,370 in 2016. In 2016, 31.5% of Anglophone agri-food workers had employment income of $30,000 or more, while this proportion was 36.7% among their Francophone counterparts.
In 2016, a similar proportion of Francophone (60.1%) and Anglophone (59.0%) agri-food workers worked full-time. Moreover, the average number of weeks worked per year was relatively similar among Francophone (41.2) and Anglophone (40.5) agri-food workers.
The gap in median employment income between Francophone men and women working in the agri-food sector increased in Manitoba between 2006 ($19,480) and 2016 ($21,020). The median employment income of Francophone women in the sector rose from $11,520 to $13,505 between 2006 and 2016, and that of Francophone men rose from $31,000 to $34,525 over the same period.
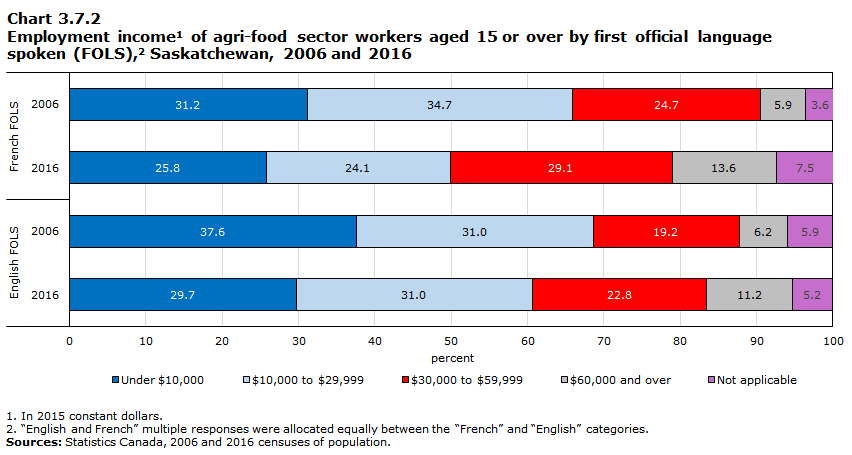
Data table for Chart 3.7.2
| Under $10,000 | $10,000 to $29,999 | $30,000 to $59,999 | $60,000 and over | Not applicable | |
|---|---|---|---|---|---|
| percent | |||||
| French FOLS | |||||
| 2006 | 31.2 | 34.7 | 24.7 | 5.9 | 3.6 |
| 2016 | 25.8 | 24.1 | 29.1 | 13.6 | 7.5 |
| English FOLS | |||||
| 2006 | 37.6 | 31.0 | 19.2 | 6.2 | 5.9 |
| 2016 | 29.7 | 31.0 | 22.8 | 11.2 | 5.2 |
|
|||||
The median employment income of Francophone agri-food workers in Saskatchewan increased from $17,750 in 2006 to $26,910 in 2016. This increase can be seen in the proportion of these workers whose employment income was $30,000 or more, which rose from 30.6% to 42.7% between 2006 and 2016. The share of these workers whose employment income was less than $10,000 was down from 31.2% to 25.8% over the decade. This proportion was higher among Anglophone agri-food workers in 2016 (29.7%), who were also less likely to report employment income of $30,000 or more (34.0%) than their Francophone counterparts. Moreover, the median employment income of Francophone agri-food workers was higher than that of their Anglophone counterparts in 2006 ($14,015) and 2016 ($20,400).
In 2016, 65.7% of Francophone agri-food workers in Saskatchewan worked full-time. This proportion was higher than that of their Anglophone counterparts (62.6%). However, the average number of weeks worked per year was relatively similar among Francophone (40.4) and Anglophone (39.8) agri-food workers.
Between 2006 and 2016, the median employment income of Francophone women in the agri-food sector in Saskatchewan increased from $14,165 to $20,535, and that of Francophone men rose from $31,745 to $37,825. The gap in employment income between Francophone men and women in the agri-food sector was relatively similar in 2006 ($17,580) and 2016 ($17,290).
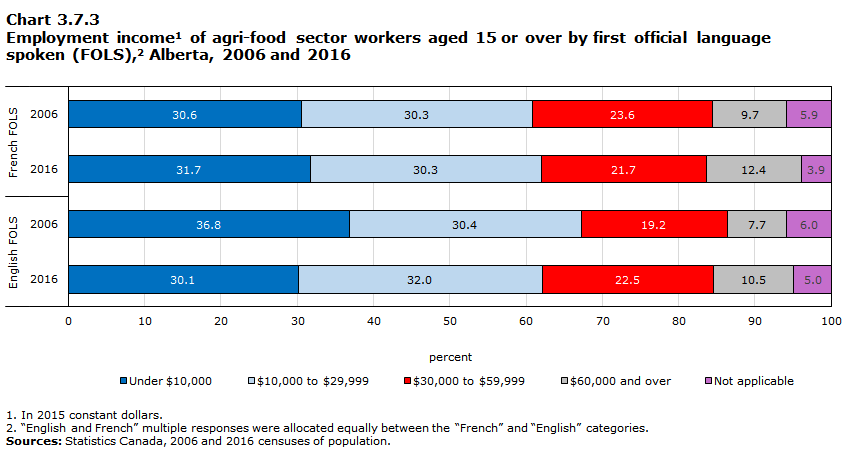
Data table for Chart 3.7.3
| Under $10,000 | $10,000 to $29,999 | $30,000 to $59,999 | $60,000 and over | Not applicable | |
|---|---|---|---|---|---|
| percent | |||||
| French FOLS | |||||
| 2006 | 30.6 | 30.3 | 23.6 | 9.7 | 5.9 |
| 2016 | 31.7 | 30.3 | 21.7 | 12.4 | 3.9 |
| English FOLS | |||||
| 2006 | 36.8 | 30.4 | 19.2 | 7.7 | 6.0 |
| 2016 | 30.1 | 32.0 | 22.5 | 10.5 | 5.0 |
|
|||||
The median employment income of Francophone agri-food workers in Alberta was relatively stable between 2006 and 2016, from $18,810 to $18,775, while that of their Anglophone counterparts increased from $14,750 to $19,180 over the same period. In 2016, the median employment income of Francophone and Anglophone agri-food workers was similar, as was their distribution in different income groups. In 2016, slightly less than one-third of Francophone agri-food workers had employment income of less than $10,000 and slightly more than one-third had employment income of $30,000 or more. These proportions changed little among Francophone agri-food workers between 2006 and 2016.
In 2016, the proportion of Francophone agri-food workers who worked full-time (63.0%) was higher than the proportion among Anglophone agri-food workers (59.7%). However, the average number of weeks worked per year was slightly lower among Francophone agri-food workers (38.4) than among their Anglophone counterparts (39.4).
In Alberta, the median employment income of Francophone women working in the agri-food sector was $13,825 in 2006 and $14,175 in 2016, and that of Francophone men was $29,720 in 2006 and $27,905 in 2016. The gap in median employment income between Francophone men and women in the agri-food sector narrowed in Alberta between 2006 ($15,895) and 2016 ($13,725).
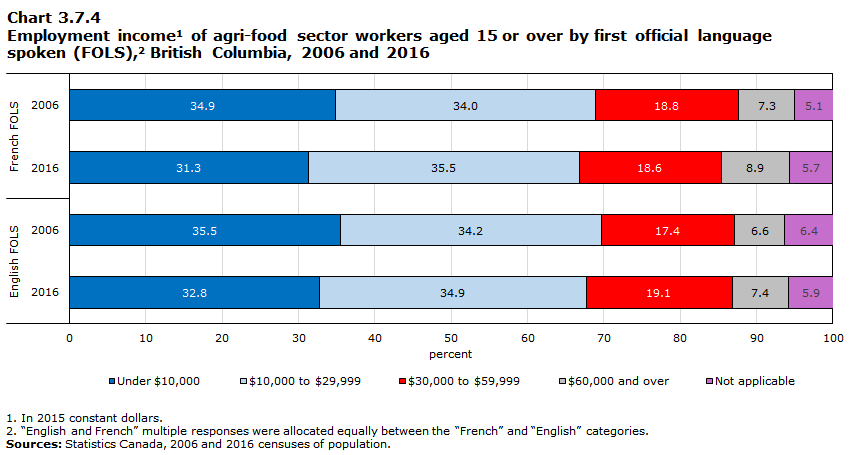
Data table for Chart 3.7.4
| Under $10,000 | $10,000 to $29,999 | $30,000 to $59,999 | $60,000 and over | Not applicable | |
|---|---|---|---|---|---|
| percent | |||||
| French FOLS | |||||
| 2006 | 34.9 | 34.0 | 18.8 | 7.3 | 5.1 |
| 2016 | 31.3 | 35.5 | 18.6 | 8.9 | 5.7 |
| English FOLS | |||||
| 2006 | 35.5 | 34.2 | 17.4 | 6.6 | 6.4 |
| 2016 | 32.8 | 34.9 | 19.1 | 7.4 | 5.9 |
|
|||||
The median employment income of Francophone agri-food workers in British Columbia rose between 2006 and 2016, from $15,760 to $17,550. The proportion of Francophone agri-food workers with employment income below $10,000 was down from 34.9% to 31.3% over the decade. In both years, more than one-quarter of these workers had employment income of $30,000 or more.
In 2016, the distribution of Francophone agri-food workers in income groups was similar to that of their Anglophone counterparts, whose median employment income rose from $14,790 to $16,435 between 2006 and 2016.
In 2016, a higher proportion of Francophone agri-food workers (64.4%) worked full-time than their Anglophone counterparts (57.6%). On average, Francophone agri-food workers worked 38.4 weeks per year, which was similar to their Anglophone peers (38.8).
The gap in median employment income between Francophone men and women working in the agri-food sector in
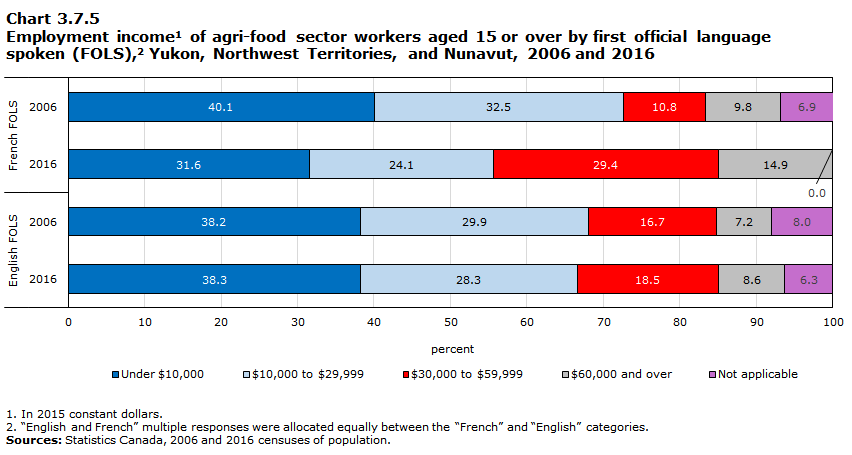
Data table for Chart 3.7.5
| Under $10,000 | $10,000 to $29,999 | $30,000 to $59,999 | $60,000 and over | Not applicable | |
|---|---|---|---|---|---|
| percent | |||||
| French FOLS | |||||
| 2006 | 40.1 | 32.5 | 10.8 | 9.8 | 6.9 |
| 2016 | 31.6 | 24.1 | 29.4 | 14.9 | 0.0 |
| English FOLS | |||||
| 2006 | 38.2 | 29.9 | 16.7 | 7.2 | 8.0 |
| 2016 | 38.3 | 28.3 | 18.5 | 8.6 | 6.3 |
|
|||||
In the territories, the median employment income of Francophone agri-food workers increased from $15,165 to $26,655 between 2006 and 2016. The median employment income of their Anglophone counterparts was $14,390 in 2006 and $14,580 in 2016. Over the course of the decade, the proportion of Francophone agri-food workers with employment income of less than $10,000 decreased (from 40.1% in 2006 to 31.6% in 2016) and the share with employment income of $30,000 or over more than doubled (from 20.6% in 2006 to 44.3% in 2016).
Relatively similar proportions of Francophone (62.1%) and Anglophone (63.6%) agri-food workers worked full-time. In contrast, the average number of weeks worked per year was slightly higher among Francophone agri-food workers (40.8) than among their Anglophone counterparts (35.8).
3.8 Industry
Francophone agri-food workers were concentrated in different industriesNote than their Anglophone counterparts. The proportion of Francophone agri-food workers active in food services was below the share of their Anglophone counterparts in Manitoba, Saskatchewan and Alberta. The opposite was observed in British Columbia and the territories. In addition, compared with their Anglophone counterparts, Francophone agri-food workers in Manitoba and Saskatchewan were more concentrated in the input and service supply industry.
Across Western provinces, the industry of Francophone agri-food workers varied by age and sex. In 2016, in each of these provinces, the proportion of Francophone agri-food workers aged 15 to 34 who worked in food services (59.3% in Manitoba, 68.0% in Alberta, 72.8% in Saskatchewan, and 76.2% in British Columbia) was higher than the share of their counterparts 55 years or older (14.4% in Manitoba, 27.5% in Saskatchewan, 36.6% in Alberta, and 55.8% in
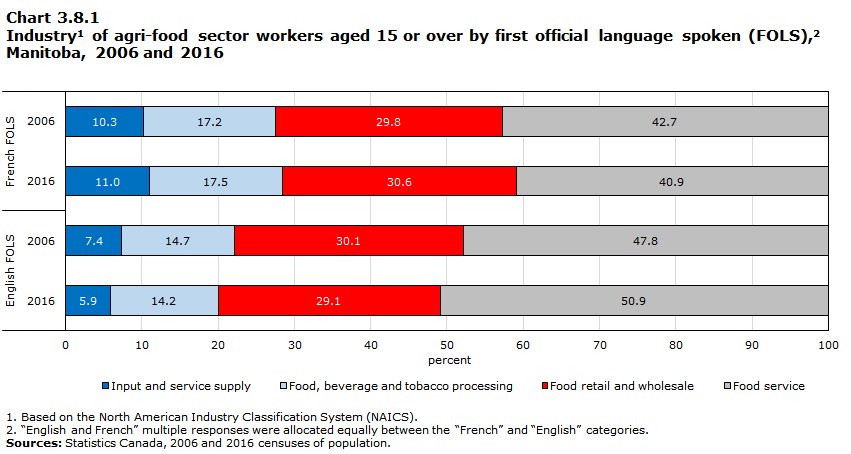
Data table for Chart 3.8.1
| Input and service supply | Food, beverage and tobacco processing | Food retail and wholesale | Food service | |
|---|---|---|---|---|
| percent | ||||
| French FOLS | ||||
| 2006 | 10.3 | 17.2 | 29.8 | 42.7 |
| 2016 | 11.0 | 17.5 | 30.6 | 40.9 |
| English FOLS | ||||
| 2006 | 7.4 | 14.7 | 30.1 | 47.8 |
| 2016 | 5.9 | 14.2 | 29.1 | 50.9 |
|
||||
The industries in which Manitoba’s Francophone agri-food workers were active were relatively similar in 2006 and 2016, and differed from those of their Anglophone counterparts. In 2016, the proportion of Francophone agri-food workers active in food services was lower (40.9%) than that of their Anglophone counterparts (50.9%). Conversely, the proportion of Francophone agri-food workers who worked in the input and service supply industry was nearly twice as high (11.0%) as that of their Anglophone counterparts (5.9%). Moreover, about three in ten agri-food workers—both Francophone and Anglophone—worked in the food retail and wholesale industry.
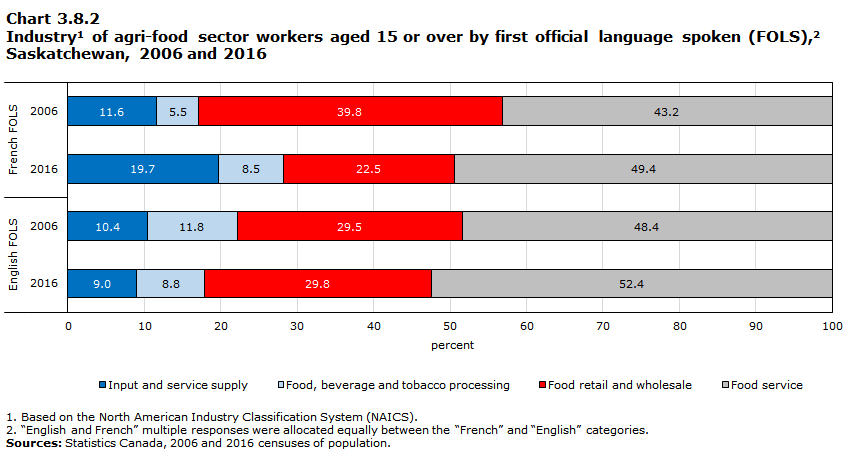
Data table for Chart 3.8.2
| Input and service supply | Food, beverage and tobacco processing | Food retail and wholesale | Food service | |
|---|---|---|---|---|
| percent | ||||
| French FOLS | ||||
| 2006 | 11.6 | 5.5 | 39.8 | 43.2 |
| 2016 | 19.7 | 8.5 | 22.5 | 49.4 |
| English FOLS | ||||
| 2006 | 10.4 | 11.8 | 29.5 | 48.4 |
| 2016 | 9.0 | 8.8 | 29.8 | 52.4 |
|
||||
Between 2006 and 2016, the proportion of Francophone agri-food workers in Saskatchewan who worked in food services increased from 43.2% to 49.4%. Over the same period, the proportion of these workers active in the input and service supply industry also increased (from 11.6% in 2006 to 19.7% in 2016) and the share of those working in the food retail and wholesale industry decreased (from 39.8% in 2006 to 22.5% in 2016).
In 2016, Francophone and Anglophone agri-food workers in Saskatchewan worked in different industries. Nearly one in five Francophone agri-food worker were active in the input and service supply industry, compared with less than one in six among their Anglophone counterparts. Moreover, the proportion of Francophone agri-food workers in the food retail and wholesale industry (22.5%) was lower than that of their Anglophone counterparts (29.8%) in 2016. In 2006, this proportion was higher among Francophones (39.8%) than among Anglophones (29.5%).
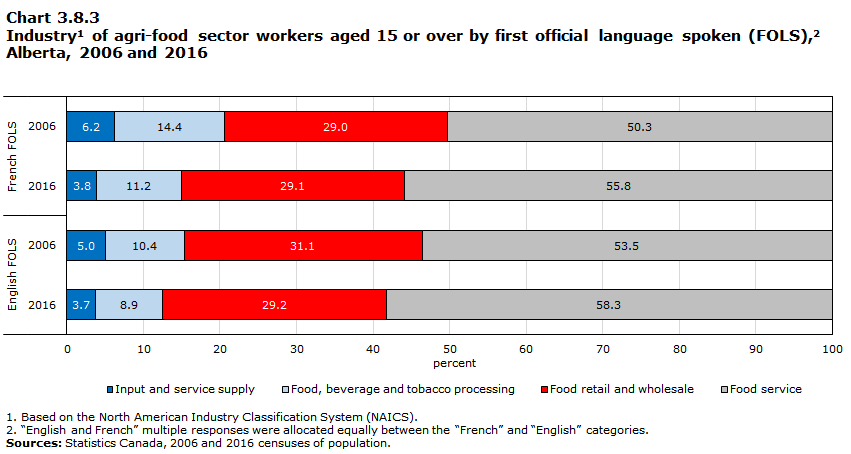
Data table for Chart 3.8.3
| Input and service supply | Food, beverage and tobacco processing | Food retail and wholesale | Food service | |
|---|---|---|---|---|
| percent | ||||
| French FOLS | ||||
| 2006 | 6.2 | 14.4 | 29.0 | 50.3 |
| 2016 | 3.8 | 11.2 | 29.1 | 55.8 |
| English FOLS | ||||
| 2006 | 5.0 | 10.4 | 31.1 | 53.5 |
| 2016 | 3.7 | 8.9 | 29.2 | 58.3 |
|
||||
Between 2006 and 2016, the proportion of Francophone agri-food workers in Alberta who worked in food services increased from 50.3% to 55.8%. In both years, about 29% of Francophone agri-food workers worked in the food retail and wholesale industry. In 2016, the proportion of Francophone agri-food workers who were active in the food service industry was slightly lower than that of their Anglophone peers (58.3%).
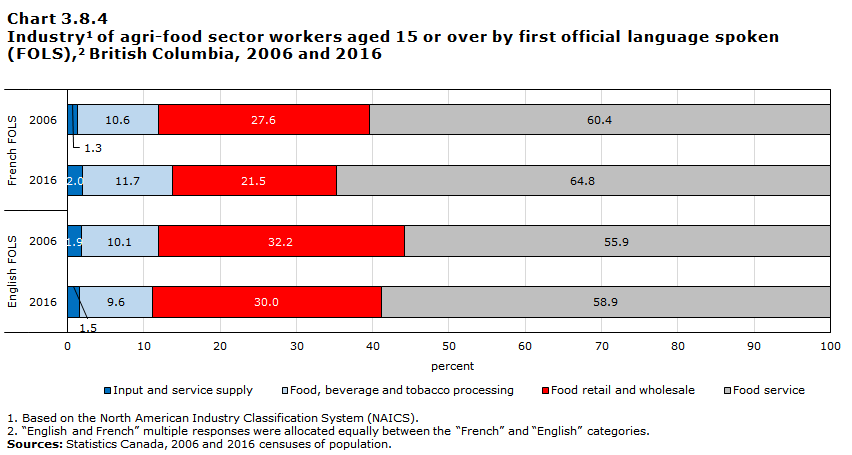
Data table for Chart 3.8.4
| Input and service supply | Food, beverage and tobacco processing | Food retail and wholesale | Food service | |
|---|---|---|---|---|
| percent | ||||
| French FOLS | ||||
| 2006 | 1.3 | 10.6 | 27.6 | 60.4 |
| 2016 | 2.0 | 11.7 | 21.5 | 64.8 |
| English FOLS | ||||
| 2006 | 1.9 | 10.1 | 32.2 | 55.9 |
| 2016 | 1.5 | 9.6 | 30.0 | 58.9 |
|
||||
Between 2006 and 2016, the proportion of Francophone agri-food workers in British Columbia active in food services increased from 60.4% to 64.8%, and the share working in the food retail and wholesale industry decreased from 27.6% to 21.5%. In 2016, Francophone agri-food workers were more likely to work in food services than their Anglophone counterparts (64.8% versus 58.9%), and Francophone workers were less likely to work in the food retail and wholesale industry than their Anglophone peers (21.5% versus 30.0%).
Lastly, in the territories, about six in ten Francophone agri-food workers worked in food services in 2006 and 2016. This proportion was lower among their Anglophone counterparts in 2016 (38.7%). A higher share of Anglophone agri-food workers worked in the food retail and wholesale industry (58.2%) than their Francophone counterparts (36.7%).
3.9 Languages used at work
Less than 4% of Francophone agri-food workers used only French at work in all the Western provinces in 2016. This proportion was slightly higher in the territories (around 8%).
The proportion of Francophone agri-food workers who used English and French at work was higher. However, this proportion declined between 2006 and 2016 in Manitoba (from 42.6% to 37.9%), Saskatchewan (from 24.8% to 17.2%) and Alberta (from 24.5% to 19.7%). Conversely, the proportion of Francophone agri-food workers who used only English at work increased between 2006 and 2016 in the same three provinces, from 54.5% to 58.0% in Manitoba, from 67.5% to 77.4% in Saskatchewan and from 69.0% to 75.8% in Alberta.
This situation was different in British Columbia. The proportion of Francophone agri-food workers who used English and French at work rose slightly between 2006 and 2016 (from 23.1% to 25.7%). In this province, more than two in three Francophone agri-food workers used only English at work in 2016. In the territories, about 45% of Francophone agri-food workers used only English at work.
Use of English and French at work varied by industry. In 2016, the industries in which the proportion of Francophone workers who used both official languages at work was the highest were food retail and wholesale (45.9%) and input and service supply (43.5%) in Manitoba, and food services in Saskatchewan (20.5%). More than one-fifth of Francophone workers used English and French at work in all the industries of Alberta’s agri-food sector, except in food retail and wholesale, where this proportion was lower (16.6%). In British Columbia, about one-quarter of Francophone workers used English and French at work in each industry of the agri-food sector.
Conclusion
By integrating 2016 Census of Population and Census of Agriculture data, this report presented information and identified trends regarding farms with
Western Canada’s French-language farms differed from English-language farms in several respects in 2016. For example, they were more likely to be family corporations and, depending on the province, differed in their farm type, farm area and gross farm receipts.
Across Western Canada, the proportion of French-language farms operated exclusively by persons aged 55 years or older was higher than for English-language farms, which indicates a more pronounced aging of those farm operators. Moreover, the proportion of Francophone agricultural workers aged 55 years or older rose in all provinces in this study between 2006 and 2016, and the number of Francophone agricultural workers decreased over the decade. Workers retiring or moving on to other sectors of employment could possibly be responsible for this decrease in the workforce, which was relatively larger than that seen among Anglophone agricultural workers. The issue of succession could therefore be more pronounced among Francophones than Anglophones in Western Canada’s agriculture industry. Nevertheless, the proportion of Francophone agricultural workers between the ages of 15 and 34 grew in Manitoba and Alberta between 2006 and 2016.
The decrease in the number of Francophone workers between 2006 and 2016 was more modest in the agri-food sector than in the agriculture sector in Saskatchewan and British Columbia, and the number of Francophone agri-food workers increased in Alberta. The situation in these provinces is not unrelated to the increase, over the decade, in the proportion of Francophone agri-food workers born outside Canada.
Western Canada’s Francophone workers differed from their Anglophone counterparts in other respects in 2016. In the agriculture sector, a higher proportion of Francophone workers were self-employed than among their Anglophone counterparts, and in the agri-food sector, Francophone workers were more likely to have a postsecondary qualification than their Anglophones counterparts. Finally, with regards to languages used at work, the proportion of Francophone agricultural and agri-food workers who used only English at work rose between 2006 and 2016 in all the provinces in this study.Note
In short, this portrait allowed for the identification of trends specific to official language minorities in the agriculture and agri-food industries of Western Canada and the territories. Notably, it showed a more pronounced aging of Francophone agricultural workers and operators of French-language farms. The potential issue of succession resulting from this could be the object of more in-depth studies.
Differences observed between language groups could be related to multiple factors not studied in this descriptive report. Further research would be necessary to assess their contribution.
Glossary
Census farm: A farm, ranch or other agricultural operation that produces at least one of the following products intended for sale: crops, livestock, poultry, animal products, greenhouse or nursery products, Christmas trees, mushrooms, sod, honey or bees, and maple syrup products. Sales in the previous 12 months are not required, but there must be the intention to sell.
Census of Agriculture: Statistics Canada conducts the Census of Agriculture every five years to develop a statistical portrait of Canada’s farms and farm operators. The data provide users with a comprehensive picture of the main characteristics of the agriculture industry as well as information on crop and livestock production, finances and use of technology.
This report uses data from the 2016 Census of Agriculture to provide information on farm operations, such as operating arrangements, age group and generational profile of operators, land tenure, total farm area, total gross farm receipts, and total farm capital. This information is presented according to the first official language spoken by the main operator listed on the 2016 Census of Agriculture for each agricultural operation. The operator’s first official language spoken is derived from their responses to the 2016 Census of Population short questionnaire.
Census of Population: Statistics Canada conducts the Census of Population every five years to provide a statistical portrait of the country and its people on a given day. The census is designed to provide information about people and housing units in Canada by their demographic, social and economic characteristics. A sample of Canadian households (25% in 2016 and 20% 2006) receives a long-form questionnaire. All other households receive a short-form questionnaire.
This report uses data from the 2006 and 2016 censuses of population to present the changes in the characteristics of French- and English-speaking workers in the agriculture and agri-food sectors, based on their first official language. These characteristics include age, sex, place of birth, Indigenous identity, education, class of worker, employment income, languages used at work, and industry domain. In addition, this study uses data from the 2016 Census of Population short form to derive the first official language spoken by the main operator listed on the 2016 Census of Agriculture form for each agricultural operation.
Class of worker: Refers to whether a person is an employee or is self-employed.
Employment income: All income received as wages, salaries and commissions from paid employment and net
Farm area: Refers to land owned or operated by an agricultural operation. This includes cropland, summer fallow, improved and unimproved pasture, woodlands and wetlands, and all other lands (including idle land and land on which farm buildings are located).
Farm capital: Refers to the value of all farmland, buildings, farm machinery and equipment, and livestock and poultry, as reported on Census Day. Farm capital does not include the value of crops in the field or in storage, or farm inputs on hand, such as fertilizer and seed.
Farm operator: The persons responsible for the management decisions of a farm. These can be owners, tenants or hired managers.
First official language spoken: Refers to a variable defined within the framework of the Official Languages Act. It refers to the first official language (i.e. English or French) spoken by the person. The derivation method first takes into account the knowledge of the two official languages, then the mother tongue, and finally the language spoken most often at home.
People are assigned to the “French” category when it is the only official language they speak well enough to conduct a conversation; when they can conduct a conversation in French or in English, or in neither language, and have French as their mother tongue (alone or in combination with a non-official language); or when they can conduct a conversation in French or in English, or in neither language, have both French and English as their mother tongue, or neither language, and speak French most often at home (alone or in combination with a non-official language).
People are assigned to the “English” category when it is the only official language they speak well enough to conduct a conversation; when they can conduct a conversation in French or in English, or in neither language, and have English as their mother tongue (alone or in combination with a non-official language); or when they can conduct a conversation in English or in French, or neither language, have both French and English as their mother tongue, or neither language, and speak English most often at home (alone or in combination with a non‑official language).
People are assigned to “English and French” when they speak both English and French well enough to conduct a conversation and when their mother tongue and language used most often at home are both English and French or neither English nor French.
People are assigned to “neither English nor French” when they speak neither English nor French well enough to conduct a conversation and when their mother tongue and language used most often at home is a language other than English or French.
Gross farm receipt: Refers to the receipts from all agricultural products sold, program payments and custom work receipts of the agricultural operation in the year preceding the census or the last complete accounting (fiscal) year. It does not include sales of forestry products (firewood, pulpwood, logs, fence posts, etc.), capital items (quota, land, machinery, etc.), or receipts from the sale of any goods purchased only for retail sales. It is gross receipts before deducting expenses.
Appendix A
| NAICSTable A.1 Note 1 codes | |||
|---|---|---|---|
| 2016 CensusTable A.1 Note 3 | |||
| 1110 Farms (1111 to 1129) | 1111 Oilseed and grain farming | 1110 Farms (except Greenhouse production and Aquaculture) | 1111 Oilseed and grain farming |
| 1112 Vegetable and melon farming | 1112 Vegetable and melon farming | ||
| 1113 Fruit and tree nut farming | 1113 Fruit and tree nut farming | ||
| 1114 Greenhouse, nursery and floriculture production | 1119 Other crop farming | ||
| 1119 Other crop farming | 1121 Cattle ranching and farming | ||
| 1121 Cattle ranching and farming | 1122 Hog and pig farming | ||
| 1122 Hog and pig farming | 1123 Poultry and egg production | ||
| 1123 Poultry and egg production | 1124 Sheep and goat farming | ||
| 1124 Sheep and goat farming | 1129 Other animal production | ||
| 1125 Animal aquaculture | 1114 Greenhouse, nursery and floriculture production | ||
| 1129 Other animal production | 1125 Aquaculture | ||
|
|||
| Industry | NAICSTable A.2 Note 1 codes | |
|---|---|---|
| 2006 CensusTable A.2 Note 2 | 2016 CensusTable A.2 Note 3 | |
| Input and service supply | 1150 Support activities for agriculture and forestry | 1150 Support activities for agriculture and forestry |
| 3253 Pesticide, fertilizer and other agricultural chemical manufacturing | 3253 Pesticide, fertilizer and other agricultural chemical manufacturing | |
| 4171 Farm, lawn and garden machinery and equipment wholesaler-distributors | 4171 Farm, lawn and garden machinery and equipment merchant wholesalers | |
| 4183 Agricultural supplies wholesaler-distributors | 4183 Agricultural supplies merchant wholesalers | |
| Food, beverage and tobacco processing | 3111 Animal food manufacturing | 3111 Animal food manufacturing |
| 3112 Grain and oilseed milling | 3112 Grain and oilseed milling | |
| 3113 Sugar and confectionery product manufacturing | 3113 Sugar and confectionery product manufacturing | |
| 3114 Fruit and vegetable preserving and specialty food manufacturing | 3114 Fruit and vegetable preserving and specialty food manufacturing | |
| 3115 Dairy product manufacturing | 3115 Dairy product manufacturing | |
| 3116 Meat product manufacturing | 3116 Meat product manufacturing | |
| 3117 Seafood product preparation and packaging | 3117 Seafood product preparation and packaging | |
| 3118 Bakeries and tortilla manufacturing | 3118 Bakeries and tortilla manufacturing | |
| 3119 Other food manufacturing | 3119 Other food manufacturing | |
| 3121 Beverage manufacturing | 3121 Beverage manufacturing | |
| 3122 Tobacco manufacturing | 3122 Tobacco manufacturing | |
| Food retail and wholesale | 4111 Farm product wholesaler-distributors | 4111 Farm product merchant wholesalers |
| 4131 Food wholesaler-distributors | 4131 Food merchant wholesalers | |
| 4132 Beverage wholesaler-distributors | 4132 Beverage merchant wholesalers | |
| 4133 Cigarette and tobacco product wholesaler-distributors | 4133 Cigarette and tobacco product merchant wholesalers | |
| 4451 Grocery stores | 4451 Grocery stores | |
| 4452 Specialty food stores | 4452 Specialty food stores | |
| 4453 Beer, wine and liquor stores | 4453 Beer, wine and liquor stores | |
| Food service | 4542 Vending machine operators | 4542 Vending machine operators |
| 7221 Full-service restaurants | 7223 Special food services | |
| 7222 Limited-service eating places | 7224 Drinking places (alcoholic beverages) | |
| 7223 Special food services | 7225 Full-service restaurants and limited-service eating places | |
| 7224 Drinking places (alcoholic beverages) | Note ...: not applicable | |
|
||
Appendix B
| CAR | FOLS | |||||||
|---|---|---|---|---|---|---|---|---|
| 2006 | 2016 | |||||||
| French | English | Neither English nor French |
Total | French | English | Neither English nor French |
Total | |
| number | ||||||||
| CAR 1 (Man.) | 30 | 2,395 | 0 | 2,425 | 0 | 1,865 | 0 | 1,870 |
| CAR 2 (Man.) | 60 | 3,865 | 0 | 3,925 | 35 | 3,000 | 15 | 3,040 |
| CAR 3 (Man.) | 35 | 2,685 | 0 | 2,730 | 20 | 1,900 | 0 | 1,915 |
| CAR 4 (Man.) | 0 | 1,140 | 0 | 1,145 | 0 | 1,005 | 0 | 1,010 |
| CAR 5 (Man.) | 0 | 935 | 0 | 940 | 0 | 785 | 0 | 785 |
| CAR 6 (Man.) | 130 | 2,025 | 0 | 2,155 | 35 | 1,670 | 0 | 1,705 |
| CAR 7 (Man.) | 340 | 5,130 | 0 | 5,475 | 275 | 3,105 | 0 | 3,385 |
| CAR 8 (Man.) | 295 | 5,300 | 75 | 5,665 | 275 | 4,515 | 50 | 4,840 |
| CAR 9 (Man.) | 505 | 5,445 | 65 | 6,015 | 440 | 6,230 | 115 | 6,780 |
| CAR 10 (Man.) | 35 | 995 | 0 | 1,030 | 30 | 595 | 0 | 625 |
| CAR 11 (Man.) | 0 | 2,175 | 0 | 2,180 | 15 | 1,415 | 0 | 1,430 |
| CAR 12 (Man.) | 30 | 1,995 | 0 | 2,025 | 25 | 1,920 | 15 | 1,965 |
| Total | 1,480 | 34,080 | 160 | 35,715 | 1,165 | 27,990 | 195 | 29,350 |
| percent | ||||||||
| CAR 1 (Man.) | 1.2 | 98.8 | 0.0 | 100.0 | 0.0 | 99.7 | 0.0 | 100.0 |
| CAR 2 (Man.) | 1.5 | 98.4 | 0.0 | 100.0 | 1.1 | 98.5 | 0.4 | 100.0 |
| CAR 3 (Man.) | 1.3 | 98.4 | 0.0 | 100.0 | 0.9 | 99.1 | 0.0 | 100.0 |
| CAR 4 (Man.) | 0.0 | 99.6 | 0.0 | 100.0 | 0.0 | 99.3 | 0.0 | 100.0 |
| CAR 5 (Man.) | 0.0 | 99.3 | 0.0 | 100.0 | 0.0 | 100.0 | 0.0 | 100.0 |
| CAR 6 (Man.) | 6.1 | 93.9 | 0.0 | 100.0 | 2.2 | 97.8 | 0.0 | 100.0 |
| CAR 7 (Man.) | 6.2 | 93.8 | 0.0 | 100.0 | 8.2 | 91.8 | 0.0 | 100.0 |
| CAR 8 (Man.) | 5.2 | 93.4 | 1.4 | 100.0 | 5.7 | 93.3 | 1.0 | 100.0 |
| CAR 9 (Man.) | 8.4 | 90.5 | 1.1 | 100.0 | 6.5 | 91.9 | 1.7 | 100.0 |
| CAR 10 (Man.) | 3.4 | 96.1 | 0.0 | 100.0 | 4.9 | 95.1 | 0.0 | 100.0 |
| CAR 11 (Man.) | 0.0 | 99.6 | 0.0 | 100.0 | 1.1 | 98.9 | 0.0 | 100.0 |
| CAR 12 (Man.) | 1.4 | 98.6 | 0.0 | 100.0 | 1.3 | 97.9 | 0.9 | 100.0 |
| Total | 4.1 | 95.4 | 0.4 | 100.0 | 4.0 | 95.4 | 0.7 | 100.0 |
Sources: Statistics Canada, 2006 and 2016 censuses of population. |
||||||||
| CAR | FOLS | |||||||
|---|---|---|---|---|---|---|---|---|
| 2006 | 2016 | |||||||
| French | English | Neither English nor French |
Total | French | English | Neither English nor French |
Total | |
| number | ||||||||
| CAR 1 (Sask.) | 125 | 12,180 | 15 | 12,315 | 135 | 10,710 | 0 | 10,840 |
| CAR 2 (Sask.) | 85 | 7,440 | 0 | 7,520 | 35 | 7,785 | 0 | 7,820 |
| CAR 3 (Sask.) | 325 | 13,340 | 0 | 13,665 | 230 | 11,040 | 15 | 11,280 |
| CAR 4 (Sask.) | 130 | 11,960 | 80 | 12,170 | 120 | 10,765 | 30 | 10,915 |
| CAR 5 (Sask.) | 85 | 4,505 | 0 | 4,590 | 55 | 3,920 | 0 | 3,970 |
| CAR 6 (Sask.) | 530 | 10,290 | 0 | 10,830 | 390 | 8,815 | 0 | 9,205 |
| CAR 7 (Sask.) | 0 | 40 | 0 | 40 | 0 | 65 | 0 | 65 |
| Total | 1,280 | 59,750 | 105 | 61,135 | 960 | 53,090 | 60 | 54,105 |
| percent | ||||||||
| CAR 1 (Sask.) | 1.0 | 98.9 | 0.1 | 100.0 | 1.2 | 98.8 | 0.0 | 100.0 |
| CAR 2 (Sask.) | 1.1 | 98.9 | 0.0 | 100.0 | 0.4 | 99.5 | 0.0 | 100.0 |
| CAR 3 (Sask.) | 2.3 | 97.6 | 0.0 | 100.0 | 2.0 | 97.8 | 0.1 | 100.0 |
| CAR 4 (Sask.) | 1.1 | 98.3 | 0.6 | 100.0 | 1.1 | 98.6 | 0.3 | 100.0 |
| CAR 5 (Sask.) | 1.9 | 98.1 | 0.0 | 100.0 | 1.4 | 98.6 | 0.0 | 100.0 |
| CAR 6 (Sask.) | 4.9 | 95.0 | 0.0 | 100.0 | 4.2 | 95.7 | 0.0 | 100.0 |
| CAR 7 (Sask.) | 0.0 | 95.3 | 0.0 | 100.0 | 0.0 | 100.0 | 0.0 | 100.0 |
| Total | 2.1 | 97.7 | 0.2 | 100.0 | 1.8 | 98.1 | 0.1 | 100.0 |
Sources: Statistics Canada, 2006 and 2016 censuses of population. |
||||||||
| CAR | FOLS | |||||||
|---|---|---|---|---|---|---|---|---|
| 2006 | 2016 | |||||||
| French | English | Neither English nor French |
Total | French | English | Neither English nor French |
Total | |
| number | ||||||||
| CAR 1 (Alta.) | 30 | 5,555 | 20 | 5,605 | 15 | 4,050 | 50 | 4,110 |
| CAR 2 (Alta.) | 20 | 14,040 | 55 | 14,110 | 50 | 11,440 | 90 | 11,585 |
| CAR 3 (Alta.) | 35 | 11,420 | 50 | 11,500 | 60 | 10,420 | 105 | 10,585 |
| CAR 4A (Alta.) | 30 | 4,385 | 0 | 4,420 | 0 | 3,660 | 0 | 3,665 |
| CAR 4B (Alta.) | 0 | 6,750 | 0 | 6,760 | 15 | 5,625 | 0 | 5,650 |
| CAR 5 (Alta.) | 235 | 15,565 | 60 | 15,860 | 220 | 14,915 | 155 | 15,290 |
| CAR 6 (Alta.) | 405 | 8,050 | 0 | 8,455 | 245 | 7,115 | 0 | 7,360 |
| CAR 7 (Alta.) | 640 | 6,670 | 0 | 7,320 | 445 | 5,920 | 20 | 6,380 |
| Total | 1,390 | 72,440 | 195 | 74,030 | 1,060 | 63,145 | 425 | 64,630 |
| percent | ||||||||
| CAR 1 (Alta.) | 0.5 | 99.1 | 0.4 | 100.0 | 0.3 | 98.5 | 1.2 | 100.0 |
| CAR 2 (Alta.) | 0.1 | 99.5 | 0.4 | 100.0 | 0.5 | 98.8 | 0.8 | 100.0 |
| CAR 3 (Alta.) | 0.3 | 99.3 | 0.4 | 100.0 | 0.6 | 98.5 | 1.0 | 100.0 |
| CAR 4A (Alta.) | 0.8 | 99.2 | 0.0 | 100.0 | 0.0 | 99.8 | 0.0 | 100.0 |
| CAR 4B (Alta.) | 0.0 | 99.9 | 0.0 | 100.0 | 0.3 | 99.6 | 0.0 | 100.0 |
| CAR 5 (Alta.) | 1.5 | 98.1 | 0.4 | 100.0 | 1.4 | 97.6 | 1.0 | 100.0 |
| CAR 6 (Alta.) | 4.8 | 95.2 | 0.0 | 100.0 | 3.3 | 96.6 | 0.0 | 100.0 |
| CAR 7 (Alta.) | 8.7 | 91.2 | 0.0 | 100.0 | 6.9 | 92.8 | 0.3 | 100.0 |
| Total | 1.9 | 97.9 | 0.3 | 100.0 | 1.6 | 97.7 | 0.7 | 100.0 |
Sources: Statistics Canada, 2006 and 2016 censuses of population. |
||||||||
| CAR | FOLS | |||||||
|---|---|---|---|---|---|---|---|---|
| 2006 | 2016 | |||||||
| French | English | Neither English nor French | Total | French | English | Neither English nor French | Total | |
| number | ||||||||
| Vancouver Island—Coast (CAR 1) | 105 | 5,710 | 60 | 5,870 | 85 | 5,970 | 95 | 6,150 |
| Lower Mainland—Southwest (CAR 2) | 225 | 17,620 | 4,740 | 22,585 | 175 | 17,200 | 4,960 | 22,340 |
| Thompson—Okanagan |
235 | 9,425 | 310 | 9,970 | 195 | 7,975 | 270 | 8,440 |
| Kootenay (CAR 4) | 25 | 1,955 | 0 | 1,980 | 30 | 2,010 | 0 | 2,035 |
| Cariboo (CAR 5) | 30 | 2,325 | 10 | 2,365 | 20 | 1,680 | 15 | 1,720 |
| North Coast (CAR 6) | 0 | 290 | 0 | 295 | 0 | 220 | 0 | 225 |
| Nechako (CAR 7) | 0 | 955 | 0 | 965 | 0 | 1,075 | 0 | 1,080 |
| Peace River (CAR 8) | 25 | 1,905 | 20 | 1,945 | 0 | 1,465 | 0 | 1,475 |
| Total | 655 | 40,185 | 5,145 | 45,985 | 515 | 37,600 | 5,350 | 43,460 |
| percent | ||||||||
| Vancouver Island—Coast (CAR 1) | 1.8 | 97.2 | 1.0 | 100.0 | 1.4 | 97.0 | 1.5 | 100.0 |
| Lower Mainland—Southwest (CAR 2) | 1.0 | 78.0 | 21.0 | 100.0 | 0.8 | 77.0 | 22.2 | 100.0 |
| Thompson—Okanagan |
2.4 | 94.5 | 3.1 | 100.0 | 2.3 | 94.5 | 3.2 | 100.0 |
| Kootenay (CAR 4) | 1.2 | 98.8 | 0.0 | 100.0 | 1.4 | 98.6 | 0.0 | 100.0 |
| Cariboo (CAR 5) | 1.3 | 98.1 | 0.6 | 100.0 | 1.2 | 98.0 | 0.9 | 100.0 |
| North Coast (CAR 6) | 0.0 | 98.4 | 0.0 | 100.0 | 0.0 | 100.0 | 0.0 | 100.0 |
| Nechako (CAR 7) | 0.0 | 99.1 | 0.0 | 100.0 | 0.0 | 99.7 | 0.0 | 100.0 |
| Peace River (CAR 8) | 1.3 | 97.9 | 0.9 | 100.0 | 0.0 | 99.5 | 0.0 | 100.0 |
| Total | 1.4 | 87.4 | 11.2 | 100.0 | 1.2 | 86.5 | 12.3 | 100.0 |
Sources: Statistics Canada, 2006 and 2016 censuses of population. |
||||||||
Appendix C
| CAR | FOLS | |||||||
|---|---|---|---|---|---|---|---|---|
| 2006 | 2016 | |||||||
| French | English | Neither English nor French |
Total | French | English | Neither English nor French |
Total | |
| number | ||||||||
| CAR 1 (Man.) | 0 | 875 | 0 | 880 | 10 | 955 | 0 | 965 |
| CAR 2 (Man.) | 100 | 6,305 | 105 | 6,455 | 70 | 6,905 | 485 | 7,465 |
| CAR 3 (Man.) | 30 | 1,360 | 0 | 1,450 | 25 | 1,975 | 0 | 2,000 |
| CAR 4 (Man.) | 0 | 615 | 0 | 615 | 0 | 540 | 0 | 540 |
| CAR 5 (Man.) | 0 | 530 | 0 | 530 | 0 | 505 | 0 | 520 |
| CAR 6 (Man.) | 25 | 1,050 | 0 | 1,080 | 30 | 1,190 | 0 | 1,220 |
| CAR 7 (Man.) | 185 | 3,415 | 10 | 3,640 | 105 | 3,070 | 0 | 3,185 |
| CAR 8 (Man.) | 155 | 3,020 | 25 | 3,220 | 105 | 3,820 | 40 | 3,965 |
| CAR 9 (Man.) | 1,535 | 45,880 | 435 | 47,800 | 1,220 | 49,950 | 1,080 | 52,250 |
| CAR 10 (Man.) | 30 | 735 | 0 | 760 | 35 | 795 | 0 | 835 |
| CAR 11 (Man.) | 30 | 3,450 | 0 | 3,475 | 40 | 3,235 | 0 | 3,275 |
| CAR 12 (Man.) | 65 | 4,510 | 25 | 4,595 | 30 | 4,350 | 0 | 4,390 |
| Total | 2,150 | 71,745 | 605 | 74,500 | 1,695 | 77,295 | 1,630 | 80,620 |
| percent | ||||||||
| CAR 1 (Man.) | 0.0 | 99.5 | 0.0 | 100.0 | 1.3 | 98.7 | 0.0 | 100.0 |
| CAR 2 (Man.) | 1.5 | 96.9 | 1.6 | 100.0 | 1.0 | 92.5 | 6.5 | 100.0 |
| CAR 3 (Man.) | 2.3 | 97.7 | 0.0 | 100.0 | 1.1 | 98.7 | 0.0 | 100.0 |
| CAR 4 (Man.) | 0.0 | 100.0 | 0.0 | 100.0 | 0.0 | 99.1 | 0.0 | 100.0 |
| CAR 5 (Man.) | 0.0 | 99.8 | 0.0 | 100.0 | 0.0 | 97.6 | 0.0 | 100.0 |
| CAR 6 (Man.) | 2.0 | 97.2 | 0.0 | 100.0 | 2.7 | 97.3 | 0.0 | 100.0 |
| CAR 7 (Man.) | 5.1 | 94.6 | 0.3 | 100.0 | 3.4 | 96.3 | 0.0 | 100.0 |
| CAR 8 (Man.) | 4.9 | 94.4 | 0.7 | 100.0 | 2.7 | 96.4 | 0.9 | 100.0 |
| CAR 9 (Man.) | 3.2 | 95.9 | 0.9 | 100.0 | 2.3 | 95.6 | 2.1 | 100.0 |
| CAR 10 (Man.) | 3.8 | 96.2 | 0.0 | 100.0 | 4.5 | 95.1 | 0.0 | 100.0 |
| CAR 11 (Man.) | 0.8 | 99.2 | 0.0 | 100.0 | 1.2 | 98.8 | 0.0 | 100.0 |
| CAR 12 (Man.) | 1.4 | 98.1 | 0.5 | 100.0 | 0.7 | 99.2 | 0.0 | 100.0 |
| Total | 2.9 | 96.3 | 0.8 | 100.0 | 2.1 | 95.9 | 2.0 | 100.0 |
Sources: Statistics Canada, 2006 and 2016 censuses of population. |
||||||||
| CAR | FOLS | |||||||
|---|---|---|---|---|---|---|---|---|
| 2006 | 2016 | |||||||
| French | English | Neither English nor French |
Total | French | English | Neither English nor French |
Total | |
| number | ||||||||
| CAR 1 (Sask.) | 40 | 6,960 | 30 | 7,025 | 50 | 6,710 | 60 | 6,820 |
| CAR 2 (Sask.) | 125 | 15,820 | 70 | 16,005 | 115 | 17,535 | 265 | 17,920 |
| CAR 3 (Sask.) | 45 | 6,450 | 50 | 6,545 | 115 | 6,205 | 25 | 6,345 |
| CAR 4 (Sask.) | 175 | 21,620 | 65 | 21,865 | 215 | 23,245 | 365 | 23,830 |
| CAR 5 (Sask.) | 20 | 2,350 | 0 | 2,365 | 15 | 2,255 | 0 | 2,270 |
| CAR 6 (Sask.) | 235 | 9,280 | 0 | 9,530 | 90 | 8,940 | 20 | 9,055 |
| CAR 7 (Sask.) | 0 | 980 | 0 | 985 | 0 | 1,075 | 0 | 1,080 |
| Total | 645 | 63,450 | 230 | 64,325 | 600 | 65,975 | 740 | 67,315 |
| percent | ||||||||
| CAR 1 (Sask.) | 0.5 | 99.0 | 0.4 | 100.0 | 0.7 | 98.4 | 0.9 | 100.0 |
| CAR 2 (Sask.) | 0.8 | 98.8 | 0.4 | 100.0 | 0.7 | 97.9 | 1.5 | 100.0 |
| CAR 3 (Sask.) | 0.7 | 98.5 | 0.8 | 100.0 | 1.8 | 97.8 | 0.4 | 100.0 |
| CAR 4 (Sask.) | 0.8 | 98.9 | 0.3 | 100.0 | 0.9 | 97.6 | 1.5 | 100.0 |
| CAR 5 (Sask.) | 0.8 | 99.2 | 0.0 | 100.0 | 0.6 | 99.4 | 0.0 | 100.0 |
| CAR 6 (Sask.) | 2.5 | 97.4 | 0.0 | 100.0 | 1.0 | 98.8 | 0.2 | 100.0 |
| CAR 7 (Sask.) | 0.0 | 99.4 | 0.0 | 100.0 | 0.0 | 99.6 | 0.0 | 100.0 |
| Total | 1.0 | 98.6 | 0.4 | 100.0 | 0.9 | 98.0 | 1.1 | 100.0 |
Sources: Statistics Canada, 2006 and 2016 censuses of population. |
||||||||
| CAR | FOLS | |||||||
|---|---|---|---|---|---|---|---|---|
| 2006 | 2016 | |||||||
| French | English | Neither English nor French |
Total | French | English | Neither English nor French |
Total | |
| number | ||||||||
| CAR 1 (Alta.) | 0 | 5,865 | 65 | 5,940 | 25 | 5,570 | 15 | 5,610 |
| CAR 2 (Alta.) | 260 | 15,850 | 170 | 16,280 | 230 | 17,090 | 310 | 17,635 |
| CAR 3 (Alta.) | 1,310 | 84,290 | 2,155 | 87,760 | 1,700 | 99,035 | 2,910 | 103,645 |
| CAR 4A (Alta.) | 25 | 2,190 | 0 | 2,210 | 30 | 1,970 | 0 | 2,000 |
| CAR 4B (Alta.) | 60 | 4,890 | 0 | 4,955 | 40 | 5,110 | 15 | 5,170 |
| CAR 5 (Alta.) | 1,395 | 82,840 | 1,275 | 85,510 | 1,675 | 96,095 | 1,825 | 99,600 |
| CAR 6 (Alta.) | 420 | 11,580 | 20 | 12,020 | 330 | 11,510 | 65 | 11,905 |
| CAR 7 (Alta.) | 225 | 8,890 | 25 | 9,140 | 155 | 9,770 | 50 | 9,975 |
| Total | 3,710 | 216,385 | 3,715 | 223,810 | 4,190 | 246,155 | 5,195 | 255,535 |
| percent | ||||||||
| CAR 1 (Alta.) | 0.0 | 98.8 | 1.1 | 100.0 | 0.5 | 99.3 | 0.3 | 100.0 |
| CAR 2 (Alta.) | 1.6 | 97.4 | 1.0 | 100.0 | 1.3 | 96.9 | 1.8 | 100.0 |
| CAR 3 (Alta.) | 1.5 | 96.0 | 2.5 | 100.0 | 1.6 | 95.6 | 2.8 | 100.0 |
| CAR 4A (Alta.) | 1.1 | 98.9 | 0.0 | 100.0 | 1.5 | 98.5 | 0.0 | 100.0 |
| CAR 4B (Alta.) | 1.2 | 98.7 | 0.0 | 100.0 | 0.8 | 98.9 | 0.3 | 100.0 |
| CAR 5 (Alta.) | 1.6 | 96.9 | 1.5 | 100.0 | 1.7 | 96.5 | 1.8 | 100.0 |
| CAR 6 (Alta.) | 3.5 | 96.3 | 0.2 | 100.0 | 2.8 | 96.7 | 0.5 | 100.0 |
| CAR 7 (Alta.) | 2.5 | 97.2 | 0.3 | 100.0 | 1.5 | 98.0 | 0.5 | 100.0 |
| Total | 1.7 | 96.7 | 1.7 | 100.0 | 1.6 | 96.3 | 2.0 | 100.0 |
Sources: Statistics Canada, 2006 and 2016 censuses of population. |
||||||||
| CAR | FOLS | |||||||
|---|---|---|---|---|---|---|---|---|
| 2006 | 2016 | |||||||
| French | English | Neither English nor French | Total | French | English | Neither English nor French | Total | |
| number | ||||||||
| Vancouver Island—Coast (CAR 1) | 725 | 48,205 | 435 | 49,365 | 625 | 51,825 | 530 | 52,985 |
| Lower Mainland—Southwest (CAR 2) | 2,130 | 168,180 | 10,805 | 181,115 | 2,175 | 197,485 | 13,625 | 213,285 |
| Thompson—Okanagan |
400 | 32,920 | 135 | 33,455 | 425 | 36,855 | 215 | 37,490 |
| Kootenay (CAR 4) | 130 | 8,590 | 0 | 8,720 | 120 | 9,240 | 35 | 9,395 |
| Cariboo (CAR 5) | 60 | 9,325 | 50 | 9,430 | 45 | 8,975 | 70 | 9,095 |
| North Coast (CAR 6) | 50 | 3,765 | 25 | 3,840 | 20 | 3,565 | 40 | 3,630 |
| Nechako (CAR 7) | 20 | 1,780 | 20 | 1,815 | 15 | 1,950 | 0 | 1,970 |
| Peace River (CAR 8) | 35 | 3,740 | 15 | 3,795 | 20 | 3,785 | 20 | 3,825 |
| Total | 3,560 | 276,505 | 11,485 | 291,540 | 3,450 | 313,675 | 14,550 | 331,675 |
| percent | ||||||||
| Vancouver Island—Coast (CAR 1) | 1.5 | 97.6 | 0.9 | 100.0 | 1.2 | 97.8 | 1.0 | 100.0 |
| Lower Mainland—Southwest (CAR 2) | 1.2 | 92.9 | 6.0 | 100.0 | 1.0 | 92.6 | 6.4 | 100.0 |
| Thompson—Okanagan |
1.2 | 98.4 | 0.4 | 100.0 | 1.1 | 98.3 | 0.6 | 100.0 |
| Kootenay (CAR 4) | 1.5 | 98.5 | 0.0 | 100.0 | 1.3 | 98.4 | 0.4 | 100.0 |
| Cariboo (CAR 5) | 0.6 | 98.9 | 0.5 | 100.0 | 0.5 | 98.7 | 0.8 | 100.0 |
| North Coast (CAR 6) | 1.3 | 98.0 | 0.6 | 100.0 | 0.6 | 98.3 | 1.1 | 100.0 |
| Nechako (CAR 7) | 1.3 | 97.8 | 0.9 | 100.0 | 0.8 | 98.9 | 0.0 | 100.0 |
| Peace River (CAR 8) | 0.9 | 98.6 | 0.4 | 100.0 | 0.5 | 98.9 | 0.5 | 100.0 |
| Total | 1.2 | 94.8 | 3.9 | 100.0 | 1.0 | 94.6 | 4.4 | 100.0 |
Sources: Statistics Canada, 2006 and 2016 censuses of population. |
||||||||
- Date modified: