
Ethnicity, Language and Immigration Thematic Series
The French Language in Yukon, Northwest Territories and Nunavut, 2001 to 2016: Facts and Figures

Archived Content
Information identified as archived is provided for reference, research or recordkeeping purposes. It is not subject to the Government of Canada Web Standards and has not been altered or updated since it was archived. Please "contact us" to request a format other than those available.
by Alejandro A. Páez Silva
Skip to text
Text begins
The purpose of this document is to present an overview of the prevailing trends observed between 2001 and 2016Note 1for the French language in the Territories as a whole. To this end, the document provides census-based information on the populationNote 2who have French as a first official language spoken, mother tongue, language spoken at home or language used at work as well as on the population who reported speaking French well enough to conduct a conversation. Wherever relevant, facts on each individual territory (i.e. Yukon, Northwest Territories or Nunavut) are provided.
Description for Map 1
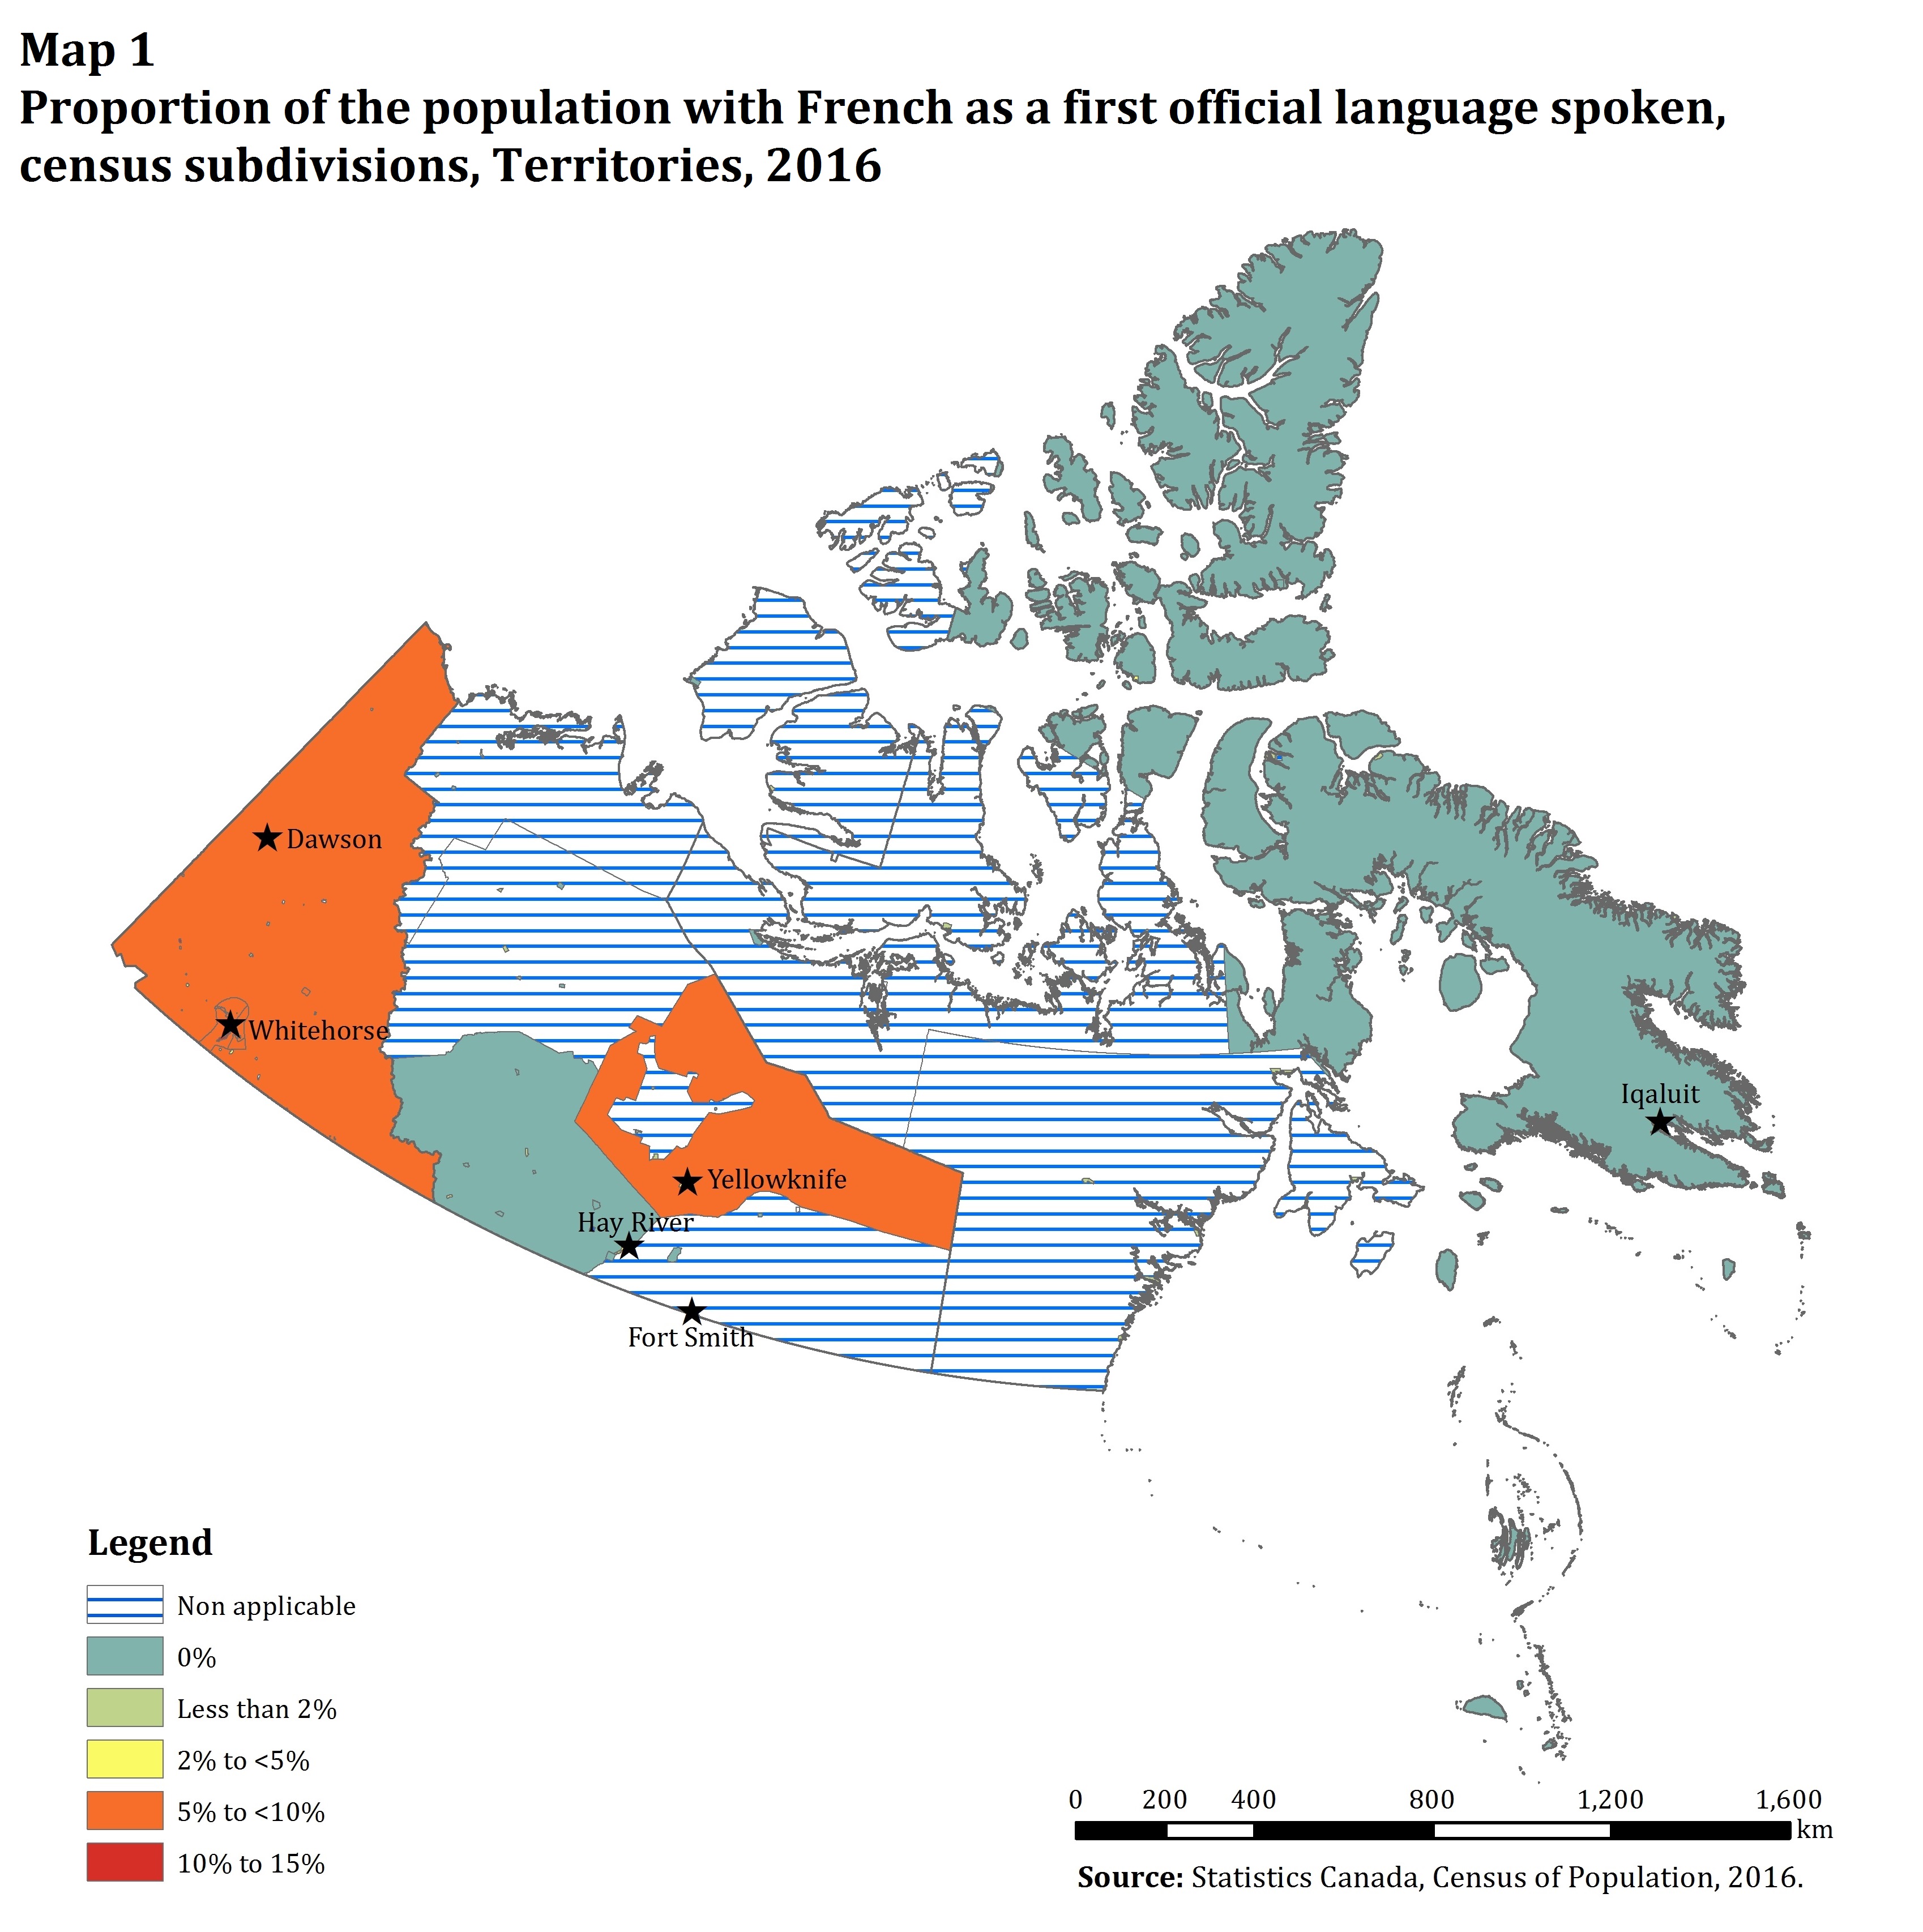
This map shows the proportion of the population with French as their first official language spoken found in each census subdivision in the territories in 2016.
In this map we use six distinct colours to signify different values. Blue stripes are used to represent areas for which no data are available. There are 23 census subdivisions in this group.
A solid teal colour is used to represent areas in which no one with French as their first official language spoken resides. There are 33 census subdivisions in this group.
A solid green colour is used to represent areas in which those with French as their first official language spoken constitute less than 2% of the total population. There are 22 census subdivisions in this group.
A solid yellow colour is used to represent areas in which those with French as their first official language spoken constitute between 2% and less than 5% of the total population. There are 16 census subdivisions in this group.
A solid orange colour was used to represent areas in which those with French as their first official language spoken constitute between 5% and less than 10% of the total population. There are 12 census subdivisions in this group.
A solid dark red colour was used to represent areas in which those with French as their first official language spoken constitute between 10% and less than 15% of the total population. There are 2 census subdivisions in this group.
The borders of each census subdivision are delineated by a grey line and each census subdivision is assigned a colour based on the table below.
| Census Subdivision | French as First Official Language Spoken - Number | French as First Official Language Spoken - Percent | Total Population |
|---|---|---|---|
| 6001003 | 15 | 1.9 | 790 |
| 6001004 | 30 | 8.6 | 350 |
| 6001006 | 0 | 0.0 | 120 |
| 6001007 | 0 | 0.0 | 140 |
| 6001009 | 1,123 | 4.5 | 24,780 |
| 6001012 | 5 | 1.0 | 490 |
| 6001018 | 18 | 2.8 | 615 |
| 6001022 | 5 | 2.5 | 200 |
| 6001029 | 70 | 5.1 | 1,365 |
| 6001032 | 0 | 0.0 | 125 |
| 6001035 | 0 | 0.0 | 190 |
| 6001036 | 10 | 4.0 | 250 |
| 6001037 | 5 | 1.7 | 290 |
| 6001039 | 10 | 14.3 | 70 |
| 6001041 | 0 | 0.0 | 355 |
| 6001042 | 5 | 5.3 | 95 |
| 6001043 | 5 | 2.3 | 215 |
| 6001044 | 55 | 12.5 | 440 |
| 6001045 | 83 | 5.4 | 1,515 |
| 6001048 | 10 | 3.3 | 300 |
| 6001049 | 5 | 9.1 | 55 |
| 6001055 | 28 | 6.6 | 415 |
| 6001058 | 53 | 7.6 | 695 |
| 6001059 | 73 | 5.8 | 1,245 |
| 6001060 | 25 | 7.7 | 325 |
| 6001008 | 0 | 0.0 | 0 |
| 6001010 | 0 | 0.0 | 0 |
| 6001016 | 0 | 0.0 | 0 |
| 6001019 | 0 | 0.0 | 0 |
| 6001031 | 0 | 0.0 | 0 |
| 6001038 | 0 | 0.0 | 0 |
| 6001046 | 0 | 0.0 | 0 |
| 6001047 | 0 | 0.0 | 0 |
| 6001050 | 0 | 0.0 | 0 |
| 6001052 | 0 | 0.0 | 0 |
| 6001057 | 0 | 0.0 | 0 |
| 6101010 | 0 | 0.0 | 170 |
| 6101014 | 0 | 0.0 | 265 |
| 6101015 | 0 | 0.0 | 700 |
| 6101017 | 50 | 1.6 | 3,140 |
| 6101025 | 0 | 0.0 | 590 |
| 6101036 | 15 | 1.7 | 895 |
| 6101041 | 0 | 0.0 | 105 |
| 6101095 | 5 | 1.3 | 395 |
| 6102003 | 0 | 0.0 | 535 |
| 6102005 | 0 | 0.0 | 475 |
| 6102007 | 15 | 1.9 | 775 |
| 6102009 | 5 | 1.0 | 515 |
| 6102012 | 0 | 0.0 | 125 |
| 6103031 | 5 | 0.3 | 1,865 |
| 6103034 | 0 | 0.0 | 470 |
| 6103049 | 0 | 0.0 | 280 |
| 6103052 | 0 | 0.0 | 130 |
| 6104006 | 0 | 0.0 | 85 |
| 6104009 | 5 | 1.0 | 500 |
| 6104010 | 0 | 0.0 | 85 |
| 6104013 | 0 | 0.0 | 75 |
| 6104014 | 0 | 0.0 | 695 |
| 6104017 | 0 | 0.0 | 310 |
| 6104038 | 15 | 1.3 | 1,185 |
| 6104044 | 0 | 0.0 | 120 |
| 6104097 | 0 | 0.0 | 45 |
| 6105001 | 63 | 2.5 | 2,500 |
| 6105003 | 0 | 0.0 | 105 |
| 6105016 | 95 | 2.7 | 3,465 |
| 6105018 | 0 | 0.0 | 470 |
| 6105020 | 0 | 0.0 | 300 |
| 6106021 | 0 | 0.0 | 220 |
| 6106023 | 920 | 4.7 | 19,405 |
| 6106097 | 20 | 6.6 | 305 |
| 6101063 | 0 | 0.0 | 0 |
| 6102063 | 0 | 0.0 | 0 |
| 6103097 | 0 | 0.0 | 0 |
| 6104005 | 0 | 0.0 | 0 |
| 6105004 | 0 | 0.0 | 0 |
| 6105026 | 0 | 0.0 | 0 |
| 6105097 | 0 | 0.0 | 0 |
| 6204001 | 0 | 0.0 | 880 |
| 6204003 | 478 | 6.3 | 7,600 |
| 6204005 | 5 | 1.3 | 385 |
| 6204007 | 8 | 0.5 | 1,445 |
| 6204009 | 15 | 1.0 | 1,485 |
| 6204010 | 10 | 1.7 | 600 |
| 6204011 | 5 | 0.6 | 850 |
| 6204012 | 5 | 0.3 | 1,670 |
| 6204015 | 0 | 0.0 | 1,050 |
| 6204018 | 13 | 1.4 | 865 |
| 6204020 | 8 | 0.5 | 1,615 |
| 6204022 | 5 | 2.5 | 200 |
| 6204025 | 0 | 0.0 | 125 |
| 6204030 | 0 | 0.0 | 65 |
| 6205014 | 3 | 0.3 | 895 |
| 6205015 | 10 | 0.4 | 2,660 |
| 6205016 | 8 | 1.7 | 435 |
| 6205017 | 23 | 0.8 | 2,790 |
| 6205019 | 3 | 0.6 | 425 |
| 6205023 | 5 | 0.2 | 2,060 |
| 6205027 | 10 | 0.9 | 1,080 |
| 6208047 | 5 | 0.5 | 930 |
| 6208059 | 0 | 0.0 | 1,485 |
| 6208073 | 18 | 1.0 | 1,765 |
| 6208081 | 3 | 0.2 | 1,310 |
| 6208087 | 0 | 0.0 | 1,030 |
| 6204019 | 0 | 0.0 | 0 |
| 6205033 | 0 | 0.0 | 0 |
| 6208065 | 0 | 0.0 | 0 |
| 6208068 | 0 | 0.0 | 0 |
| 6208098 | 0 | 0.0 | 0 |
- In 2016, 3,505 persons had French as a first official language spoken and they represented 3.1% of the total population of the Territories.
- Since 2001, the number of persons for whom French is a first official language spoken rose by 58.2%, that is, by an additional 1,290 persons in that time.
- The largest increases in the population with French as a first official language spoken among the territories occurred among those residing in Yukon rising from 890 to 1,640, an 84.3% increase. By comparison, this population rose by 35.0% in the Northwest Territories (+320 persons) and by 51.8% in Nunavut (+215 persons).
| 2001 | 2006 | 2011 | 2016 | 2001 to 2016 growth |
|||||
|---|---|---|---|---|---|---|---|---|---|
| number | percent | number | percent | number | percent | number | percent | percent | |
| Total populationTable 1 Note 1 | 92,285 | 100.0 | 100,580 | 100.0 | 106,460 | 100.0 | 112,635 | 100.0 | 22.1 |
| French as first official language spokenTable 1 Note 2 | 2,215 | 2.4 | 2,610 | 2.6 | 3,040 | 2.9 | 3,505 | 3.1 | 58.2 |
| Knowledge of FrenchTable 1 Note 3 | 7,150 | 7.7 | 8,465 | 8.4 | 9,515 | 8.9 | 10,915 | 9.7 | 52.7 |
| Knowledge of French only | 115 | 0.1 | 180 | 0.2 | 170 | 0.2 | 210 | 0.2 | 82.6 |
| Knowledge of English and French | 7,035 | 7.6 | 8,285 | 8.2 | 9,345 | 8.8 | 10,705 | 9.5 | 52.2 |
| French as mother tongueTable 1 Note 3 | 2,450 | 2.7 | 2,660 | 2.6 | 3,245 | 3.0 | 3,820 | 3.4 | 55.9 |
| French spoken at homeTable 1 Note 4 | 2,315 | 2.5 | 2,670 | 2.7 | 3,515 | 3.3 | 4,205 | 3.7 | 81.6 |
| French spoken most often at homeTable 1 Note 5 | 1,115 | 1.2 | 1,320 | 1.3 | 1,815 | 1.7 | 2,150 | 1.9 | 92.8 |
| Only French spoken at homeTable 1 Note 6 | 510 | 0.6 | 620 | 0.6 | 770 | 0.7 | 925 | 0.8 | 81.4 |
| Mostly French spoken at homeTable 1 Note 7 | 485 | 0.5 | 560 | 0.6 | 850 | 0.8 | 900 | 0.8 | 85.6 |
| French spoken equally often with another language at homeTable 1 Note 8 |
120 | 0.1 | 140 | 0.1 | 195 | 0.2 | 325 | 0.3 | 170.8 |
| French spoken regularly at home (in addition to the main language) |
1,200 | 1.3 | 1,350 | 1.3 | 1,700 | 1.6 | 2,055 | 1.8 | 71.3 |
|
|||||||||
- As of 2016, the number of persons able to conduct a conversation in French, either exclusively or in combination with another language, stood at 10,915 and represented 9.7% of the Territories’ total population.
- In the 2001 to 2016 period, the number of persons who report being able to conduct a conversation in French increased by 52.7% (+3,765 persons) in the Territories. Among the three territories, the largest increase of this population in both relative (+69.7%) and absolute (+2,050 persons) terms occurred in Yukon.
- Similarly, in 2016, the number of persons who reported being able to conduct a conversation in both English and French stood at 10,705 in the Territories which represents an English-French bilingualism rate of 9.5%. The English-French bilingualism rate in Yukon, Northwest Territories and Nunavut stood at 13.8%, 10.3% and 4.3% respectively.
- Since 2001, English-French bilingualism in the Territories increased by 52.2% (+3,670 persons). Over the same period, the English-French bilingual population increased by 69.6% in Yukon, 36.7% in Northwest Territories and 50.2% in Nunavut respectively.
- As of 2016, the population who reported having French as their mother tongueNote 3, whether exclusively or along with other languages, stood at 3,820 in number. Collectively, this population represented 3.4% of the Territories’ total population.
- In 15 years, in the Territories, the number of persons who report having French as their mother tongue increased from 2,450 in 2001 to 3,820 in 2016, that is, by 55.9%.
- Over the same period, the population with French as a mother tongue in Yukon grew by 84.3% while that of the Northwest Territories and Nunavut grew by 29.5% and 55.4% respectively.

Data table for Chart 1
| 2001 | 2006 | 2011 | 2016 | |
|---|---|---|---|---|
| number | ||||
| Only French | 510 | 620 | 770 | 925 |
| Mostly French | 485 | 560 | 850 | 900 |
| French spoken equally often with another language | 120 | 140 | 195 | 325 |
| French spoken secondarily (in addition to the main language) | 1,200 | 1,350 | 1,700 | 2,055 |
|
||||
- In 2016, the number of persons who reported speaking French at least regularly at home was 4,205 or 3.7% of the Territories’ total population. In the same year, the number of persons who reported speaking French at least regularly at home in Yukon stood at 1,950 whereas in the Northwest Territories and Nunavut these figures stood at 1,635 and 620 respectively.
- Between 2001 and 2016, the population who reported speaking French at least regularly in the Territories increased by 81.6%, that is, by an additional 1,890 persons. The largest contribution to this growth occurred in Yukon where this population experienced an increase of 125.4%, that is, an additional 1,085 persons.
- Among those who reported speaking French at least regularly at home in 2016, 2,150 persons reported speaking French most oftenNote 4 and 2,055 reported speaking French as a secondary language in addition to the main language. These two populations represented 1.9% and 1.8% of the Territories’ total 2016 population respectively.
- Between 2001 and 2016, the number of persons who reported speaking French most oftenNote 4 at home rose by 92.8% which translates to an additional 1,035 persons. Similarly, those who reported speaking French as a secondary language in addition to the main language at home increased by 71.3% or by an additional 855 persons.
| 2001 | 2006 | 2011 | 2016 | 2001 to 2016 growth |
|||||
|---|---|---|---|---|---|---|---|---|---|
| number | percent | number | percent | number | percent | number | percent | percent | |
| Working populationTable 2 Note 1 | 54,335 | 100.0 | 60,985 | 100.0 | 62,955 | 100.0 | 66,060 | 100.0 | 21.6 |
| French used at workTable 2 Note 2 | 1,475 | 2.7 | 1,860 | 3.0 | 2,230 | 3.5 | 2,610 | 4.0 | 76.9 |
| French used most often at workTable 2 Note 3 | 360 | 0.7 | 515 | 0.8 | 475 | 0.8 | 705 | 1.1 | 95.8 |
| Only French used at workTable 2 Note 4 | 70 | 0.1 | 150 | 0.2 | 90 | 0.1 | 155 | 0.2 | 121.4 |
| Mostly French used at workTable 2 Note 5 | 200 | 0.4 | 285 | 0.5 | 315 | 0.5 | 380 | 0.6 | 90.0 |
| French used equally often with another language at workTable 2 Note 6 |
90 | 0.2 | 80 | 0.1 | 70 | 0.1 | 170 | 0.3 | 88.9 |
| French used regularly at work (in addition to the main language) |
1,115 | 2.1 | 1,345 | 2.2 | 1,755 | 2.8 | 1,905 | 2.9 | 70.9 |
|
|||||||||
- In 2016, there were 2,610 persons who used French at work at least regularly. They represented 4.0% of the working population of the Territories. More specifically, this population stood at 1,190 in Yukon, 920 in the Northwest Territories and 500 persons in Nunavut.
- Between 2001 and 2016, the number of workers who reported using French at work at least regularly increased by 76.9% (+1,135 persons) in the Territories, compared with a 21.6% increase for the working population.
- Among those who reported using French at work at least regularly in the Territories in 2016, 705 workers used French most oftenNote 5 and 1,905 workers used French as a secondary language. Respectively, they accounted for 1.1% and 2.9% of the working population of the Territories.
- In the 2001 to 2016 period, the number of workers who reported using French most oftenNote 5 in the Territories increased by 95.8% (+345 workers) whereas those who reported using French as a secondary language increased by 70.9% (+790 workers).
- In other words, the increase among those who reported using French as a secondary language in addition to the main language at work accounted for 69.6% of the growth in the use of French at work over the 2001 to 2016 period.
Notes
- Date modified: