
Ethnicity, Language and Immigration Thematic Series
The French Language in Nova Scotia, 2001 to 2016: Facts and Figures

Archived Content
Information identified as archived is provided for reference, research or recordkeeping purposes. It is not subject to the Government of Canada Web Standards and has not been altered or updated since it was archived. Please "contact us" to request a format other than those available.
by Alejandro A. Páez Silva and Émilie Lavoie
Skip to text
Text begins
Correction notice
August 8, 2019
Corrections have been made to this product.
Please take note of the following changes:
All data and analysis found in this product are now based on the universe “Population excluding institutional residents”, except when pertaining to language of work. Furthermore, all references to the “official language minority” population have been removed so that the analysis now focuses on language characteristics.
The purpose of this document is to present an overview of the prevailing language trends observed between 2001 and 2016Note in Nova Scotia. To this end, the document provides census-based information on the populationNote who reported having French as their first official language spoken, mother tongue, language spoken at home or language used at work as well as on the population who reported speaking French well enough to conduct a conversation.
Description for Map
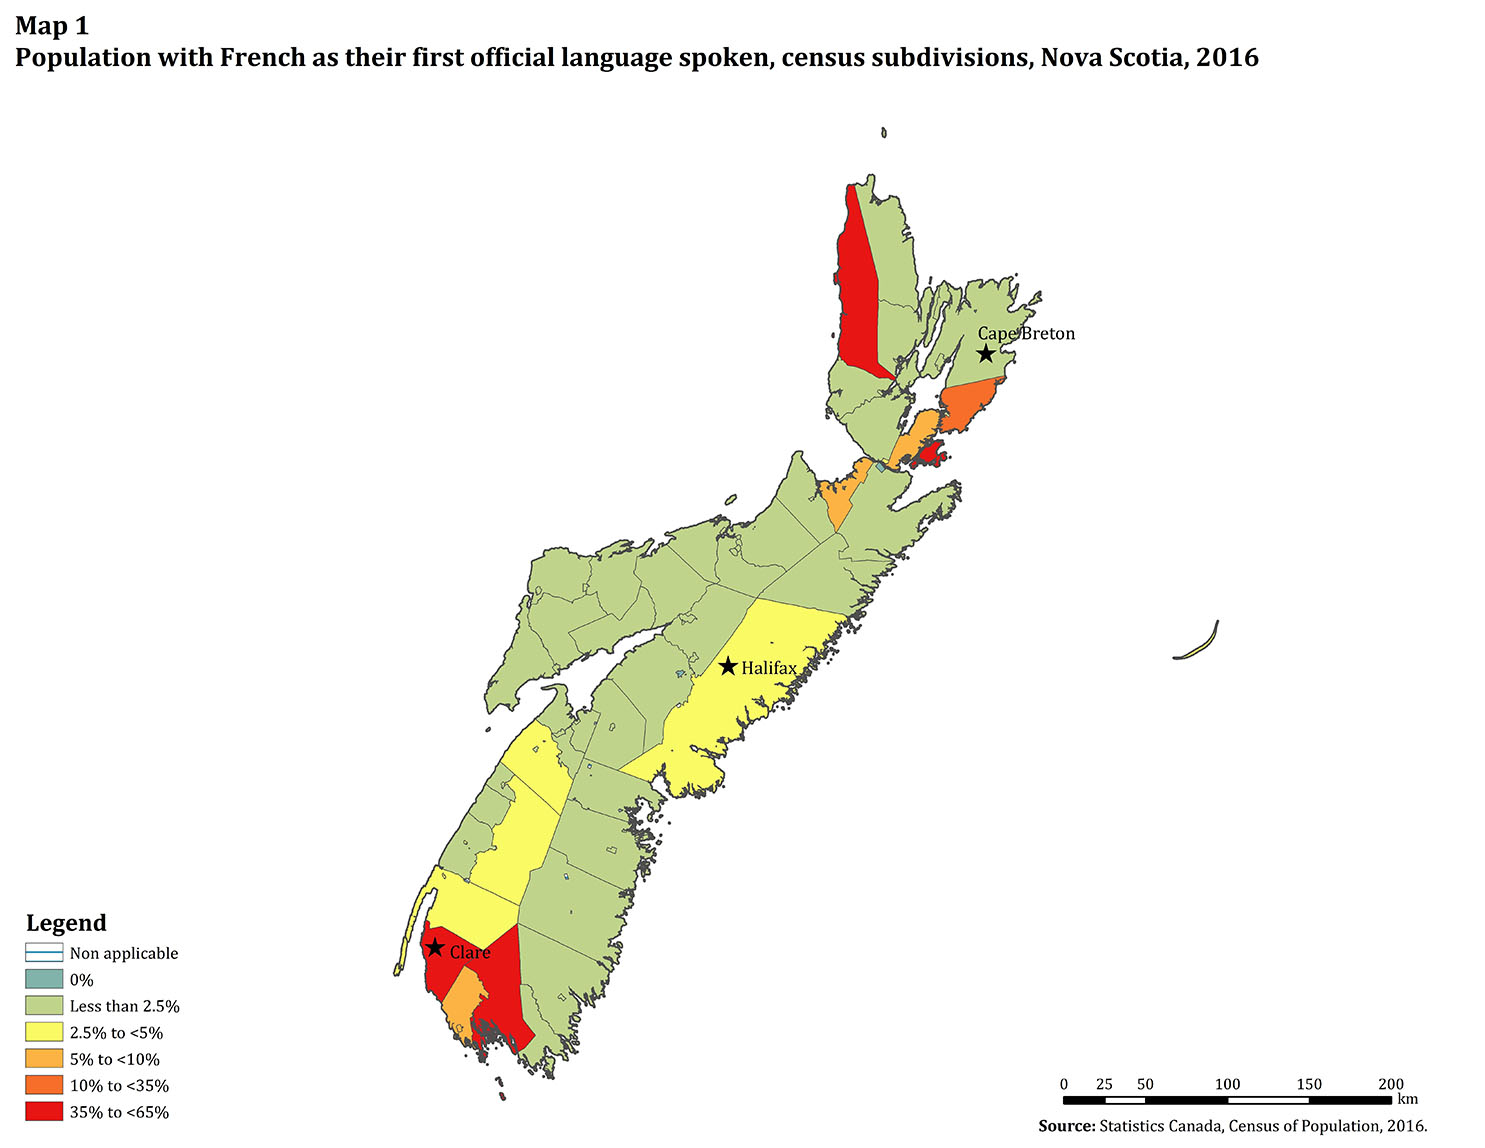
This map shows the proportion of the population with French as their first official language spoken found in each Census Subdivision in Nova Scotia in 2016.
In this map we use seven distinct colours to signify different values. Blue stripes are used to represent areas for which no data are available. There are 11 Census Subdivisions in this group.
A solid teal colour is used to represent areas in which no one with French as their first official language spoken resides. There are 12 Census Subdivisions in this group.
A solid green colour is used to represent areas in which those with French as their first official language spoken constitute less than 2.5% of the total population. There are 57 Census Subdivisions in this group.
A solid yellow colour is used to represent areas in which those with French as their first official language spoken constitute between 2.5% and less than 5.0% of the total population. There are 7 Census Subdivisions in this group.
A solid orange colour was used to represent areas in which those with French as their first official language spoken constitute between 5% and less than 10% of the total population. There are 4 Census Subdivision in this group.
A solid dark orange was used to represent areas in which those with French as their first official language spoken constitute between 10% and less than 35% of the total population. There is 1 Census Subdivision in this group.
A solid red colour was used to represent areas in which those with French as their first official language spoken constitute between 35% and less than 65% of the total population. There are 4 Census Subdivisions in this group.
The borders of each Census Subdivision are delineated by a grey line and each Census Subdivision is assigned a colour based on the table below:
| Census Subdivision | French as First Official Language Spoken - Number | French as First Official Language Spoken - Percent | Total Population |
|---|---|---|---|
| 1203001 | 4,870 | 61.8 | 7,885 |
| 1202001 | 3,385 | 43.1 | 7,855 |
| 1216001 | 1,238 | 39.7 | 3,120 |
| 1215011 | 1,883 | 37.7 | 4,990 |
| 1216011 | 160 | 10.6 | 1,510 |
| 1216006 | 363 | 9.7 | 3,720 |
| 1202004 | 740 | 7.6 | 9,765 |
| 1202006 | 455 | 7.2 | 6,290 |
| 1214006 | 318 | 5.0 | 6,305 |
| 1215002 | 118 | 3.7 | 3,210 |
| 1203004 | 233 | 3.3 | 7,110 |
| 1207001 | 693 | 3.1 | 22,000 |
| 1203006 | 58 | 2.9 | 1,955 |
| 1209034 | 10,500 | 2.6 | 399,315 |
| 1205001 | 78 | 2.6 | 2,990 |
| 1205008 | 13 | 2.6 | 490 |
| 1205014 | 120 | 2.4 | 4,945 |
| 1214002 | 90 | 2.2 | 4,125 |
| 1206006 | 38 | 1.8 | 2,105 |
| 1213004 | 75 | 1.6 | 4,605 |
| 1206008 | 15 | 1.5 | 970 |
| 1207024 | 60 | 1.5 | 3,970 |
| 1207004 | 35 | 1.5 | 2,320 |
| 1216014 | 8 | 1.5 | 505 |
| 1211009 | 75 | 1.4 | 5,230 |
| 1214001 | 118 | 1.4 | 8,275 |
| 1206004 | 118 | 1.4 | 8,325 |
| 1201001 | 93 | 1.4 | 6,580 |
| 1205009 | 58 | 1.3 | 4,275 |
| 1205004 | 78 | 1.3 | 5,805 |
| 1208008 | 298 | 1.3 | 22,440 |
| 1212004 | 40 | 1.3 | 3,025 |
| 1211011 | 120 | 1.3 | 9,195 |
| 1207011 | 105 | 1.3 | 8,085 |
| 1207012 | 78 | 1.3 | 6,090 |
| 1215006 | 58 | 1.2 | 4,815 |
| 1215001 | 38 | 1.2 | 3,155 |
| 1205016 | 20 | 1.1 | 1,765 |
| 1210008 | 218 | 1.1 | 19,370 |
| 1206009 | 110 | 1.1 | 10,170 |
| 1206001 | 265 | 1.1 | 24,750 |
| 1208001 | 160 | 1.0 | 15,345 |
| 1212001 | 63 | 1.0 | 6,070 |
| 1218001 | 40 | 1.0 | 3,915 |
| 1210012 | 35 | 1.0 | 3,460 |
| 1212014 | 88 | 1.0 | 8,775 |
| 1218006 | 25 | 1.0 | 2,545 |
| 1207016 | 115 | 1.0 | 11,830 |
| 1208002 | 33 | 1.0 | 3,355 |
| 1210006 | 115 | 1.0 | 11,900 |
| 1218003 | 5 | 0.9 | 535 |
| 1207021 | 48 | 0.9 | 5,160 |
| 1211002 | 10 | 0.8 | 1,200 |
| 1210001 | 108 | 0.8 | 13,040 |
| 1213001 | 18 | 0.8 | 2,195 |
| 1212009 | 33 | 0.8 | 4,190 |
| 1217030 | 698 | 0.8 | 92,810 |
| 1212011 | 63 | 0.7 | 8,345 |
| 1211014 | 30 | 0.7 | 4,010 |
| 1210002 | 10 | 0.7 | 1,375 |
| 1201008 | 13 | 0.7 | 1,735 |
| 1211006 | 48 | 0.7 | 6,630 |
| 1201006 | 30 | 0.7 | 4,225 |
| 1212006 | 40 | 0.7 | 5,970 |
| 1204010 | 68 | 0.7 | 10,190 |
| 1201004 | 5 | 0.7 | 760 |
| 1212016 | 15 | 0.6 | 2,435 |
| 1210003 | 5 | 0.6 | 860 |
| 1212008 | 20 | 0.6 | 3,615 |
| 1211001 | 10 | 0.5 | 1,900 |
| 1211012 | 5 | 0.4 | 1,145 |
| 1217020 | 13 | 0.4 | 3,420 |
| 1215008 | 3 | 0.3 | 820 |
| 1201009 | 0 | 0.0 | 520 |
| 1202040 | 0 | 0.0 | 155 |
| 1203009 | 0 | 0.0 | 140 |
| 1206011 | 0 | 0.0 | 95 |
| 1207002 | 0 | 0.0 | 140 |
| 1207027 | 0 | 0.0 | 80 |
| 1208014 | 0 | 0.0 | 1,090 |
| 1209019 | 0 | 0.0 | 205 |
| 1212019 | 0 | 0.0 | 485 |
| 1213008 | 0 | 0.0 | 725 |
| 1214010 | 0 | 0.0 | 355 |
| 1217008 | 0 | 0.0 | 1,015 |
| 1204009 | 0 | 0.0 | 0 |
| 1204015 | 0 | 0.0 | 0 |
| 1205002 | 0 | 0.0 | 0 |
| 1205006 | 0 | 0.0 | 0 |
| 1206014 | 0 | 0.0 | 0 |
| 1206016 | 0 | 0.0 | 0 |
| 1209029 | 0 | 0.0 | 0 |
| 1209037 | 0 | 0.0 | 0 |
| 1209038 | 0 | 0.0 | 0 |
| 1209800 | 0 | 0.0 | 0 |
| 1212023 | 0 | 0.0 | 0 |
- In 2016, there were 29,370 persons for whom French was their first official language spoken. Collectively, they represented 3.2% of Nova Scotia’s total population.
- Between 2001 and 2016, the size of this population decreased by 4,400, that is, a 13.0% decrease. In relative terms, this population experienced a decrease of 0.5 percentage points over the same period.
| 2001 | 2006 | 2011 | 2016 | 2001 to 2016 Growth |
|||||
|---|---|---|---|---|---|---|---|---|---|
| number | percent | number | percent | number | percent | number | percent | percent | |
| Total PopulationTable 1 Note 1 | 897,565 | 100.0 | 903,090 | 100.0 | 910,620 | 100.0 | 912,300 | 100.0 | 1.6 |
| French as First Official Language SpokenTable 1 Note 2 | 33,770 | 3.8 | 32,230 | 3.6 | 30,330 | 3.3 | 29,370 | 3.2 | -13.0 |
| Knowledge of FrenchTable 1 Note 3 | 91,055 | 10.1 | 96,015 | 10.6 | 94,315 | 10.4 | 96,085 | 10.5 | 5.5 |
| Knowledge of Only French | 790 | 0.1 | 1,005 | 0.1 | 875 | 0.1 | 705 | 0.1 | -10.8 |
| Knowledge of English and French | 90,265 | 10.1 | 95,010 | 10.5 | 93,440 | 10.3 | 95,380 | 10.5 | 5.7 |
| French as Mother TongueTable 1 Note 3 | 36,745 | 4.1 | 34,925 | 3.9 | 34,585 | 3.8 | 33,350 | 3.7 | -9.2 |
| French Spoken at HomeTable 1 Note 4 | 33,680 | 3.8 | 33,525 | 3.7 | 34,420 | 3.8 | 34,045 | 3.7 | 1.1 |
| French Spoken Most Often at HomeTable 1 Note 5 | 20,625 | 2.3 | 18,580 | 2.1 | 18,060 | 2.0 | 17,025 | 1.9 | -17.5 |
| Only French Spoken at HomeTable 1 Note 6 | 9,920 | 1.1 | 8,760 | 1.0 | 8,710 | 1.0 | 7,540 | 0.8 | -24.0 |
| Mostly French Spoken at HomeTable 1 Note 7 | 9,085 | 1.0 | 8,400 | 0.9 | 7,235 | 0.8 | 6,920 | 0.8 | -23.8 |
| French Spoken Equally Often With Another Language at HomeTable 1 Note 8 |
1,620 | 0.2 | 1,420 | 0.2 | 2,115 | 0.2 | 2,565 | 0.3 | 58.3 |
| French Spoken Regularly at Home (In addition to the main language) |
13,055 | 1.5 | 14,945 | 1.7 | 16,360 | 1.8 | 17,020 | 1.9 | 30.4 |
|
|||||||||
- In Nova Scotia, 96,085 persons reported being able to conduct a conversation in French in 2016, either exclusively or with another language. As a whole, they represented 10.5% of the province’s total population.
- The number of persons able to conduct a conversation in French has increased by 5,030 persons or 5.5% since 2001.
- As of 2016, 95,380 persons reported being able to conduct a conversation in both English and French, a figure which represents a bilingualism rate of 10.5% in Nova Scotia.
- Between 2001 and 2016, English-French bilingualism increased by 5,115 additional persons which represent a 5.7% increase. In relative terms, this change represents an increase of 0.4 percentage points over the same period.
- In 2016, the number of persons who reported having French as their mother tongueNote either exclusively or in combination with other languages, stood at 33,350 which represented 3.7% of the province’s total population that year.
- In the 15 years since 2001, the population with French as their mother tongue decreased by 3,395 fewer persons or a 9.2% decrease.
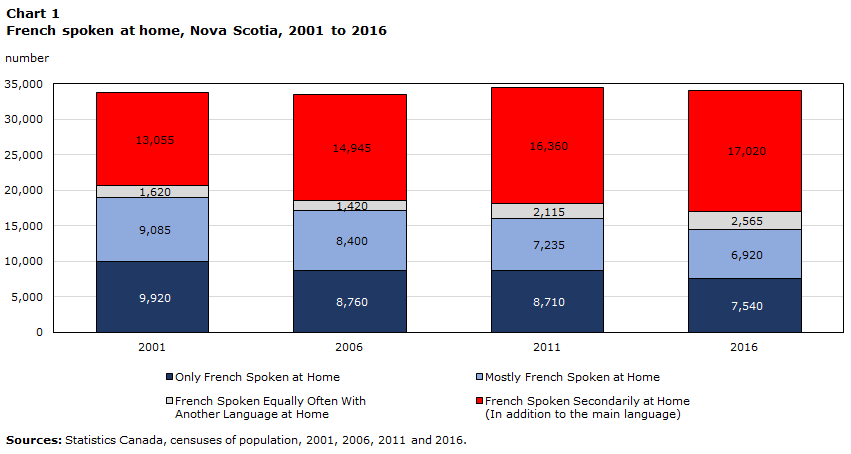
Data table for Chart 1
| 2001 | 2006 | 2011 | 2016 | |
|---|---|---|---|---|
| number | ||||
| Only French Spoken at Home | 9,920 | 8,760 | 8,710 | 7,540 |
| Mostly French Spoken at Home | 9,085 | 8,400 | 7,235 | 6,920 |
| French Spoken Equally Often With Another Language at Home |
1,620 | 1,420 | 2,115 | 2,565 |
| French Spoken Secondarily at Home (In addition to the main language) |
13,055 | 14,945 | 16,360 | 17,020 |
| Sources: Statistics Canada, censuses of population, 2001, 2006, 2011 and 2016. | ||||
- The number of persons who reported speaking French at least regularly at home stood at 34,045 in 2016. Collectively, they represented 3.7% of Nova Scotia’s total population.
- In the 15 years leading to 2016, the number of persons who reported speaking at least French regularly has increased by an additional 365 persons or a 1.1% increase.
- Among those who reported speaking French at least regularly at home in 2016, an identical number of persons reported speaking French most often (17,025 persons) as they did French as a secondary language at home (17,020 persons). Likewise, in relative terms, both represented an equal share of the province’s total population: 1.9%.
- Nevertheless, these populations experienced opposite trends in the 2001 to 2016 period. In fact, the number of persons who reported speaking French most often decreased by 3,600 persons or 17.5% while the number of persons who reported using French as a secondary language at home (in addition to the main language) increased by an additional 3,965 which represents a 30.4% increase.
- Contrary to the decrease observed among those who reported speaking French most often at home, those who reported speaking French equally often with another language increased in size by 58.3% (+945 persons).
| 2001 | 2006 | 2011 | 2016 | 2001 to 2016 Growth |
|||||
|---|---|---|---|---|---|---|---|---|---|
| number | percent | number | percent | number | percent | number | percent | percent | |
| Working PopulationTable 2 Note 1 | 485,595 | 100.0 | 515,660 | 100.0 | 520,820 | 100.0 | 514,075 | 100.0 | 5.9 |
| French Used at WorkTable 2 Note 2 | 22,435 | 4.6 | 23,585 | 4.6 | 21,815 | 4.2 | 22,125 | 4.3 | -1.4 |
| French Used Most Often at WorkTable 2 Note 3 | 9,475 | 2.0 | 9,235 | 1.8 | 8,615 | 1.7 | 8,475 | 1.6 | -10.6 |
| Only French Used at WorkTable 2 Note 4 | 2,320 | 0.5 | 2,005 | 0.4 | 2,260 | 0.4 | 1,945 | 0.4 | -16.2 |
| Mostly French Used at WorkTable 2 Note 5 | 5,030 | 1.0 | 4,985 | 1.0 | 4,405 | 0.8 | 4,190 | 0.8 | -16.7 |
| French Used Equally Often With Another Language at WorkTable 2 Note 6 |
2,125 | 0.4 | 2,245 | 0.4 | 1,950 | 0.4 | 2,340 | 0.5 | 10.1 |
| French Used Regularly at Work (In addition to the main language) |
12,960 | 2.7 | 14,350 | 2.8 | 13,200 | 2.5 | 13,650 | 2.7 | 5.3 |
|
|||||||||
- In 2016, the number of workers who reported using French at least regularly at work stood at 22,125 and represented 4.3% of Nova Scotia’s total working population.
- The use of French at work has decreased by 310 workers, a figure which translates to a 1.4% decrease over the 15 year period beginning in 2001.
- Among those who reported using French at work, in 2016, there were 8,475 workers who reported using French most often and 13,650 who reported using French as a secondary language at work (in addition to the main language). In relative terms, they respectively represented 1.6% and 2.7% of Nova Scotia’s total working population.
- Between 2001 and 2016, those who reported using French most often at work decreased in size by 1,000 workers, that is, by 10.6%. By contrast, those workers who reported speaking French as a secondary language increased in size by 690 additional workers over the same period which translates to a 5.3% increase.
- Contrary to the overall decrease among those who use French most often at work, those who reported using French equally often with another language, in fact, increased by 10.1% or 215 additional workers.
Notes
- Date modified: