

Archived Content
Information identified as archived is provided for reference, research or recordkeeping purposes. It is not subject to the Government of Canada Web Standards and has not been altered or updated since it was archived. Please "contact us" to request a format other than those available.
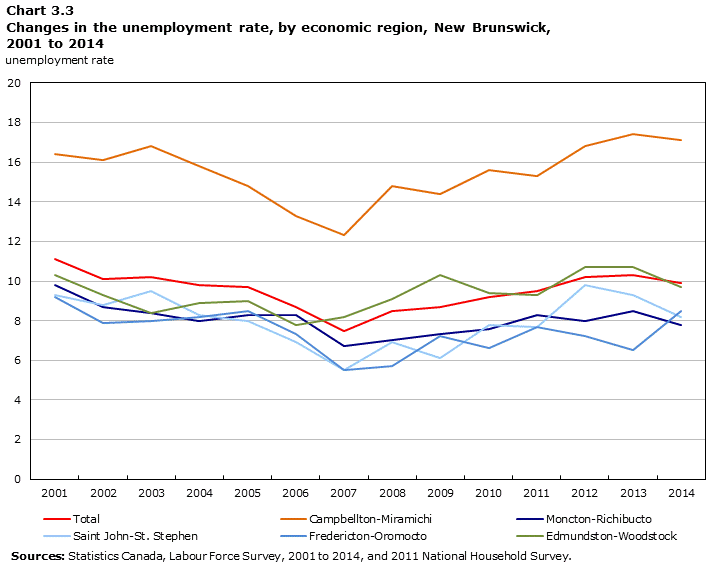
Data table for Chart 3.3
| Year | Total | Campbellton-Miramichi | Moncton-Richibucto | Saint John-St. Stephen | Fredericton-Oromocto | Edmundston-Woodstock |
|---|---|---|---|---|---|---|
| unemployment rate | ||||||
| 2001 | 11.1 | 16.4 | 9.8 | 9.3 | 9.2 | 10.3 |
| 2002 | 10.1 | 16.1 | 8.7 | 8.8 | 7.9 | 9.3 |
| 2003 | 10.2 | 16.8 | 8.4 | 9.5 | 8.0 | 8.4 |
| 2004 | 9.8 | 15.8 | 8.0 | 8.3 | 8.2 | 8.9 |
| 2005 | 9.7 | 14.8 | 8.3 | 8.0 | 8.5 | 9.0 |
| 2006 | 8.7 | 13.3 | 8.3 | 6.9 | 7.3 | 7.8 |
| 2007 | 7.5 | 12.3 | 6.7 | 5.5 | 5.5 | 8.2 |
| 2008 | 8.5 | 14.8 | 7.0 | 6.9 | 5.7 | 9.1 |
| 2009 | 8.7 | 14.4 | 7.3 | 6.1 | 7.2 | 10.3 |
| 2010 | 9.2 | 15.6 | 7.6 | 7.8 | 6.6 | 9.4 |
| 2011 | 9.5 | 15.3 | 8.3 | 7.7 | 7.7 | 9.3 |
| 2012 | 10.2 | 16.8 | 8.0 | 9.8 | 7.2 | 10.7 |
| 2013 | 10.3 | 17.4 | 8.5 | 9.3 | 6.5 | 10.7 |
| 2014 | 9.9 | 17.1 | 7.8 | 8.2 | 8.5 | 9.7 |
| Sources: Statistics Canada, Labour Force Survey, 1994 to 2014, and 2011 National Household Survey. | ||||||
- Date modified: