
Correction Notice
On September 9, 2021, the article Accessibility in Federal Sector Organizations in Canada, 2021 was updated to more accurately reflect the target population of the survey. Terminology was revised from ‘difficulties or long-term conditions’ to ‘persons with disabilities, difficulties or long-term conditions’, except where appropriate to continue with the use of ‘difficulties or long-term conditions’ in situations where disability status could not be determined. Text further clarifying the usage of terminology was also added to the article.
Key Findings:
- Among those who interacted with federal sector organizations in the past two years, 73.0% of Canadians with disabilities, difficulties or long-term conditions encountered an accessibility barrier.
- The proportion of people encountering a barrier varied by type with 62.5% reporting a transportation barrier, 61.5% reporting a communication barrier and 44.6% reporting an information and communication technologies barrier.
- Those with multiple difficulties or long-term conditions were more likely to report all three types of barriers compared to those with one difficulty or long-term condition.
- The most commonly reported transportation barrier was related to wait lines (34.9%), which includes lack of accessible seating, alternative service options, or line queues.
- In the area of communication, Canadians most commonly faced barriers over the phone (43.1%).
- Using self-serve technology (27.2%) was the activity where Canadians experienced the most information and communication technology-related barriers.
Introduction
The importance of creating an accessible and inclusive Canada was recognized with the implementation of the Accessible Canada Act (ACA) in 2019. The ACA looks to address the identification, removal, and prevention of barriers to accessibility within seven priority areas under federal jurisdiction, including employment, the built environment, information and communication technologies (ICT), communication, procurement, service design and delivery and transportation.
According to the 2017 Canadian Survey on Disability (CSD), there are 6.2 million Canadians with disabilities, however, relatively little is known about the accessibility experiences of these individuals. Developing a better understanding of the barriers encountered by persons with disabilities is important in the development of fully accessible communities, workplaces and services. For individuals with difficulties or disabilities, barriers can exist in many forms and in a variety of situations. They can be visible in nature, such as structural features of a building, or less visible aspects like attitudes of service providers, which can result in discrimination or exclusion.
The 2021 Survey on Accessibility in Federal Sector Organizations (SAFSO) asked participants about certain types of barriers and the degree to which they experienced them during their interactions with federally regulated organizations or businesses. Participants in the Survey of Accessibility in Federal Sector Organizations (SAFSO) were identified as having a disability through their participation in the 2017 Canadian Survey on Disability and some SAFSO participants continue to be considered to have a disability in similar manner as they were in 2017. Due to the dynamic nature of disability, some SAFSO participants are considered to have difficulties with daily living or long-term conditions but may not be classified as having a disability in the same manner as they were in 2017. For more information, please refer to the “Data Source and Methodology” section below. The SAFSO focused on the three areas of transportation, communication and information and communication technology (ICT). Under the umbrella of federal jurisdiction are government departments, agencies and crown corporations (e.g. Canada Post), as well as parliamentary entities. In addition, the Canadian Armed Forces and the Royal Canadian Mounted Police fall under federal law. Certain areas of the private sector are also federal responsibility and include:
- Banks
- Radio and television broadcasting
- Telecommunications
- Airlines, rail, road and marine transportation providers that cross provincial or international borders
- Port services, marine shipping, ferries, tunnels, canals, bridges and pipelines (oil and gas) that cross international or provincial borders
- First Nations band councils (including certain community services on reserve)
- Grain elevators, feed and seed mills, feed warehouses and grain-seed cleaning plants
- Uranium mining and processing and atomic energy
Overall Accessibility Barriers
For Canadians, many regular activities involve interacting with a federally regulated business or organization, such as, sending a package, paying a cell phone bill, or using banking services. In fact, the majority (98.2%) of Canadians with a disability, difficulty or long-term conditionNote that limited their daily activities reported interacting with a federal sector organization or business at some point in the past two years. Among those who did, almost three-quarters (73.0%) reported that they encountered at least one type of accessibility barrier.Note Note
The proportion of people reporting barriers within their federal sector interactions was similar across age groups and by genderNote , with some slight variations (Chart 1). Among those aged 65 years and older, significantly more men (77.0%) than women (71.3%) reported at least one accessibility barrier.Note Older men were also more likely than their younger counterparts to report a barrier, with 77.0% of those aged 65 and older encountering a barrier compared to 70.8% of those aged 19 to 44 years. Encountering a barrier also varied by sexual orientationNote , with 78.4% of LGB+Note reporting barriers within their federal sector interactions, compared to 72.4% of heterosexual persons with disabilities, difficulties or long-term conditions.

Data table for Chart 1
| Age group | Men | Women |
|---|---|---|
| percent | ||
| Total (19 years and older) | 73.8 | 72.0 |
| 19 to 44 years | 70.5 | 72.5 |
| 45 to 64 years | 72.3 | 72.7 |
| 65 years and older | 77.0 | 71.3 |
| Source: Statistics Canada, Survey on Accessibility in Federal Sector Organizations, 2021. | ||
Analysis by type of difficulty was conducted using the short set of questions asking about difficulties or long-term conditions that was included in the survey, as it is the most up-to-date information available for survey participants. As these questions are not a comprehensive instrument to determine disability, results are reported for difficulties or long-term conditions, and not by disability type.
When examined by type of difficultyNote , the proportion reporting an accessibility barrier was 87.2% for those with hearing difficulties, 80.9% among those with seeing difficulties, 80.6% for those with a cognitive difficulty, 77.6% for those with a mental health-related difficulty, 76.5% among those with physical difficulties and 76.4% among those who indicated they had some other type of health problem or long-term condition. Those who reported multiple difficulties or long-term conditions were more likely to report facing a barrier in their federal sector interactions (77.1%) than those with one difficulty or long-term condition (52.7%).
There were also certain regional differences, as Canadians living in the Atlantic provinces were less likely to report barriers (69.2%) when compared to Ontario (73.2%), the Prairie provinces (73.5%) and British Columbia (75.3%). Accessibility barriers varied by incomeNote , as those reporting a household income less than $40,000 were more likely to report encountering barriers within their federal sector interactions (76.0%) compared to those reporting a household income of $80,000 or more (68.1%).
Among Indigenous peopleNote with disabilities, difficulties or long-term conditions, 78.6% reported an accessibility barrier within their federal sector interactions, which was similar to the non-Indigenous population. There was some variation by Indigenous group, as 87.1% of Métis and 66.8% of First Nations people living off reserveNote reported a barrier.Note
Among those with disabilities, difficulties or long-term conditions who belonged to a group designated as a visible minorityNote , 75.4% reported a barrier, which was similar to their non-visible minority counterparts (72.6%). When examined by ethnocultural group, South Asian Canadians (66.3%) were less likely than Chinese (82.0%)Note and Filipino Canadians (88.2%)Note to report a barrier.
Transportation Barriers
The goal of the ACA when it comes to transportation, is to have a barrier-free federal transportation network, which includes airplanes, passenger trains, ferry services, and buses that travel between municipalities, provinces or territories. The COVID-19 pandemic has greatly reduced the amount of international and domestic travelNote , therefore the reference period was expanded to the past two years in an attempt to better capture typical travel experiences. Among the 2.2 million of those with disabilities, difficulties or long-term conditions who travelled in the past two years, 62.5% faced a barrier while using one of these modes of transportation.
Age and gender were factors in the likelihood of encountering transportation accessibility barriers. Overall, those aged 65 years and older (73.9%) were more likely to report a transportation barrier compared with those aged 45 to 64 years (61.6%) and those aged 19 to 44 years (51.9%). Among those aged 19 to 44 years, men (45.5%) were less likely than women (55.2%) to report this type of barrier. Among men, the proportion encountering a transportation barrier increased with age while for women there were no statistical differences between those aged 19 to 44 years and those aged 45 to 64 years.
Looking across the types of difficulties, the proportion reporting a transportation barrier was 78.4% for those with hearing difficulties, 74.4% among those with physical difficulties, 71.6% among those with seeing difficulties, 68.0% for those with a cognitive difficulty, 60.9% for those with a mental health-related difficulty, and 69.9% among those who indicated they had some other type of health problem or long-term condition. Those who reported multiple difficulties or long-term conditions were more likely to report facing a transportation barrier (67.7%) than those with one difficulty or long-term condition (44.4%).
When examined by type of barrier (Chart 2), barriers related to wait lines (34.9%), which includes lack of accessible seating, alternative service options or line queues, were experienced the most often by Canadians with disabilities, difficulties or long-term conditions. The other most common barriers reported were related to using websites to make reservations or look for information (30.0%) and lighting or sound levels (29.7%). Whereas challenges with the level of service or availability of accommodations (20.3%) and barriers related to washrooms in terminals or on transportation vehicles (21.1%) were the least commonly reported.

Data table for Chart 2
| Type of barrier | Experienced a barrier | Did not experience a barrier | Not applicable |
|---|---|---|---|
| percent | |||
| Using website | 30.0 | 39.2 | 30.2 |
| Level of service or accommodations | 20.3 | 49.3 | 29.6 |
| Signs or directions | 24.7 | 48.0 | 26.1 |
| Announcements or alarms | 25.4 | 46.9 | 26.6 |
| Wait lines | 34.9 | 41.7 | 22.5 |
| Washrooms | 21.1 | 50.4 | 27.4 |
| Lighting or sound levels | 29.7 | 43.0 | 26.4 |
| Floorplans or fixtures inside buildings | 25.1 | 45.4 | 28.9 |
| Entrances or exits | 26.0 | 44.5 | 29.2 |
|
Notes: The sum of the percentages for each type may not equal 100% due to non-response and rounding. The category "experienced a barrier" includes those who indicated they encountered the barrier "rarely", "sometimes", "often", or "always". Source: Statistics Canada, Survey on Accessibility in Federal Sector Organizations, 2021. |
|||
Looking further at barriers related to wait lines, among those who encountered this type of barrier, 30.7% said the frequency was “often” or “always”, while 69.3% indicated it was “rarely” or “sometimes”. Those with multiple long-term conditions (38.4%) were more likely to report this type of barrier compared to those with one difficulty or long-term condition (22.2%).
Information and Communication Technology Barriers
Within the area of information and communication technologies (ICT), the goal of the ACA is to ensure that all digital content and technologies are accessible. This includes computers, the Internet, websites and broadcasting technologies, such as radio, television or podcasting. Standards exist to help ensure that tools and web content are perceivable, understandable and operational.Note Among Canadians with disabilities, difficulties or long-term conditions who interacted with a federal organization or business in the past two years, 44.6% reported a barrier related to ICT.
Similar to transportation, older Canadians were once again more likely to report barriers with ICT than their younger counterparts, as 47.1% of those aged 65 years and older reported barriers compared to 39.9% of those aged 19 to 44 years. Across age groups, there were no statistically significant differences between men and women. Among men, those aged 65 years and older were more likely to report an ICT barrier (50.0%) than those aged 19 to 44 years (38.3%). Whereas among women, there were no differences between age groups.
When examined by type of difficulty, the proportion reporting an information and communication technology barrier (ICT) was 59.3% for those with hearing difficulties, 56.0% among those with seeing difficulties, 51.9% for those with a cognitive difficulty, 49.8% for those with a mental health-related difficulty, 49.1% among those with physical difficulties and 49.7% among those who indicated they had some other type of health problem or long-term condition.
Other factors in the likelihood of encountering an ICT barrier were income and the number of difficulties or long-term conditions a person had. The likelihood of experiencing a technology-related barrier decreased as income increased. Canadians living in households with an income less than $40,000 (51.7%) were more likely to report this type of barrier compared to those in households with an income of $40,000 to less than $80,000 (44.2%) and those with an income over $80,000 (38.6%). Those with multiple difficulties (48.4%) were more likely to report ICT barriers compared to those with one difficulty or long-term condition (27.0%).
There were no statistically significant differences between the Indigenous population (41.7%) and the non-Indigenous population (44.8%) with disabilities, difficulties or long-term conditions in terms of the likelihood of reporting an ICT barrier. Those belonging to groups designated as visible minorities (52.4%) were more likely to report this type of barrier compared to their non-visible minority counterparts (43.4%).
The types of potential challenges faced in this area can range from a lack of Internet access to complex layout or navigation of a website, or videos that do not have captions, audio description tracks or text transcripts. The SAFSO asked about information and communication technology barrier experiences while doing certain activities. The most common barrier reported was with using in-person self-serve technology (27.2%), such as ATMs or self-checkout in retail environments (Chart 3). Among those who faced this type of barrier, 25.6% indicated their frequency of encountering it was “often” or “always”, compared to 74.4% who said it occurred “rarely” or “sometimes”. Women (28.8%) were more likely to report encountering barriers with self-serve technology “often” or “always” compared to men (22.1%).
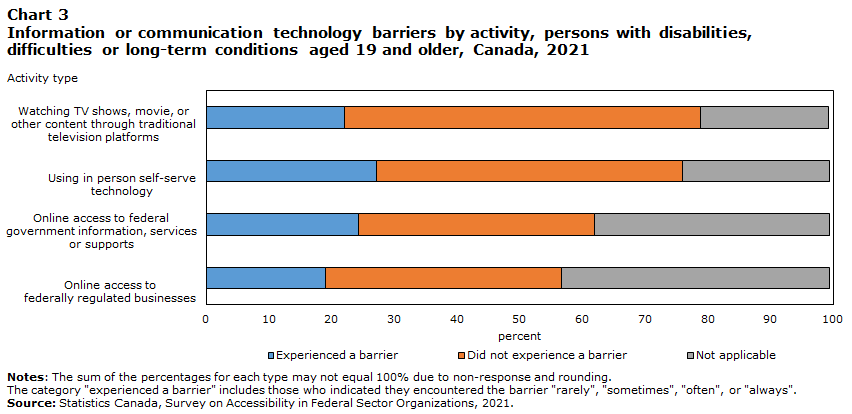
Data table for Chart 3
| Type of activity | Experienced a barrier | Did not experience a barrier | Not applicable |
|---|---|---|---|
| percent | |||
| Watching TV shows, movie, or other content through traditional television platforms | 22.0 | 56.8 | 20.5 |
| Using in person self-serve technology | 27.2 | 48.8 | 23.4 |
| Online access to federal government information, services or supports | 24.3 | 37.6 | 37.6 |
| Online access to federally regulated businesses | 19.1 | 37.5 | 42.9 |
|
Notes: The sum of the percentages for each type of activity may not equal 100% due to non-response and rounding. The category "experienced a barrier" includes those who indicated they encountered the barrier "rarely", "sometimes", "often", or "always". Source: Statistics Canada, Survey on Accessibility in Federal Sector Organizations, 2021. |
|||
The second most commonly reported barriers were related to online access to federal government information, services or supports (24.3%). This could include such online activities as applying for Employment Insurance or Disability Benefits, completing a passport application, or filing tax forms. This was followed by 22.0% experiencing barriers when watching TV shows, movies, or other content through traditional television platforms and 19.1% facing barriers when accessing websites of federally regulated businesses.
Communication Barriers
The ACA priority area of communication includes both understanding and being understood by others. Accessibility in this area can include providing alternative formats of materials, using plain language, or availability of sign language interpreters. When interacting with federally regulated organizations or businesses, 61.5% of those with disabilities, difficulties or long-term conditions experienced a communication-related barrier.
The proportion of people experiencing a communication barrier was similar across age groups and by gender. The only difference was among those aged 65 years and older, where men (66.5%) were more likely than women to report a barrier (60.1%). The likelihood of experiencing a communication barrier did vary by sexual orientation, as 68.2% of LGB+ reported this type of barrier compared to 60.9% of heterosexual people.
The breakdown by difficulty type was 80.3% for those with hearing difficulties, 72.7% for those with a cognitive difficulty, 70.8% among those with seeing difficulties, 69.0% for those with a mental health-related difficulty, 64.5% among those with physical difficulties and 65.0% among those who indicated they had some other type of health problem or long-term condition. Those with multiple difficulties or long-term conditions (66.6%) were more likely to report a communication barrier compared to those with only one difficulty or long-term condition (37.9%). Among those with multiple difficulties or long-term conditions, men (68.8%) were once again more likely to report a communication barrier compared to women (64.9%).
Overall there were no statistical differences between the Indigenous population (68.0%) and non-Indigenous population (61.3%) in reporting communication barriers. There were some variations when examined by Indigenous group, as 75.2% of Métis reported this type of barrier while 57.7% of First Nations people living off reserveNote did the same. Similar proportions of the visible minority (61.1%) and non-visible minority (61.6%) population with disabilities, difficulties or long-term conditions encountered a communication-related barrier.
The proportion of Canadians encountering a communication barrier varied by the type of situation (Chart 4). The proportion reporting barriers communicating by phoneNote (43.1%), in person (40.5%), and in reading and understanding written materials (40.2%) were similar. In contrast, challenges using video conferencing (26.4%) and while using social media or online chat forums (23.5%) were less commonly reported. Communication barriers by phone were almost twice as likely to be reported by those with multiple difficulties or long-term conditions (47.1%) than by those with one difficulty or long-term condition (24.7%).
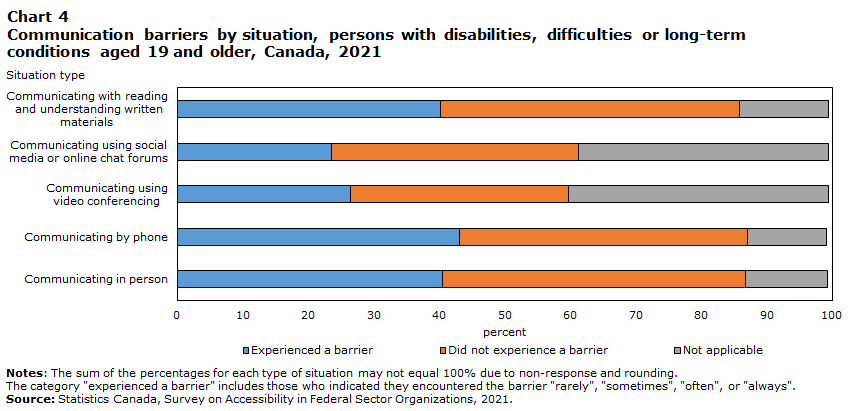
Data table for Chart 4
| Type of situation | Experienced a barrier | Did not experience a barrier | Not applicable |
|---|---|---|---|
| percent | |||
| Communicating with reading and understanding written materials |
40.5 | 45.6 | 13.6 |
| Communicating using social media or online chat forums | 23.5 | 37.8 | 38.2 |
| Communicating using video conferencing | 26.4 | 33.3 | 39.8 |
| Communicating by phone | 43.1 | 44.0 | 12.0 |
| Communicating in person | 40.2 | 46.3 | 12.5 |
|
Notes: The sum of the percentages for each type may not equal 100% due to non-response and rounding. The category "experienced a barrier" includes those who indicated they encountered the barrier "rarely", "sometimes", "often", or "always". Source: Statistics Canada, Survey on Accessibility in Federal Sector Organizations, 2021. |
|||
The frequency of encountering barriers was similar across four of the five modes – by phone, in person, with written materials, and using social media. The proportion of people who indicated a frequency of “often” or “always” in each of the four situations was around 25%, compared to about 75% saying it occurred “sometimes” or “rarely”. Whereas for video conferencing, 31.8% reported the frequency as “often” or “always” compared to 68.2% who reported the occurrence as “sometimes” or “rarely”.
Conclusion
Creating a barrier-free and inclusive Canada requires the identification and understanding of the barrier experiences of persons with disabilities. The findings from the Survey on Accessibility in Federal Sector Organizations (SAFSO) show that 73.0% of Canadians with disabilities, difficulties or long-term conditions encountered at least one type of barrier in the past two years while interacting with federal sector organizations. The proportion reporting barriers varied by area, with about two-thirds of Canadians reporting barriers with transportation (62.5%) and with communication (61.5%), and 44.6% reporting at least one barrier with information and communication technologies. The likelihood of encountering barriers was influenced by a variety of factors, including age group, gender, geography, income, sexual orientation, Indigenous identity, visible minority group, and having multiple difficulties or long-term conditions. Future work consists of a more detailed look at intersectionality and further disaggregated analysis to better understand the experiences of different population groups.
Data Source and Methodology
The 2021 Survey on Accessibility in Federal Sector Organizations was conducted as part of the Rapid Stats program offered by Statistics Canada's Centre for Social Data Integration and Development to rapidly respond to pressing data needs. The target population of this survey was persons with a disability living in one of the 10 Canadian provinces who were 15 years of age or older as of May 10, 2016. The survey sampling frame consisted of participants of the 2017 Canadian Survey on Disability (CSD). The CSD uses the Disability Screening Questionnaire (DSQ) to identify persons with disabilities. As participants’ disability status could have changed since 2017 and the DSQ would be too burdensome to re-administer, the current survey uses the activities of daily living questions to confirm that they currently have difficulties in one or more areas. Due to the dynamic nature of disability, some participants in this survey continue to be considered to have a disability in similar manner as they were in 2017 while other participants in this survey are considered to have difficulties with daily living but may not be classified as having a disability in the same manner as they were in 2017.
Respondents’ answers were linked to their 2017 CSD data in order to reduce response burden and increase the analytical opportunities. This includes linked Census data as well, which represents information captured in May 2016. It is important for users to keep in mind the different reference periods involved for each data source.
- Date modified: