
Canadian Survey on Disability Reports
The evolution of disability data in Canada: Keeping in step with a more inclusive Canada

Archived Content
Information identified as archived is provided for reference, research or recordkeeping purposes. It is not subject to the Government of Canada Web Standards and has not been altered or updated since it was archived. Please "contact us" to request a format other than those available.
by Adele Furrie
Identifying the number of Canadians with disabilities, and collecting information on what prevents or impedes their full participation in Canadian society, has evolved significantly over the years. The purpose of this note is to provide an overview of this evolution and its impact on the comparability of results from Canadian disability surveys.
Background
The issues facing Canadians with disabilities and the barriers that they face were first documented in 1981 with the tabling in Parliament of Obstacles – the report of the Special Parliamentary Committee on the Disabled and the Handicapped. The need to have data to quantify the nature and extent of the barriers was one of the 130 recommendations contained in the report — a call to develop a long-term, national data collection strategy on persons with disabilities.
In 1998, the In Unison report provided both the vision and the guiding framework for moving towards an inclusive Canada through the elimination of barriers that prevent or impede their full participation in society. The need for data was reaffirmed with Canada’s ratification of the United Nations Convention on the Rights of Persons with Disabilities (UNCRPD) – Article 31 in 2010 which reinforced the commitment to an inclusive Canada.
The evolution of the concept of disability
The concept of disability has evolved over the past three decades, moving from a more medical model to a social one. Initial concepts focused more on physical and sensory impairments as well as the health conditions of an individual. Conversely, the social model of disability has evolved to also include cognitive and mental health-related impairments, in addition to the barriers which may prevent or limit one’s full participation in society. It acknowledges that barriers posed by the environment also need to be addressed in order to give everyone an equal chance of participating more fully in society. This approach is in line with UNCRPD.
As a result, questions to identify the population with disabilities also had to evolve, which posed certain challenges in establishing trend data. Since 1983, Statistics Canada, with the support of Employment and Social Development Canada (ESDC), has conducted seven surveys focussed on persons with disabilities: the 1983/84 Canadian Health and Disability Survey (a supplement of the monthly Labour Force Survey), the 1986 and 1991 Health and Activity Limitation Surveys (HALS), the 2001 and 2006 Participation and Activity Limitation Surveys (PALS), and the 2012 and 2017 Canadian Surveys on Disability (CSD).
Identifying persons with a disability
Beginning with the 1986 HALS, Statistics Canada developed, and has used, a two-step approach to conduct disability surveys. Step 1 uses a set of questions (called filter questions) that are included on the census to identify persons most likely to have a disability. A sample of persons who responded positively to these filter questions is then selected. Step 2 used a longer set of questions (referred to as the screening questions) to identify the population with disabilities, the type of disability and the severity of the disability. Both the filter questions and the screening questions used in Statistics Canada surveys have evolved and progressed since 1986 to remain in-step with the evolution of the concept of disability.
The inclusion of the filter questions on the 2016 Census of Population was the culmination of the federal government’s new Persons with Disabilities Data and Information Strategy that began in 2010.
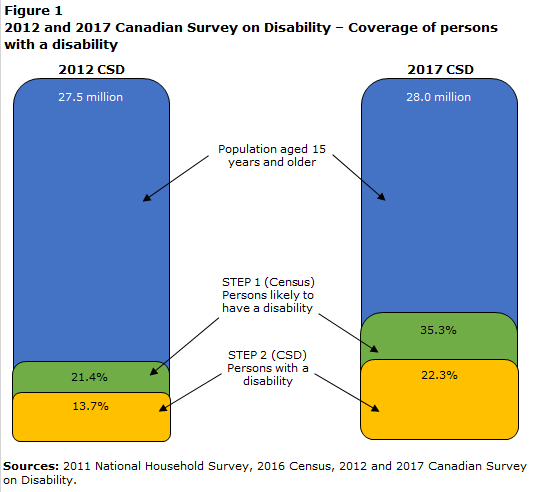
Data table for Figure 1
| 2012 CSD | 2017 CSD | |
|---|---|---|
| million | ||
| Population aged 15 years and older | 27.5 | 28 |
| percent | ||
| Step 1 (Census) Persons likely to have a disability | 21.4 | 35.3 |
| Step 2 (CSD) Persons with a disability | 13.7 | 22.3 |
| Sources: 2011 National Household Survey, 2016 Census, 2012 and 2017 Canadian Survey on Disability. | ||
When the 2012 CSD took place, the filter questions used to identify persons most likely to have a disability on the census (Step 1) were not as inclusive of persons with cognitive and mental health-related disabilities.
With the inclusion of the latest filter questions on the 2016 Census of Population, the methodology of the 2017 CSD benefited from the latest versions of both the filter and screening questions.
The results of the 2017 CSD are, therefore, more inclusive of all persons with disabilities and more reflective of today’s Canada. With this more inclusive CSD, a comparison of trends over time is limitedNote 1 but we can look forward by adopting the 2017 data as a benchmark against which to measure future progress.
Note
- Date modified: