
Canadian Survey on Disability, 2012
A Profile of the Labour Market Experiences of Adults with Disabilities among Canadians aged 15 years and older, 2012

Archived Content
Information identified as archived is provided for reference, research or recordkeeping purposes. It is not subject to the Government of Canada Web Standards and has not been altered or updated since it was archived. Please "contact us" to request a format other than those available.
by Matthew Till, Tim Leonard, Sebastian Yeung & Gradon Nicholls
Acknowledgments
It is important to acknowledge the contributions of the following people to the profile of the labour market experiences of adults with disabilities. The authors are thankful for the assistance and support by reviewing the preliminary versions of this report, or by helping to prepare the data.
Employment and Social Development Canada: Sabrina Gilbert, John Rietschlin, Patrick Bussière, Gail Fawcett and Manon Monette.
Members of the Technical Advisory Group: Michael Bach, Laurie Beachell, Gary Birch, Cam Crawford, Adele Furrie, Monique Gignac, Elizabeth Lin, Michael Prince, Katherine Scott, Marie White, and Doug Willms.
Statistics Canada: Rubab Arim, Pamela Best, Christine Bizier, Mike Burns, Joan Conway, Johanne Denis, Félix Fortin, Dominic Grenier, Chantal Grondin, Lecily Hunter, Simon Landry, Brian McIntosh, François Nault and Martin Turcotte.
1.0 Introduction
This report examines the labour market experiences of people with disabilities, using data from the 2012 Canadian Survey on Disability (CSD). Compared with people without disabilities, those with disabilities have lower employment rates, lower levels of compensation, and weaker levels of job tenure (Government of Canada, 2010). Although a comparison of employment characteristics of people with and without disabilities based on the 2012 CSD has been published (Turcotte, 2014), the CSD data offer opportunities for further analysis of disability-specific aspects of employment. Specifically, the CSD provides information about employment barriers encountered by people with disabilities, the types of workplace accommodations needed, and whether those needs are being met, perceptions of disability-based discrimination in the work environment, and labour force discouragement among those who are not in the labour force. This report aims to provide insight to employers, and to spark further research in the area of disability and employment.
Start of text box
Most statistics in this analysis are based on respondent self-identification and provide invaluable information from people with disabilities themselves. However, these findings represent only a piece of the complete picture. They should be interpreted together with other sources such as employers’ perspectives and data from program/administrative sources.
End of text box
Several key results emerge from the analysis:
- Many working-age people with disabilities have, at least intermittently, dropped out of the labour force.
- In addition to people with disabilities who are currently working, an estimated 411,600 are not employed but have the potential to work. Almost half of these potential workers are postsecondary graduates.
- Modified work hours are key:
- Among employed people with disabilities, modified work hours are the most commonly stated workplace accommodation—an accommodation that has generally been met by employers.
- Among potential workers with disabilities, modified work hours would be needed to an even greater degree;
- Modified or reduced hours were also the most common reason cited by employed people with disabilities for difficulty advancing in or changing jobs.
- People with disabilities who were not in the labour force reported inadequate training or experience to be one of the main barriers in searching for a job; many potential workers with disabilities wanted to take work-related training to increase their employability.
This report is divided into four sections. In Section 2, findings related to the high percentage of people with disabilities out of the labour force are provided, and the relationship with unemployment is discussed. Section 3 provides a framework for identifying working-age people with disabilities who are not working, but have the potential to work, and profiles this population. Section 4 discusses barriers that people with disabilities have experienced, with a focus on workplace accommodations, training, employment experience, labour force discouragement, and disability-based discrimination. Section 5 presents concluding remarks.
2.0 Employment, Unemployment and Labour Force Non-Participation
Adults with disabilities have lower levels of employment
In 2012, an estimated 2,338,200Note 1 Canadians aged 15 to 64 had a disability; they represented 10.1% of the population in this age group. Approximately 1,057,100 people with disabilities were employed, 125,700 were unemployed, and 1,155,500 were not in the labour force. Working-age people with disabilities had much lower employment rates than people without disabilities (Turcotte, 2014).
Start of text box
The Canadian Survey on Disability (CSD) was conducted in 2012 based on filtering questions in the 2011 National Household Survey (NHS). Both surveys collected employment data for people with disabilities, but only the NHS gathered employment data for individuals without disabilities. In the portions of Section 2 that present employment data for people without disabilities, labour force status as observed at the time of the NHS is used. All other labour force statistics pertain to the time of the CSD. Owing to the one-year gap between the two surveys, these numbers will differ.
End of text box
Several factors affect the relationship between disability and employment.
- People with disabilities with higher levels of education were much more likely to be employed than those with less education. The employment gap between those with and without disabilities was smaller for university degree-holders.
- Severity of disabilityNote 2 is key—people with more severe disabilities had significantly lower levels of employment than those with less severe disabilities (Turcotte, 2014).
- External factors, such as regional economic cycles, have a greater effect on the labour market participation of people with disabilities. Employment patterns differ across the country (Yelin & Katz, 1994).
Employment rates differed depending on the type of disability. People with developmental, cognitive and mental health-related disabilities face greater employment challenges than people with sensory or physical disabilities. However, untangling this relationship is difficult because of the high co-occurrence of disability types (Arim, 2015). Age of onset of disability has an impact on employment status, although again, the relationship is complex (Loprest & Maag, 2007).
Start of text box
Statistics Canada (2014) defines unemployed persons as “those who, during the reference week:
- were on temporary layoff with an expectation of recall and were available for work; or
- were without work, had looked for work in the past four weeks, and were available for work; or
- had a new job to start within four weeks, and were available for work.”
End of text box
To calculate the employment rate, people who are not working but are actively seeking employment are grouped with those who are not actively seeking employment. By contrast, the unemployment rate is the ratio of those actively seeking employment (the “unemployed”) to those who are in the labour force (either employed or actively seeking employment).
This definition of unemployment may not capture individuals who are not consistently looking for work (Akyeampong, 1989), but would take a job if the opportunity arose. Further, while labour force discouragement is experienced by people with and without disabilities, those with disabilities can experience additional barriers (Fawcett, 1996).
A potential measure of this effect is the percentage of people not employed who are “unemployed”; in other words, the percentage of those not employed who are actively seeking work.
Among people without disabilities who were not employed, 21.5% were actively seeking work; for people with disabilities, the percentage was 12.0%. Levels of active employment search declined as disability severity rose: 18.6% for those with mild disabilities, 12.1% for moderate, and 9.6% for severe or very severe disabilities.
However, other reasons could account for the lower levels of labour force participation among people with disabilities. For example, the disability may completely prevent the person from working, or people with disabilities may be more likely to be retired, given that the likelihood of having a disability rises with age.
Start of text box
Side Box 1: Work experience of students with disabilities
Awareness is increasing about the importance of obtaining employment experience during the course of formal education, and the impact it can have on successful school-to-work transitions (Organisation for Economic Co-Operation and Development (OECD), 2013a, b). Such experience can come through internships, co-op placements, work-study programs, and apprenticeships.
Chart 1 presents the education and employment status of youth with disabilities (left) versus youth without disabilities (right) disaggregated by four categories:
- Students who are not working
- Students who are working
- Non-students who are working
- Those neither in employment, enrolled in education or training (NEET)
Chart 1 shows the relatively low prevalence of working students with disabilities compared to working students without disabilities. More than half (53.9%) of students without disabilities between the ages of 18 to 23 were working, compared with about a third (36.4%) of those with disabilities.
Less labour market experience at graduation presents an additional challenge for youth with disabilities in making the school-to-work transition. This, in turn, may be a factor in the high levels of NEET status among 24- to 35-year-olds with disabilities, which hovered around 40.0% (versus 10.0% to 12.0% for young adults without disabilities).

Description for Chart 1
Chart 1a Employment and education status for young adults, aged 15 to 34 years, Canada, 2012Note 1 (People with disabilities)
The title of the graph is "Chart 1a Employment and education status for young adults, aged 15 to 34 years, Canada, 2012Note 1 (People with disabilities)."
This is a line chart.
There are in total 20 categories in the horizontal axis. The vertical axis starts at 0 and ends at 100 with ticks every 10 points.
There are 4 series in this graph.
The vertical axis is "percent."
The horizontal axis is "Age."
The title of series 1 is "In school and not employed."
The minimum value is 3.33 and it corresponds to "34."
The maximum value is 75.25 and it corresponds to "15."
The title of series 2 is "In school and employed."
The minimum value is 6.99 and it corresponds to "34."
The maximum value is 16.02 and it corresponds to "19."
The title of series 3 is "Not in school and employed."
The minimum value is 3.82 and it corresponds to "15."
The maximum value is 48.89 and it corresponds to "34."
The title of series 4 is "Not in school and not employed (NEET)."
The minimum value is 7.32 and it corresponds to "15."
The maximum value is 41.22 and it corresponds to "31."
| In school and not employed | In school and employed | Not in school and employed | Not in school and not employed (NEET) | |
|---|---|---|---|---|
| 15 | 75.25 | 13.61 | 3.82 | 7.32 |
| 16 | 69.96 | 14.56 | 5.48 | 10.00 |
| 17 | 63.90 | 15.32 | 7.60 | 13.18 |
| 18 | 57.25 | 15.82 | 10.16 | 16.77 |
| 19 | 50.29 | 16.02 | 13.11 | 20.58 |
| 20 | 43.35 | 15.93 | 16.33 | 24.39 |
| 21 | 36.75 | 15.56 | 19.70 | 28.00 |
| 22 | 30.72 | 14.97 | 23.08 | 31.22 |
| 23 | 25.42 | 14.24 | 26.36 | 33.97 |
| 24 | 20.89 | 13.43 | 29.47 | 36.21 |
| 25 | 17.10 | 12.59 | 32.36 | 37.95 |
| 26 | 13.99 | 11.76 | 35.01 | 39.23 |
| 27 | 11.47 | 10.98 | 37.42 | 40.14 |
| 28 | 9.43 | 10.24 | 39.60 | 40.72 |
| 29 | 7.79 | 9.56 | 41.58 | 41.06 |
| 30 | 6.48 | 8.95 | 43.36 | 41.21 |
| 31 | 5.42 | 8.39 | 44.97 | 41.22 |
| 32 | 4.57 | 7.88 | 46.42 | 41.13 |
| 33 | 3.88 | 7.41 | 47.73 | 40.97 |
| 34 | 3.33 | 6.99 | 48.89 | 40.79 |
|
||||
Chart 1b Employment and education status for young adults, aged 15 to 34 years, Canada, 2012Note 1 (People without disabilities)
The title of the graph is "Chart 1b Employment and education status for young adults, aged 15 to 34 years, Canada, 2012Note 1 (People without disabilities)."
This is a line chart.
There are in total 20 categories in the horizontal axis. The vertical axis starts at 0 and ends at 100 with ticks every 10 points.
There are 4 series in this graph.
The vertical axis is "Percent."
The horizontal axis is "Age."
The title of series 1 is "In school and not employed."
The minimum value is 2.28 and it corresponds to "34."
The maximum value is 70.27 and it corresponds to "15."
The title of series 2 is "In school and employed."
The minimum value is 9.69 and it corresponds to "34."
The maximum value is 31.17 and it corresponds to "20."
The title of series 3 is "Not in school and employed."
The minimum value is 3.83 and it corresponds to "15."
The maximum value is 77.21 and it corresponds to "34."
The title of series 4 is "Not in school and not employed (NEET)."
The minimum value is 3.83 and it corresponds to "15."
The maximum value is 13.16 and it corresponds to "25."
| In school and not employed | In school and employed | Not in school and employed | Not in school and not employed (NEET) | |
|---|---|---|---|---|
| 15 | 70.27 | 22.07 | 3.83 | 3.83 |
| 16 | 63.70 | 25.19 | 6.03 | 5.08 |
| 17 | 56.61 | 27.86 | 9.05 | 6.48 |
| 18 | 49.25 | 29.85 | 12.96 | 7.94 |
| 19 | 41.97 | 30.97 | 17.71 | 9.36 |
| 20 | 35.07 | 31.17 | 23.13 | 10.63 |
| 21 | 28.81 | 30.53 | 29.00 | 11.66 |
| 22 | 23.36 | 29.20 | 35.02 | 12.42 |
| 23 | 18.77 | 27.39 | 40.93 | 12.90 |
| 24 | 15.01 | 25.32 | 46.54 | 13.14 |
| 25 | 11.99 | 23.14 | 51.70 | 13.16 |
| 26 | 9.61 | 21.01 | 56.35 | 13.04 |
| 27 | 7.74 | 18.99 | 60.47 | 12.81 |
| 28 | 6.28 | 17.13 | 64.07 | 12.52 |
| 29 | 5.15 | 15.47 | 67.19 | 12.19 |
| 30 | 4.27 | 13.99 | 69.88 | 11.87 |
| 31 | 3.58 | 12.68 | 72.18 | 11.56 |
| 32 | 3.04 | 11.55 | 74.14 | 11.27 |
| 33 | 2.61 | 10.56 | 75.81 | 11.02 |
| 34 | 2.28 | 9.69 | 77.21 | 10.81 |
|
||||
End of text box
3.0 People with Disabilities with the Potential to Work
As noted in Section 2, unemployment does not fully account for the employment gap between people with and without disabilities. Labour force non-participation is significantly higher among people with disabilities. A useful exercise, then, is to profile the working-age population with disabilities who are not employed but could potentially work. By the definition in Section 2, unemployed people with disabilities could potentially work. In addition, many individuals with disabilities who are not in the labour force may be willing to work.
In Section 3.1, different groups in the not in the labour force population are classified as “potential workers” or “not potential workers.” A demographic profile of each group is provided in Sections 3.2 and 3.3 to explain the rationale for assigning potential worker status. Section 3.4 presents a profile of the overall population classified as having the potential to work.
3.1 An estimate of the people with disabilities with the potential to work
Of the 1,155,500Note 3 people with disabilities aged 15 to 64 who were not in the labour force, 175,200 (15.2%) stated they would look for work in the next year. Among those who would not look for work, 632,600 (54.7%) were permanently retired, and 204,700 (17.7%) reported that their condition completely prevented them from working and that no “workplace arrangement or modification would enable them to work at a paid job or business.” Of the remaining 143,100, who would not look for work, 110,800 (9.6%) had previously been employed or were current students, and 32,300 (2.8%E) had never worked and were not actively pursuing studies.
In total, 444,000 people aged 15 to 64 with disabilities were unemployed or not in the labour force, and were not permanently retired or completely prevented from working. A small number of them (32,300E) had never worked and so were not asked if they were permanently retired. Because this group was predominantly older (section 3.3.3) and there was insufficient information to determine if they would be open to entering the labour force, they were excluded from the definition of potential workers. Thus, the potential worker population was estimated at about 411,600 (125,700 unemployed, 175,200 future job-seekers, and 110,800 other potential workers) (Table 1). A percentage breakdown of work potential among people with disabilities is represented in Chart 2.
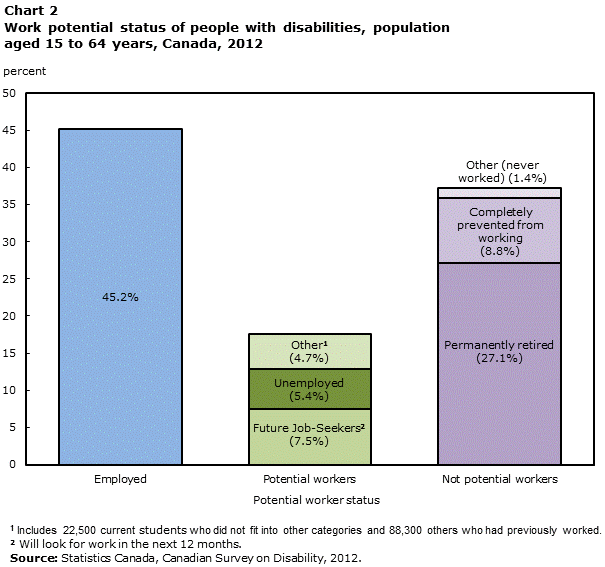
Description for Chart 2
The title of the graph is "Chart 2 Work potential status of people with disabilities, population aged 15 to 64 years, Canada, 2012."
This is a column stacked chart.
There are in total 3 categories in the horizontal axis. The vertical axis starts at 0 and ends at 50 with ticks every 5 points.
There are 7 series in this graph.
The vertical axis is "percent."
The horizontal axis is "Potential worker status."
The title of series 1 is "Employed."
The maximum value is 45.2 and it corresponds to "Employed."
The title of series 2 is "Future Job-SeekersNote 2."
The maximum value is 7.5 and it corresponds to "Potential workers."
The title of series 3 is "Unemployed."
The maximum value is 5.4 and it corresponds to "Potential workers."
The title of series 4 is "OtherNote 1."
The maximum value is 4.7 and it corresponds to "Potential workers."
The title of series 5 is "Permanently Retired."
The maximum value is 27.1 and it corresponds to "Not potential workers."
The title of series 6 is "Completely prevented from working."
The maximum value is 8.8 and it corresponds to "Not potential workers."
The title of series 7 is "Other (never worked)."
The maximum value is 1.4 and it corresponds to "Not potential workers."
| Employed | Future Job-SeekersNote 2 | Unemployed | OtherNote 1 | Permanently Retired | Completely prevented from working | Other (never worked) | |
|---|---|---|---|---|---|---|---|
| Employed | 45.2 | 0.0 | 0.0 | 0.0 | 0.0 | 0.0 | 0.0 |
| Potential workers | 0.0 | 7.5 | 5.4 | 4.7 | 0.0 | 0.0 | 0.0 |
| Not potential workers | 0.0 | 0.0 | 0.0 | 0.0 | 27.1 | 8.8 | 1.4 |
|
|||||||
3.2 Profile of people with disabilities with the potential to work
3.2.1 Will look for work in next 12 months
The demographic characteristics of future job-seekers (people with disabilities who were not in the labour force, but who intended to seek employment in the next 12 months) were generally similar to those of the unemployed population. Both groups were relatively young, consisting mostly of individuals younger than 45 (64.3% of future job-seekers, and 61.9% of unemployed). By comparison, 37.1% of the employed population were younger than 45. Half (51.1%) of future job-seekers were women, which is similar to both the unemployed and employed populations.
Future job-seekers and the unemployed had more severe disabilities than did people who were employed: over half of both groups (54.6% and 55.0%) reported severe or very severe disabilities, compared with a third of employed individuals (32.1%). Other similarities between the unemployed and future job-seekers were apparent in social assistance uptake, low-income status, and the household income distribution (Table 1). As well, the distribution of occupation types (based on most recent employment) was comparable.
Two characteristics on which future job-seekers and the unemployed differed were education and recent work experience. More than half (54.7%) of the unemployed had a postsecondary diploma or degree, compared with 42.9% of future job-seekers. And while 63.1% of the unemployed had worked within the last two years, the figure was 40.8% among future job-seekers (Table 1).
3.2.2 Will not look for work in next 12 months
The remaining subcategory in the potential worker population did not intend to look for work in the next 12 months. However, they indicated that they were not completely prevented from working, nor were they permanently retired. This population (110,800) was comprised of current students and people who had been previously employed but were not permanently retired (Table 1—“Other potential workers”).
The age distribution of “other potential workers” was similar to that of future job-seekers, with 61.2% being younger than 45. Their gender profile was comparable to both the unemployed and future job-seeker populations. About half of them (47.1%) had either mild or moderate disabilities.
However, their education and recent labour force attachment levels were generally even lower than those of future job-seekers (who, as discussed above, already had lower levels than the unemployed population). Around one-third (33.7%) of “other potential workers” had a postsecondary degree or diploma, while close to one-in-four (29.6%) worked within the past two years (2011 to 2012).
Social assistance receipt was higher among “other potential workers” (30.9%) than the unemployed (25.8%) and future job-seekers (21.7%). Household income levels were also similar among the three groups.
3.3 People with disabilities who were not potential workers
The people with disabilities who were not defined as potential workers were those who reported that they would not look for work over the next 12 months, and who also indicated that they:
- were completely prevented from working (and that no workplace arrangement or modification would enable them to work at a paid job or business); or
- were permanently retired; or
- had no previous work experience and were not current students.
3.3.1 Completely prevented from working
The profile of people who reported that their disability completely prevented them from working, and no workplace arrangement or modification would enable them to work, is consistent with labour market disadvantage. Within this group, 49.5% of respondents reported very severe disabilities, while another 28.2% had severe disabilities (Table 1).
Just under half (43.4%) of this group were receiving the Canada Pension Plan Disability benefit or the Quebec Pension Plan Disability benefit—programs reserved for people with “severe and prolonged” employment disabilities (Table 1). A quarter of them (25.2%) had never worked. Receipt of social assistance was high among this population (31.7%), as was receipt of private disability insurance (25.8%). A small percentage (5.1%) had looked for work within the past two years (data not shown).
3.3.2 Permanently retired
The second group not considered as potential workers were people with disabilities who were permanently retired. In general, this group was much older than potential workers: 67.3% were aged 55 to 64 and 24.4% were aged 45 to 54. More than 90.0% had been out of the labour force for at least two years; 62.9% had been out of the labour force for at least six years. A small percentage (9.3%) had worked during the previous two years, a large majority of whom (79.9%) were 55 or older.
A majority of people aged 15 to 64 with disabilities who were permanently retired reported that their condition had played a major role in the decision to retire. Three-quarters (75.2%) indicated that retirement was at least partially due to their condition, and of this group, 86.3% reported that their retirement was completely due to their condition. Despite the substantial impact that disability had on the retirement decision, respondents did not always perceive their retirement as forced. Half (52.2%) of those who retired between 2007 and 2012 reported that their retirement was voluntary.
Many of the permanently retired considered their training and/or experience to be inadequate for the current job market (32.3%E). This is consistent with the majority of the permanently retired being out of the labour force for several years. Very few retirees reported disability-specific issues in the labour environment, in the form of applying for work, past discrimination, accessibility issues or a lack of specialized transportation.
3.3.3 Remaining population who never worked
The final population (32,300E) excluded from “potential workers” were those who did not intend to look for work in the next 12 months, and who did not meet any of the previous criteria defining a potential worker. None of them had previously worked. This small population was generally older (47.4% were 55 to 64), less educated (60.7% had not graduated from secondary school), and had more severe disabilities (Table 1).
3.4 Population with the potential to work
In general, potential workers with disabilities were evenly distributed across the working-age spectrum, with close to 20.0% in each of the age groups except for the 55 to 64 years age group. Potential workers were younger than the employed population with disabilities: 62.7% were younger than 45, compared with 37.1% of those who were employed.
This group had a greater likelihood of severe disability: 54.3% had a severe or very severe disability, compared with 32.1% of employed persons with disabilities. They were less likely to have completed postsecondary education (44.1% versus 59.0%), and more likely to be single, separated or widowed (57.8% versus 38.3%).
The next section of this report examines employment-related barriers that potential workers face, and sheds light on challenges in improving their employment outcomes.
4.0 Employment Barriers and Successes for People with Disabilities
A number of questions arise about the employment barriers and challenges that confront potential workers with disabilities. What are the most needed accommodations and modifications? What are their training and workplace experience needs? Is workplace discrimination an issue? Additionally, for people with disabilities who are employed, what challenges do they face in advancing or changing jobs? To what degree are their accommodation and training needs met?
4.1 Full-time versus part-time
A critical aspect of employment for people with disabilities is the number and flexibility of hours they are able to commit to a current or potential job. Findings from the 2012 Canadian Survey on Disability (CSD) indicate a greater need for reduced or modified hours among potential workers with disabilities than for employed people with disabilities.
More than three-quarters (77.7%) of employed people with disabilities worked full time (30 or more hours per week). Of the 22.3% who worked part time (fewer than 30 hours per week), slightly over a third (36.0%) indicated that their disability or health condition was the main reason. The second most common response (23.3%) was that the respondent would have preferred to work full time, but was unable to find a position with full-time hours.
Findings from the CSD indicate that the majority of potential workers with disabilities would be able to work full time, although this percentage would be smaller than for the employed population with disabilities. Among potential workers actively seeking employment (that is, the “unemployed”), 59.5% indicated that they would not be limited in their ability to work full time, and 71.1% reported they would not be limited in their ability to work part time. Note 4
4.2 Workplace accommodations
Fewer than half (42.3%) of employed people with disabilities reported needing a workplace accommodation; among potential workers with disabilities, 58.6% would require a workplace accommodation.
The likelihood of requiring a workplace accommodation is larger for those with more severe disabilities: about 32.3% of employed individuals and 40.4% of potential workers with mild or moderate disabilities require an accommodation, while 63.6% of employed individuals and 74.4% of potential workers with severe or very severe disabilities require an accommodation.
4.2.1 Modified or reduced work hours most commonly needed accommodation
Potential workers with disabilities were also more likely than employed people with disabilities to require each of the individual accommodation types listed in the CSD (Chart 3).
For both groups, the most needed accommodation was modified or reduced work hours: 41.5% of potential workers needed this type of arrangement, compared with 22.6% of employed people with disabilities. Among those with severe or very severe disabilities, the need for modified or reduced work hours was higher: 56.0% of potential workers and 39.6% of employed persons.

Description for Chart 3
The title of the graph is "Chart 3 Workplace accommodations required by individuals with disabilities by work potential status, ages 15 to 64 years, Canada, 2012."
This is a bar clustered chart.
This is a horizontal bar graph, so categories are on the vertical axis and values on the horizontal axis.
There are in total 9 categories in the vertical axis. The horizontal axis starts at 0 and ends at 45 with ticks every 5 points.
There are 2 series in this graph.
The horizontal axis is "percent."
The vertical axis is "Work accommodations."
The title of series 1 is "Potential workers."
The minimum value is 7.5 and it corresponds to "Hand rails, ramps, or widened areas."
The maximum value is 41.5 and it corresponds to "Modified hours."
The title of series 2 is "Employed."
The minimum value is 2.8Note E: Use with caution and it corresponds to "Hand rails, ramps, or widened areas."
The maximum value is 22.6 and it corresponds to "Modified hours."
| Potential workers | Employed | |
|---|---|---|
| Modified hours | 41.5 | 22.6 |
| Modified or different duties | 31.1 | 13.4 |
| Specialized chair or back support | 25.4 | 17.0 |
| Modified or ergonomic workstation | 18.5 | 12.3 |
| Telework | 16.3 | 3.3 |
| Human support | 13.0Note E: Use with caution | 3.9Note E: Use with caution |
| Computer with specialized adaptation | 10.6 | 3.0Note E: Use with caution |
| Accessible elevator | 9.5 | 3.6Note E: Use with caution |
| Hand rails, ramps, or widened areas | 7.5 | 2.8Note E: Use with caution |
|
E use with caution Source: Statistics Canada, Canadian Survey on Disability, 2012. |
||
Other common needs among both employed and potential workers were modified or adapted job duties, back supports or specialized chairs, and ergonomic workstations. Less common were the ability to telework, human support (such as sign language interpreters, readers, job coaches/personal assistants), and specialized computers. The need for physical modifications to the building, such as accessible elevators, ramps and widened hallways was identified less frequently than the individualized supports mentioned above; building codes already require public buildings to have many of these features (Moyes, 2011).
Notable differences emerged in the types of accommodation needed by the employed and potential worker populations (Chart 3). For example, the percentage of potential workers requiring a telework accommodation was five times higher than that of their employed counterparts; the percentage requiring back supports or modified workstations was 1.5 times higher.
4.2.2 Most accommodation needs met by employers
The majority (79.5%) of employed people with disabilities who required workplace accommodations had at least some of their needs met (Chart 4). Modified work hours, the most commonly reported need, was also the need most commonly met, with 75.9% of employed people with disabilities who required this accommodation stating they received it. The needs that tended to be unmet were for communication aids, specialized computers, human aids and technical supports, although these were also among the least required aids (not shown in Chart 4).
Of the 165,000 employed individuals aged 15 to 64 who had at least some unmet needs for workplace accommodations, 44.6% said their employer was not aware of the need. The reasons most commonly cited for the employee not asking for the accommodation were that they felt uncomfortable asking (33.0%E) or they feared a negative outcome (33.1%E).
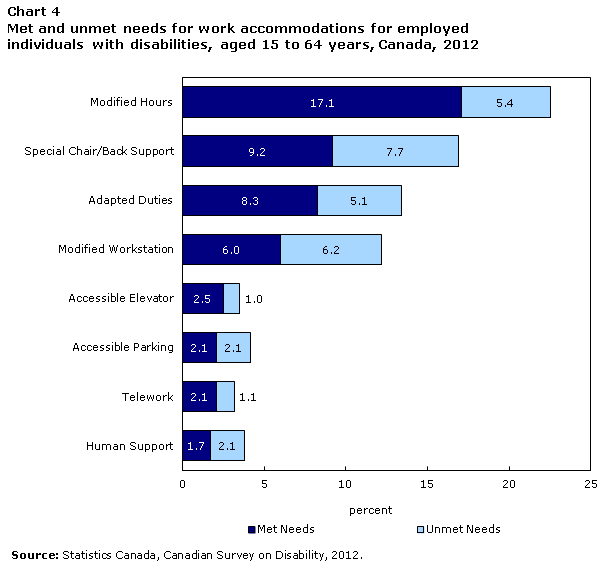
Description for Chart 4
The title of the graph is "Chart 4 Met and unmet needs for work accommodations for employed individuals with disabilities, aged 15 to 64 years, Canada, 2012."
This is a stacked bar chart.
This is a horizontal bar graph, so categories are on the vertical axis and values on the horizontal axis.
There are in total 8 categories in the vertical axis. The horizontal axis starts at 0 and ends at 25 with ticks every 5 points.
There are 2 series in this graph.
The horizontal axis is "percent."
The vertical axis is "Work accommodations."
The title of series 1 is "Met Needs."
The minimum value is 1.7 and it corresponds to "Human Support."
The maximum value is 17.1 and it corresponds to "Modified Hours."
The title of series 2 is "Unmet Needs."
The minimum value is 1.0 and it corresponds to "Accessible Elevator."
The maximum value is 7.7 and it corresponds to "Special Chair/Back Support."
| Met Needs | Unmet Needs | |
|---|---|---|
| Modified Hours | 17.1 | 5.4 |
| Special Chair/Back Support | 9.2 | 7.7 |
| Adapted Duties | 8.3 | 5.1 |
| Modified Workstation | 6.0 | 6.2 |
| Accessible Elevator | 2.5 | 1.0 |
| Accessible Parking | 2.1 | 2.1 |
| Telework | 2.1 | 1.1 |
| Human Support | 1.7 | 2.1 |
|
Source: Statistics Canada, Canadian Survey on Disability, 2012. |
||
4.3 Barriers to finding work or advancing in employment
4.3.1 Barriers to looking for work
As noted in Section 2, a number of people with disabilities who were not in the labour force may have been discouraged from seeking work as a result of encountering barriers. Some of these barriers may be disability-specific, while others may apply to the entire population. However, even those applicable to the entire population may be magnified by the presence of disability. The CSD asked about the different types of barriers experienced by people with disabilities who were not in the labour force. This section highlights the results for those who were identified as potential workers.
Overall, 72.6% (199,200) of potential workers with disabilities who were not in the labour force experienced at least one of the barriers related to looking for work listed in the CSD. The most common barriers were applicable to the population with and without disabilities, and were associated with the availability of local jobs, inadequate training or experience, and past lack of success in finding employment (Chart 5).

Description for Chart 5
The title of the graph is "Chart 5 Job search barriers for potential workers with disabilities not in labour force, aged 15 to 64 years, Canada, 2012."
This is a bar clustered chart.
This is a horizontal bar graph, so categories are on the vertical axis and values on the horizontal axis.
There are in total 10 categories in the vertical axis. The horizontal axis starts at 0 and ends at 40 with ticks every 5 points.
There are 1 series in this graph.
The horizontal axis is "percent."
The vertical axis is "Type of job search barriers."
The title of series 1 is "percent."
The minimum value is 8.9 and it corresponds to "Family/friends discourage."
The maximum value is 32.5 and it corresponds to "Few jobs available in local area."
| percent | |
|---|---|
| Few jobs available in local area | 32.5 |
| Training or experience is not adequate | 31.9 |
| Past attempts to find work unsuccessful | 26.0 |
| Expected employment income less than current income | 18.5 |
| Prevented by family responsibilities | 18.2 |
| Experienced discrimination in the past | 17.4 |
| Would lose additional supports | 15.3 |
| Accessibility issues while applying for work | 12.3 |
| Lack of specialized transportation | 9.4 |
| Family/friends discourage | 8.9 |
|
Source: Statistics Canada, Canadian Survey on Disability, 2012. |
|
Financial barriers to employment also have a significant prevalence among potential workers not in the labour force. For example, some social assistance programs offer support such as financial aid for housing, medication or local transportation that would be unavailable if the individual earned too much employment income. Further, the earnings potential of an individual may not match the baseline level of support offered by social assistance programs, especially given the high percentage of people with disabilities who require reduced work hours. One in five (18.5%) potential workers who were not in the labour force expected that they would earn less in employment than their current level of income, and 15.3% expected that they would lose additional benefits from support-based programs.
Finally, disability-specific job search barriers also have a significant prevalence among potential workers. These can include discrimination (which will be explored in Section 4.5), accessibility issues encountered while searching, applying and interviewing for jobs, and difficulties with the accessibility of local transportation.
4.3.2 Barriers to advancing in or changing jobs
Barriers and challenges with respect to full participation in employment remain even after people with disabilities obtain a job. Moreover, people with disabilities experience additional disadvantages such as lower compensation and weaker job tenure.
Overall, 396,000 (46.4%) employed people with disabilities had at least some difficulty advancing in or changing jobs, because of their disability. Fully 84.8% with very severe disabilities reported difficulty, compared with 30.3% who had mild disabilities.
The most prevalent reason (30.9%) for such difficulties was that their condition limited the number of hours they could work, which is noteworthy given that modified/reduced hours was the most needed workplace accommodation (Section 4.2). Those with very severe conditions were far more likely than those with mild, moderate, or severe conditions to state that limited hours resulted in difficulty advancing in employment (50.8%E versus 25.5%).
Other common reasons for difficulty advancing in or changing jobs were: difficulty in adapting to a new environment (25.0%); the condition made it difficult to search for a job (12.7%E), and discrimination or stigma (11.4%E). The likelihood of stating each of these reasons was fairly consistent across severity classes.
4.4 Training and workplace experience
The importance of skills obtained through formal education, informal training or workplace experience emerged in CSD findings with respect to increasing employment levels among people with disabilities. Regardless of severity of the disability, individuals with postsecondary education were more likely than those with secondary school education or less to be employed. Further, lack of training and/or experience was one of the top barriers that people with disabilities faced when looking for work, and one of the main reasons for labour force discouragement among those who left the labour force permanently via retirement. This section provides additional data on the importance of training and experience.
How long have potential workers been out of employment?
One-third (33.9%) of potential workers with disabilities had worked in 2012 (the year of survey), and a further 10.9% had last worked in 2011. Thus, the remaining 55.2% had not had paid employment for at least two years.
Work-related training
Potential workers who had worked at some point during or after 2007 were asked about workplace training. Of these 260,800 individuals, 42.0% stated that they had received on-the-job training at their previous job. The experience of employed individuals with disabilities was similar, with 39.7% stating they had received on-the-job training within the last 12 months.
However, potential workers were about half as likely as employed workers to have received training not provided or paid for by an employer within the last 12 months (5.7% versus 11.0%). This suggests that once out of employment, potential workers are less likely to seek out or have access to training. A majority (65.8%) of potential workers with disabilities who received training not provided or paid for by an employer had paid for it themselves.
One-third (33.3%) of potential workers who had not taken training had wanted to take work-related training during the previous year, compared with 19.0% of the employed population with disabilities.
4.5 Perceived discrimination
Employment discrimination can come in many forms. The CSD asked about three direct tangible employment consequences as a result of perceived disability-based discrimination: “In the past five years, do you believe that because of your condition, you have been refused
- a job interview?”
- a job?”
- a job promotion?”
The prevalence of these perceptions among employed and potential workers with disabilities is presented in Chart 6. In general, potential workers felt they experienced discrimination to a greater degree than did those who were employed; being refused a job was the most common type among the three listed.

Description for Chart 6
The title of the graph is "Chart 6 Perceived discrimination of people with disabilities who are currently employed or potential workersNote 1, aged 15 to 64 years, Canada, 2012."
This is a bar clustered chart.
This is a horizontal bar graph, so categories are on the vertical axis and values on the horizontal axis.
There are in total 4 categories in the vertical axis. The horizontal axis starts at 0 and ends at 60 with ticks every 10 points.
There are 2 series in this graph.
The horizontal axis is "percent."
The vertical axis is "Type of perceived discrimination."
The title of series 1 is "Potential workers."
The minimum value is 12.7 and it corresponds to "Denied promotion."
The maximum value is 51.3 and it corresponds to "Feels disadvantagedNote 2."
The title of series 2 is "Employed."
The minimum value is 6.7 and it corresponds to "Denied job interview."
The maximum value is 38.6 and it corresponds to "Feels disadvantagedNote 2."
| Potential workers | Employed | |
|---|---|---|
| Denied job interview | 17.0 | 6.7 |
| Denied job | 22.9 | 10.7 |
| Denied promotion | 12.7 | 8.1 |
| Feels disadvantagedNote 2 | 51.3 | 38.6 |
|
||
Overall, 27.9% of potential workers reported being denied an interview, a job, or a promotion, compared with 16.2% of those who were employed (data not shown). Younger individuals were generally more likely to report discrimination. For example, 36.4% of potential workers aged 25 to 34 reported being refused an interview, a job, or a promotion, compared with 18.7%E of those aged 55 to 64. The likelihood of perceiving discrimination was higher for potential workers with severe or very severe conditions: 38.4% of potential workers with severe or very severe disabilities reported being refused an interview, a job, or a promotion, compared with 17.5% of those with mild or moderate disabilities.
5.0 Conclusion
Results of the 2012 Canadian Survey on Disability (CSD) show that although many people with disabilities who were not labour force participants were either permanently retired or completely prevented from working, many had the potential to work. Standard labour force measures may not capture the true potential to work among people with disabilities.
The labour market disadvantage experienced by people with disabilities comes in many forms:
- Modified/reduced hours was the workplace accommodation most needed by people with disabilities who were employed and those with the potential to work. And while this was the need most commonly met by employers, modified/reduced hours was also the reason most frequently cited for difficulty advancing in employment.
- Education and skills development are integral to closing the employment gap between people with and without disabilities. For instance, the gap was narrowest between those with postsecondary credentials.
- Many people with disabilities with the potential to work wished to improve their skills through training. However, once out of employment, potential workers are less likely to seek out or have access to training.
- Youth with disabilities are at a comparative disadvantage, with relatively low employment levels while still in school, and weaker labour force attachment after graduation.
These are complex issues requiring creative solutions, and many employers are working with their employees with disabilities to ensure a supportive workplace. Additional information incorporating the perspectives of employers and service providers is important for continued progress toward full participation in employment of people with disabilities.
References
Akyeampong, Ernest B. 1989. "Discouraged workers." Perspectives on Labour and Income Vol. 1, No.2. Autumn. Statistics Canada. IS 893 A6. p. 64-69.
Arim, Rubab. 2015. “A profile of persons with disabilities among Canadians aged 15 years or older, 2012.” Canadian Survey on Disability, 2012. Statistics Canada Catalogue no. 89-654-X. ISBN 978-1-100-25046-5.
Ebersold, Serge. 2012. “Transitions to Tertiary Education and Work for Youth with Disabilities.” Education and Training Policy, OECD Publishing. http://dx.doi.org/10.1787/9789264177895-en. ISBN:978-92-64-17789-5.
Fawcett, Gail. 1996. “Living with Disability in Canada: An Economic Portrait.” Human Resources Development Canada (HRDC). Catalogue no. MP80-2/8-1996E. ISBN: 0-662-25110-5.
Government of Canada. 2009. 2009 Federal Disability Report: Advancing the Inclusion of People with Disabilities. Human Resources and Skills Development Canada. ISSD-001-11-09. Catalogue no. HS61-1/2009. ISBN: 978-1-100-50352-3.
Government of Canada. 2010. 2010 Federal Disability Report: The Government of Canada’s Annual Report on Disability Issues. Human Resources and Skills Development Canada. ISSD-001-11-10. Catalogue no. HS61-1/2010. ISBN no. 978-1-100-52363-7.
Loprest, Pamela and Elaine Maag. 2007. “The relationship between early disability onset and education and employment.” Journal of Vocational Rehabilitation, Vol. 26, No 1. p. 49-62.
Moyes, Rowena. 2011. “Housing Accessibility Regulation In Canada.” Canadian Home Builders’ Association.
Organisation for Economic Co-operation and Development (OECD). 2010. “Sickness, Disability and Work: Breaking the Barriers; A Synthesis of Findings Across OECD Countries.” ISBN 978-92-64-08884-9 (print). ISBN 978-92-64-08885-6 (PDF).
Organisation for Economic Co-Operation and Development (OECD). 2012. “Apprenticeships and Workplace Learning.” Skills Strategy Spotlight Series (2013a), No. 3.
Organization for Economic Co-operation and Development (OECD). 2013b. “Mental Health and Work: Denmark”. OECD Publishing. http://dx.doi.org/10.1787/9789264188631-en.
Statistics Canada. 2008. Participation and Activity Limitation Survey of 2006: Labour Force Experience of People with Disabilities in Canada. Statistics Canada Catalogue no. 89-628-X2008007.
Statistics Canada. 2014. Guide to the Labour Force Survey 2014. Section 2: Determining labour force status. Statistics Canada Catalogue no. 71-543-G.
Turcotte, Martin. 2014. "Persons with disabilities and employment.” Insights on Canadian Society. Statistics Canada Catalogue no. 75-006-X. ISSN 2291-0859.
Yelin, Edward H. and Patricia P. Katz. 1994. “Labor force trends of persons with and without disabilities.” Monthly Labor Review, 117, p. 36.
Glossary of Terms
Accommodation (workplace): Modifications to the job or work environment that can enable a person with an activity limitation to participate fully in the work environment. This can include modifications to the physical workplace (such as ramps, adapted washrooms or hand rails), adaptations to the job (such as modified hours, different duties or telework) or specialized furniture (such as modified workstations).
Barriers (workplace): Obstacles that hinder or prevent people with disabilities from participation in the labour market.
Disability type: Specific area in which an activity limitation was reported. Eleven disability types are listed in the 2012 Canadian Survey on Disability (CSD): hearing, seeing, mobility, flexibility, dexterity, pain, learning, developmental, mental health-related, memory, and unknown. An individual can have multiple disability types.
Employed: Those who, during the reference period, did any work for pay or profit. This includes those who had a job but were absent from work for reasons such as own illness or disability, personal or family responsibilities, vacation, or labour dispute. It also includes unpaid family work, which is defined as unpaid work contributing directly to the operation of a farm, business or professional practice owned and operated by a related member of the same household.
Employment rate: The number of persons employed expressed as a percentage of the total population.
Employment-based discrimination: For this report, discrimination refers to the respondents’ self-perception of being refused a job interview, a job or a promotion as a result of their condition.
Labour force: The population who are either working (employed) or looking for work (unemployed).
Labour force participation: To work, or to look for work, in the labour market.
Modification: see Accommodation.
NEET: Not in employment, education or training.
Not in employment: People who are not employed.
Not in labour force: People who are neither employed nor unemployed.
Older working-age adults: People between the ages of 55 to 64 years.
People with disabilities: People whose daily activities are limited because of a long-term condition or health-related problem.
Potential workers: Working-age people with disabilities who are either unemployed or not in the labour force, but have indicated they would look for work in the next 12 months or are not completely prevented from working nor retired.
Unemployed: Those who, during the reference week:
- were on temporary layoff during the reference week with an expectation of recall and were available for work; or
- were without work, had looked for work in the past four weeks, and were available for work; or
- had a new job to start within four weeks from reference week, and were available for work.
Unemployed as a percentage of those not employed: The number of persons unemployed expressed as a percentage of all unemployed + not in the labour force.
Unemployment rate: The number of persons unemployed expressed as a percentage of the labour force.
Work potential: see Potential workers.
Working-age: People between the ages of 15 to 64 years.
Youth: Young adults aged 15 to 24 years.
- Date modified: