
Aboriginal Peoples Survey
Indigenous people with disabilities in Canada: First Nations people living off reserve, Métis and Inuit aged 15 years and older

Archived Content
Information identified as archived is provided for reference, research or recordkeeping purposes. It is not subject to the Government of Canada Web Standards and has not been altered or updated since it was archived. Please "contact us" to request a format other than those available.
by Tara Hahmann, Ph.D., Nadine Badets, and Jeffrey Hughes
- In 2017, 32% of First Nations people living off reserve, 30% of Métis and 19% of Inuit had one or more disabilities that limited them in their daily activities.
- Rates of disability among First Nations people living off reserve and Métis were higher than for non-Indigenous people. This remained true after accounting for differences in age, geography and population centre size between the population groups. Rates of disability among Inuit were lower, largely because Inuit are younger.
- Among First Nations people living off reserve, Métis and Inuit, disability rates were higher for women than for men. Disability rates increased with age for both men and women.
- Of all severity levels, mild disabilities were most common among all three Indigenous groups and for both men and women.
- Among all Indigenous groups, pain-related disabilities were most prevalent.
- Differences in disability rates were observed by province and territory as well as by Inuit region in Inuit Nunangat. Among First Nations people living off reserve and Métis, disability prevalence was higher in Nova Scotia, New Brunswick, Ontario, British Columbia and Alberta while among Inuit it was higher in Nunatsiavut.
Introduction
In Canada, disability is defined using the social model of disability, which takes into account not just a person's impairments or task difficulties, but also the added impact of environmental barriers to create disability. These environmental barriers can be physical obstacles such as stairs; they can be technological such as inaccessible websites; or they can be attitudinal resulting in discrimination and exclusion. This approach focuses on barriers to the participation of persons with disabilities in society and the economy (Government of Canada, 2019).
Although disability has been studied widely for the Canadian population in general (Arim, 2012; Burlock, 2017; Casey, 2015; Morris, Fawcett, Brisebois, & Hughes, 2018), far less research exists with a focus on disability among First Nations people, Métis and Inuit. These groups are often underrepresented in studies or treated as a homogenous group (Wilson & Young, 2008), neglecting the cultural, historical and geographic diversity of these populations. Research on disability among Indigenous peoples is especially relevant in light of experienced discrimination, historic oppression and trauma (Truth and Reconciliation Commission of Canada, 2018) that are tied to various social and health inequalities (Firestone, Tyndall, & Fischer, 2015).
Previous research has shown higher disability prevalence among Indigenous peoples in Canada when compared to the non-Indigenous population (Burlock, 2017). According to the 2012 Canadian Survey on Disability, Indigenous women were more likely to have one or more disabilities than non-Indigenous women, with a similar pattern between Indigenous and non-Indigenous men albeit to a lesser degree. Indigenous women were also more likely to experience severe or very severe disabilities than non-Indigenous women.
There is limited research on disability types among Indigenous peoples. Much of the research conducted on these populations has approached the topic from the perspective of chronic health issues rather than disability. For instance, according to the 2008/2010 First Nations Regional Health Survey, based on First Nations adults living on reserve and in Northern communities, the most frequently reported chronic health conditions were chronic back pain (16.2%), hearing impairment (8.8%), blindness or vision problems (3.6%), learning disability (3.6%), and cognitive or mental health issues (1.2%). Previous studies on pain among Indigenous peoples in Canada and the United States have found markedly higher rates of reported pain overall and in specific areas of the body (e.g., back, head, neck, joints) when compared with the non-Indigenous population (Jimenez, Garroutte, Kundu, Morales, & Buchwald, 2011). These studies provide important contextual information about the health problems faced by First Nations people living on reserve and Indigenous peoples more generally.
The present study seeks to fill a knowledge gap by providing a profile of First Nations people living off reserveNote, Métis, and Inuit living with a disability using data from the 2017 Aboriginal Peoples Survey (APS).Note The APS is a unique national survey designed to collect information on the social and economic conditions of Indigenous peoples in Canada.
The paper provides an overview of disability prevalenceNote among First Nations people living off reserve, Métis and Inuit by sex, age group and geography. To account for differences in sex, age, geography (i.e. province/territory/Inuit region), and population centre size between the population groups considered, logistic regression analysis is presented (see Textbox 2). A discussion of disability characteristics, including disability severity and disability type, follows.
Disability prevalence were established for each of the three Indigenous groups based on the Disability Screening Questions (DSQ), included in the APS for the first time in 2017. The study also uses data from the 2017 Canadian Survey on Disability (CSD); this survey, likewise, uses the DSQ to identify persons with disabilities, and provides disability-related information on the general population.Note This data source is used to establish disability rates for the non-Indigenous population, to help contextualize findings for First Nations people living off reserve, Métis and Inuit.
Indigenous peoples differ from the non-Indigenous population in several ways, including different demographic characteristics such as a younger age structure and unique regional concentration (Statistics Canada, 2018). Access to supports and services such as health care is an additional challenge more pronounced among Indigenous peoples (Davy, Harfield, McArthur, Munn, & Brown, 2016; Liddy, McKellips, Armstrong, Afkham, & Fraser-Roberts, 2017). In addition, the historical and ongoing impacts of colonization, such as the forced placements of children in residential schools, removal of children from their families, and relocation of communities are all important factors, unique to Indigenous peoples (King, Smith, & Gracey, 2009; McKenzie, Varcoe, Browne, & Day, 2016), that should be reflected on in the forthcoming analysis. In this study, rates of disability among the non-Indigenous population are provided as context for the focal analysis of Indigenous populations. Comparisons between rates for non-Indigenous and Indigenous populations should be viewed with these differences in mind.
Start of text boxThe CSD and APS use Canada’s new Disability Screening Questions (DSQ) which were developed between 2010 and 2012. The DSQ is based on the social model of disability, which defines disability as limitations of one’s activities resulting from the interaction of one’s impairments (or task difficulties) with one’s environment. The DSQ were designed to better identify persons with disabilities, and include ten disability types (as well as an “unknown” type) and the level of disability severity. The DSQ target respondents who not only have difficulty with everyday tasks or have an impairment due to a long-term condition or health problem, but who also experience a limitation in their daily activities as a result. For more information, see Canadian Survey on Disability, 2017: Concepts and Methods Guide.
Close to one in three of both First Nations people living off reserve and Métis had a disability and close to one in five Inuit had a disability
Indigenous people made up 4.9% of the Canadian population in 2016, according to the Census of Population. Of the Indigenous population in Canada, 58% were First Nations people (living both on and off reserve), 35% were Métis, and 4% were Inuit. The majority reported a single Indigenous identity (Statistics Canada, 2017c). More than half of First Nations people lived off reserve (56%) (Statistics Canada, 2017c).
The prevalence of disabilitiesNote varied between Indigenous groups, with close to a third of both First Nations people living off reserve (32%) and Métis (30%) aged 15 and older having at least one disability in 2017. Among Inuit, that proportion was 19% (Table 1).Note Twenty-two percent of the non-Indigenous population had a disability.Note
Past research has shown that disability tends to increase with age (Morris et al., 2018). With respect to the three Indigenous groups, rates of disability should be interpreted in the context of a young population (Statistics Canada, 2018). Inuit were the youngest of the three Indigenous population groups with an average age of 27.7 years, followed by First Nations people at 30.6 and Métis at 34.7 years (Statistics Canada, 2018). Among the general population, the average age was 41 years (Statistics Canada, 2016).
Disability increased with age for both men and women among all three Indigenous groups
Previous studies have shown that women had higher rates of disability than men (Burlock, 2017). Results from this study mirror these findings, as First Nations, Métis, and Inuit women were more likely to have a disability than their male counterparts (data not shown). Differences in disability prevalence between Indigenous women and men were larger than between their non-Indigenous counterparts.Note
Among Indigenous and non-Indigenous men and women, disability increased with age, although trends varied by Indigenous group and sex (Table 1). Among First Nations women living off reserve, those aged 40 to 54 years (45%) and 55 years and older (44%) were more likely to have a disability than those 15 to 24 years of age (27%). The pattern among First Nations men living off reserve was similar.
Among Métis women, the rate of disability was higher among those 55 years and older (43%) than among those 15 to 24 years of age (31%). The rate of disability for Métis men 40 years of age and older was higher than for those in the youngest age group.
Rates of disability for Inuit women aged 40 to 54 years (23%) and 55 years and older (38%) were higher than for those aged 15 to 24 (14%). Inuit men aged 55 and older had significantly higher rates of disability than those 15 to 24 years of age.
| Age group | Indigenous identity | |||
|---|---|---|---|---|
| First Nations people living off reserve | Métis | Inuit | Non-Indigenous people | |
| percent | ||||
| 15 years and older | 32.3 | 30.0 | 18.6 | 21.8 |
| Men | ||||
| 15 to 24 years (reference category) | 19.0 | 16.6 | 9.1 | 10.2 |
| 25 to 39 years | 17.0 | 18.1 | 11.3 | 11.6 |
| 40 to 54 years | 31.8Note * | 28.6Note * | 15.5 | 18.3Note * |
| 55 years and older | 39.8Note * | 36.4Note * | 35.7Note * | 30.9Note * |
| Women | ||||
| 15 to 24 years (reference category) | 26.9 | 31.3 | 13.5 | 14.8 |
| 25 to 39 years | 33.9 | 26.8 | 19.0 | 16.8Note * |
| 40 to 54 years | 45.0Note * | 36.1 | 22.9Note * | 20.0Note * |
| 55 years and older | 44.1Note * | 43.4Note * | 38.0Note * | 33.8Note * |
Sources: Statistics Canada, Aboriginal Peoples Survey, 2017; Canadian Survey on Disability, 2017. |
||||
It is important to account for unique demographic characteristics of Indigenous peoples when assessing how disability rates differ from the non-Indigenous population. Accounting for differences in demographic characteristics, such as the younger age structure of Indigenous peoples in comparison to non-Indigenous peoples, can help to identify the extent to which differences in disability rates are influenced by such factors. Differences in disability rates between Indigenous and non-Indigenous populations that persist after demographic variables are taken into account, can be attributed to a range of additional factors not reflected in the models.Note
Accordingly, this analysis uses the population average of each Indigenous groupNote in the analysis to better understand how factors such as age, sex, geography (i.e. province/territory/Inuit region), and population centre size help to explain the differences between rates of disability for non-Indigenous people and First Nations people living off reserve, Métis, and Inuit, respectively. To do so, we calculate what the predicted disability rateNote among the non-Indigenous population would be if this population had the age, sex, geography, and population centre size characteristics of First Nations people living off reserve; then similarly for Métis and Inuit. For more information on the multivariate analysis, see the ‘Methods’ section. For a more detailed description of the findings, see the Appendix.
After accounting for the selected demographic variables, disability remained higher for First Nations people living off reserve and Métis
After accounting for the demographic characteristics noted above, First Nations people living off reserve and Métis remained more likely than non-Indigenous people to have a disability, indicating that the differences in disability rates between these groups are not primarily due to differences in these demographic characteristics.
Among Inuit, younger age structure and geography are important considerations in disability prevalence
In contrast to findings presented in Table 1, Inuit were no longer less likely to have a disability than the non-Indigenous population once differences in the selected demographic characteristics were accounted for. The predicted probability of having a disability for non-Indigenous people (at the population average for Inuit) (12%)Note was substantially lower than the actual overall non-Indigenous disability rate (22%). This indicates that demographic characteristics—including, in particular, a younger age structure and different geographic distribution, which could reflect differences in remoteness, access to services, amongst other factors—play a significant role in the overall lower disability rate for the Inuit population.
Among all three Indigenous groups, women had higher rates of predicted disability than men and these differences were larger than among non-Indigenous people
As seen in Table 1, disability rates were higher for women among all Indigenous identity groups, and increased with age. However, it is important to examine how these relationships differed between Indigenous peoples and the non-Indigenous population.Note
Compared to non-Indigenous people, the predicted disability rates for First Nations people living off reserve and Métis were much higher at younger ages, but were more similar at older ages. In contrast, for younger Inuit, predicted disability rates were quite similar to the non-Indigenous population, but these rates diverged for older Inuit, such that older Inuit had a higher predicted rate than non-Indigenous people.
In addition, among all three Indigenous groups, younger women had higher predicted disability rates than men, and these differences were larger than the difference between non-Indigenous men and women. However, these sex-based differences decreased with age.
While demographic differences between non-Indigenous people and First Nations people living off reserve, Métis, and Inuit accounted for some of the differences in disability rates, many other factors need be considered
While accounting for age, sex, geography, and population centre sizeNote does provide important insights for understanding patterns of disability rates, it is clear that there are other factors involved. Even after controlling for these demographic variables, there was still an overall difference in predicted disability rates of 11 to 14 percentage points for First Nations people living off reserve and Métis compared to non-Indigenous people. In addition, while demographic differences did help explain some of the differences in disability rates between Inuit and non-Indigenous people, there still remained unexplained differences that result from other variables not included in this analysis. Thus, differences in demographic characteristics between Indigenous populations and non-Indigenous people explain some of the differences in the prevalence of disability, and are thus important to account for, but do not provide the full picture.
Of all severity levels, mild disabilities were the most common among all three Indigenous groups
A global severity score can be calculated for each person on both the APS and CSD, using the number of disability types that a person has, the level of difficulty experienced in performing certain tasks, and the frequency of activity limitations. Four severity classes were established: mild, moderate, severe, and very severe.Note Among all groups, the most prevalent level of disability severity was mild (Chart 1). This was observed for both women and men. Inuit were more likely to have a moderate or severe disability than a very severe disability.
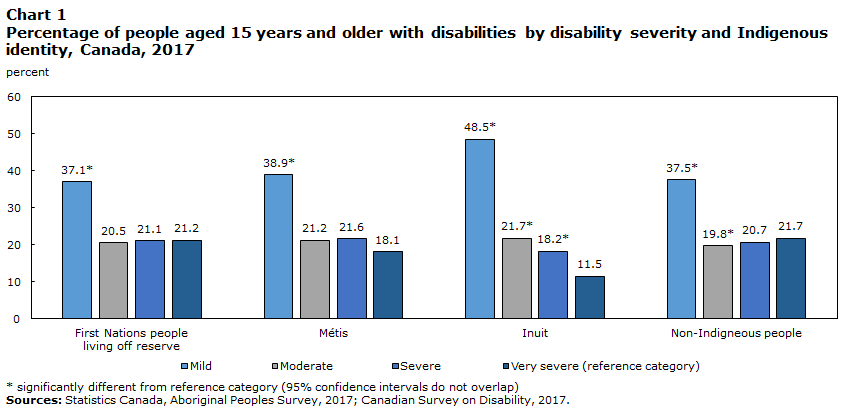
Data table for Chart 1
| First Nations people living off reserve |
Métis | Inuit | Non-Indigenous people | |
|---|---|---|---|---|
| Severity of disability | percent | |||
| Mild | 37.1Note * | 38.9Note * | 48.5Note * | 37.5Note * |
| Moderate | 20.5 | 21.2 | 21.7Note * | 19.8Note * |
| Severe | 21.1 | 21.6 | 18.2Note * | 20.7 |
| Very severe (reference category) | 21.2 | 18.1 | 11.5 | 21.7 |
|
||||
Severity of disabilities increased with age among all Indigenous groups
Disability severity level was examined across all age groups, with a specific focus on severe and very severe disabilities, which were combined and designated as “more severe”. First Nations people living off reserve and Métis aged 40 years or older were more likely to have a more severe disability than those aged 15 to 24. Among Inuit, more severe disabilities were more prevalent after the age of 55 (Chart 2).
Among non-Indigenous people, the rate of more severe disabilities were higher for those aged 40 to 54 years and then again for those 55 years and older when compared to those 15 to 24 years of age (Chart 2).Note
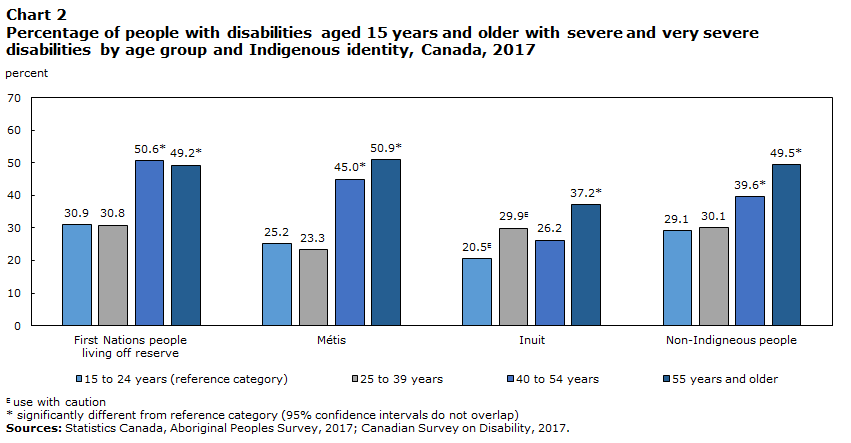
Data table for Chart 2
| First Nations people living off reserve |
Métis | Inuit | Non-Indigenous people | |
|---|---|---|---|---|
| Age group | percent | |||
| 15 to 24 years (reference category) | 30.9 | 25.2 | 20.5Note E: Use with caution | 29.1 |
| 25 to 39 years | 30.8 | 23.3 | 29.9Note E: Use with caution | 30.1 |
| 40 to 54 years | 50.6Note * | 45.0Note * | 26.2 | 39.6Note * |
| 55 years and older | 49.2Note * | 50.9Note * | 37.2Note * | 49.5Note * |
E use with caution
|
||||
Among all Indigenous groups, pain-related disabilities were the most common disability type
The DSQ assesses information on ten disability types (plus an “unknown type”), and respondents can be identified as having one or multiple co-occurring disability types. Pain-related disabilities were the most common disability type among all three Indigenous groups and among non-Indigenous people (Table 2). Roughly one in five of both First Nations people living off reserve and Métis had a pain-relatedNote disability whereas closer to one in nine Inuit had this disability type.Note This higher prevalence of pain-related disabilities among Indigenous peoples (Jimenez et al., 2011) and the general population has been documented in previous studies (Morris et al., 2018).
The second most common disability type among all three Indigenous groups was mental-health related disabilities. Among First Nations people living off reserve and among Métis, the proportion with one or more mental-health related disabilities were 14% and 13% respectively. Among Inuit, the proportion was 6% (Table 2).
Furthermore, a lack of health care access could impact the way in which individuals conceptualize questions surrounding their impairments, and what may be considered a “limitation” in their daily activities. Understanding the ways in which health care access may be related to considerations of disability requires further analysis that goes beyond the scope of this paper.
Comparisons between disability type prevalence based on the CSD and APS must be interpreted in the context of data collection differences between the two surveys. Given that certain disability types were not accommodated in data collection in the same way between surveys, APS rates might be lower than CSD rates. For more information on comparability between the two surveys see the ‘Data Sources’ section.
| Disability type | Indigenous identity | |||
|---|---|---|---|---|
| First Nations people living off reserve | Métis | Inuit | Non-Indigenous people | |
| percent | ||||
| Pain-related | 22.2 | 20.7 | 11.4 | 14.2 |
| Flexibility | 11.2 | 10.0 | 3.9 | 9.8 |
| Mobility | 12.1 | 10.1 | 5.5 | 9.3 |
| Mental health-related | 13.7 | 12.5 | 5.7 | 6.9 |
| Seeing | 5.8 | 4.9 | 3.1 | 5.2 |
| Hearing | 4.7 | 4.3 | 4.7 | 4.6 |
| Dexterity | 5.8 | 5.2 | 1.8 | 4.4 |
| Learning | 7.2 | 6.6 | 2.9 | 3.8 |
| Memory | 5.4 | 4.6 | 2.3 | 3.6 |
| Developmental | 2.2 | 1.5 | 0.7Note E: Use with caution | 1.0 |
| Unknown | 0.5 | 0.9 | 0.5Note E: Use with caution | 0.5 |
|
E use with caution Note: Percentages do not add to 100% because individuals can have more than one disability type. Sources: Statistics Canada, Aboriginal Peoples Survey, 2017; Canadian Survey on Disability, 2017. |
||||
Women were more likely to have pain- and mental health-related disabilities than men across all Indigenous groups
Women were typically more likely than men to have various disability types (Table 3). Compared to men, First Nations women living off reserve and Métis women were more likely to have pain-related, flexibility, mobility, mental health-related, seeing, and dexterity disabilities. Inuit women were more likely than men to have pain-related and mental health-related disabilities (Table 3).Note
| Disability type | Indigenous identity | |||||||
|---|---|---|---|---|---|---|---|---|
| First Nations people living off reserve | Métis | Inuit | Non-Indigenous people | |||||
| Men (reference category) | Women | Men (reference category) | Women | Men (reference category) | Women | Men (reference category) | Women | |
| percent | ||||||||
| Pain-related | 17.4 | 26.2Note * | 17.2 | 24.0Note * | 8.8 | 13.7Note * | 12.2 | 16.1Note * |
| Flexibility | 8.5 | 13.4Note * | 8.7 | 11.1Note * | 3.1 | 4.6 | 8.8 | 10.7Note * |
| Mobility | 9.0 | 14.6Note * | 8.3 | 11.7Note * | 4.5 | 6.3 | 7.7 | 10.9Note * |
| Mental health-related | 7.6 | 18.7Note * | 8.2 | 16.6Note * | 3.8 | 7.4Note * | 5.3 | 8.5Note * |
| Seeing | 3.8 | 7.4Note * | 3.2 | 6.4Note * | 2.4 | 3.7 | 4.4 | 6.0Note * |
| Hearing | 4.3 | 5.0 | 4.5 | 4.0 | 4.1 | 5.4 | 5.1 | 4.1Note * |
| Dexterity | 4.1 | 7.1Note * | 4.3 | 6.1Note * | 1.5 | 2.1 | 3.5 | 5.3Note * |
| Learning | 6.7 | 7.6 | 6.5 | 6.7 | 2.7 | 3.1 | 3.8 | 3.7 |
| Memory | 4.1 | 6.4Note * | 4.5 | 4.7 | 2.0 | 2.7 | 3.4 | 3.8 |
| Developmental | 2.5 | 1.9 | 1.8 | 1.3 | 0.9Note E: Use with caution | 0.6Note E: Use with caution | 1.3 | 0.7Note * |
| Unknown | 0.5 | 0.5 | 1.0 | 0.8 | 0.7 | 0.4Note E: Use with caution | 0.6 | 0.5 |
E use with caution
Sources: Statistics Canada, Aboriginal Peoples Survey, 2017; Canadian Survey on Disability, 2017. |
||||||||
Disability rates across provinces and territories were similarly distributed among First Nations people living off reserve and Métis
As per the 2016 Census, the majority of First Nations people and Métis lived in Ontario and the Western provinces (Statistics Canada, 2017a). Rates of disability differed by province and territory among First Nations people living off reserve, Métis and non-Indigenous people. In particular, First Nations people living off reserve and Métis, had higher rates of disability in Nova Scotia, New Brunswick, Ontario, British Columbia and Alberta (Table 4).
Among non-Indigenous people, the disability rate was highest in Nova Scotia, with similar rates across other provinces and territories aside for Quebec and Nunavut (Table 4). Previous research has shown lower rates of disability among those in Quebec (Burlock, 2017) while lower rates in Nunavut may reflect a younger population.
| Province or territory | Indigenous identity | ||
|---|---|---|---|
| First Nations people living off reserve | Métis | Non-Indigenous people | |
| percent | |||
| Newfoundland and Labrador | 24.8 | 20.1Note E: Use with caution | 23.2 |
| Prince Edward Island | Note F: too unreliable to be published | Note F: too unreliable to be published | 25.7 |
| Nova Scotia | 45.0 | 35.1 | 30.2 |
| New Brunswick | 37.5Note E: Use with caution | 36.7 | 26.4 |
| Quebec | 28.1 | 27.5 | 16.0 |
| Ontario | 36.7 | 36.2 | 23.5 |
| Manitoba | 29.9 | 26.9 | 24.0 |
| Saskatchewan | 22.6 | 24.1 | 23.4 |
| Alberta | 31.1 | 28.6 | 21.2 |
| British Columbia | 34.1 | 30.9 | 24.0 |
| Yukon | 22.3 | 27.4Note E: Use with caution | 24.8 |
| Northwest Territories | 20.9 | 23.3 | 19.6 |
| Nunavut | Note F: too unreliable to be published | Note F: too unreliable to be published | 16.1 |
|
E use with caution F too unreliable to be published Sources: Statistics Canada, Aboriginal Peoples Survey, 2017; Canadian Survey on Disability, 2017. |
|||
First Nations people living off reserve aged 15 to 24 and Métis aged 25 to 39, with disabilities, were less likely to live in rural areas
Indigenous peoples are increasingly likely to live in urban centres (Norris & Clatworthy, 2011). This trend is characterized by mobility within urban areas and between urban, rural, and reserve areas (Norris & Clatworthy, 2011). The reasons underlying this mobility are not well understood, but for some mobility to urban centers is motivated by the need for services and supports that are not readily available in on-reserve communities or remote areas (King et al., 2009). For some, this could result in living in collective dwellings (such as long term care facilities) which could render some people with more severe disabilities out of scope for this study (Durst, 2006).
Disability rates were higher in urban centres within younger populations and higher in rural areas within older populations. This was generally true for First Nations people living off reserve, Métis and non-Indigenous people (Table 5)Note .
| Age group | Indigenous identity | |||||
|---|---|---|---|---|---|---|
| First Nations people living off reserve | Métis | Non-Indigenous people | ||||
| Rural | Urban (reference category) | Rural | Urban (reference category) | Rural | Urban (reference category) | |
| percent | ||||||
| 15 to 24 years | 11.4Note * | 18.1 | 12.8 | 17.8 | 6.8Note * | 8.6 |
| 25 to 39 years | 18.9 | 22.6 | 11.9Note * | 21.7 | 11.2Note * | 16.8 |
| 40 to 54 years | 37.4 | 32.0 | 30.3 | 28.2 | 22.0 | 22.3 |
| 55 years and older | 32.2 | 27.1 | 44.8Note * | 32.1 | 59.8Note * | 52.2 |
Sources: Statistics Canada, Aboriginal Peoples Survey, 2017; Canadian Survey on Disability, 2017. |
||||||
Disability rates among Inuit were lower in Inuit Nunangat than outside
About 75% of Inuit live in Inuit Nunangat, the Inuit homeland in Canada (Statistics Canada, 2017b), which consists of four regions: Nunatsiavut (northern coastal Labrador), Nunavik (northern Quebec), the Territory of Nunavut and the Inuvialuit Region (northern Northwest Territories). The largest proportion of Inuit reside in Nunavut (46%) followed by Nunavik (18%), the Inuvialuit Region (5%), and Nunatsiavut (4%), and 27% of Inuit live outside Inuit Nunangat (Statistics Canada, 2017d).
Disability prevalence among Inuit was higher for those living outside (27%) versus inside Inuit Nunangat (16%) (Table 6). This was true for both Inuit women and men. The lower disability rate inside the Inuit homeland might be explained by many factors including barriers to health care and limited access to health-related information in Inuit Nunangat (Carriere, Tjepkema, Pennock, & Goedhuis, 2012; Ellsworth & O'Keeffe, 2013) and/or migration outside Inuit Nunangat for long-term health care services and supports (Liddy et al., 2017).
Within Inuit Nunangat regions, disability was highest in Nunatsiavut (21%)Note and lowest in Nunavik (12%) (Table 6). Differences between women and men within the specific Inuit Nunangat regions were not statistically significant.
| Inuit Nunangat residence | Both sexes | Men | Women |
|---|---|---|---|
| percent | |||
| Inuit Nunangat (reference category) | 15.5 | 12.7 | 18.1 |
| Inuvialuit region | 17.1 | 15.9 | 18.2 |
| Nunavut | 15.9 | 12.8 | 18.9 |
| Nunavik | 12.4 | 9.8 | 14.7 |
| Nunatsiavut | 21.4 | 19.5 | 23.4 |
| Outside Inuit Nunangat | 26.5Note * | 22.5Note * | 29.4Note * |
|
|||
Discussion/Conclusion
Overall, roughly one in three First Nations people living off reserve and Métis had one or more disabilities, while among Inuit and non-Indigenous people the proportion was roughly one in five. The higher rates of disability among First Nations people living off reserve and Métis aligns with previous estimates of disability among Indigenous peoples (Burlock, 2017). The lower rates among Inuit largely reflects a younger age structure.
Consistent with findings on disability generally (Morris et al., 2018), prevalence increased with age among First Nations people living off reserve, Métis, and Inuit men and women. However, this increase began within younger age groups among off-reserve First Nations men and women, Métis men and Inuit women.
Among all three Indigenous groups, mild disabilities were the most common. Severe and very severe disabilities, however, were more frequent among older age groups.
There were key gender-related differences. Firstly, consistent with previous studies, among all groups, women were more likely to have a disability than men (Burlock, 2017; Morris et al., 2018). Secondly, women were more likely to have pain- and mental health-related disabilities than men across all Indigenous groups, as well as among non-Indigenous people. The high prevalence of chronic pain (Jimenez et al., 2011) and mental health conditions (Nelson & Wilson, 2017) among Indigenous peoples has been linked with social inequalities associated with the social determinants of health stemming from colonialism (King et al., 2009).
There were regional and population centre size differences in disability prevalence. Among First Nations people living off reserve and Métis, higher disability rates were found in Nova Scotia, New Brunswick, Ontario, British Columbia and Alberta. In addition, rates of disability were higher in urban areas within younger First Nations people living off reserve and Métis while they were lower in rural areas within older segments of these populations. For both Inuit men and women, disability prevalence was lower inside, rather than outside, Inuit Nunangat. A number of factors, including migration to access health care (Beulah Beatty & Berdahl, 2011), should be considered when interpreting differences in disability prevalence by region and population centre size.
Furthermore, disability among Indigenous peoples might be higher than the estimates provided here as for a number of reasons. Even within the social model of disability, any tendency to underreport chronic health conditions or impairments that may exist in a population could impact perceptions of limitation and disability. For example, certain health conditions may go under-reported due to cultural bias in diagnostic instruments as well as perceived bias, stereotyping, discrimination, and stigma (Lindblom, 2014). Cultural differences in health perceptions (McGrath, 2006) or experiences of colonization (Fenwick, 2006; Lindblom, 2014) and cultural, geographic, and socioeconomic barriers to health services access, including high quality care (Baron, Riva, & Fletcher, 2019; Gracey & King, 2009), among Indigenous peoples may also play a role in under-reporting and under-assessment (Gullemin, Bombardier, & Beaton, 1993; Hunt, Alonso, & Bucquet, 1991; Julien, Lacasse, Labra, & Asselin, 2018; Lindblom, 2014; Thurston et al., 2014).
These findings, especially higher prevalence rates of disability compared to the non-Indigenous population must be examined within the context of both the significant and complex environmental barriers faced by many Indigenous peoples as well as the larger literature on the social determinants of health which are tied to legislation and social policies that punished cultural preservation, practise and use among Indigenous peoples (Galabuzi, 2004). The International Symposium on the Social Determinants of Indigenous Health, a working group within the World Health Organization’s Commission on the Social Determinants of Health, recognized the destruction of Indigenous peoples’ ties to their land through colonization as an important determinant of health inequities (The Commission on Social the Social Determinants of Health, 2007). In this vein, The United Nations Declaration on the Rights of Indigenous Peoples has identified the need to address the impact of colonization to reduce health inequities (United Nations, 2007).
Data sources, methods and limitations
Data sources
Aboriginal Peoples Survey
The data for the three Indigenous groups are from the 2017 Aboriginal Peoples Survey (APS). The 2017 APS is a voluntary, national survey of First Nations people living off reserve, Métis and Inuit aged 15 years or older. The objectives of the APS are to identify the needs of these Indigenous groups and to inform policy and programs. The APS aims to provide current and relevant data for a variety of stakeholders, including Indigenous organizations, communities, service providers, researchers, governments, and the general public. The 2017 APS was developed by Statistics Canada with funding provided by Indigenous Services Canada, Crown-Indigenous Relations and Northern Affairs Canada, Health Canada, and Employment and Social Development Canada.
The APS is a post-censal survey, designed to follow and complement the Census of Population. The 2017 APS represents the fifth cycle of the survey and follows the thematic approach that was first introduced in the 2012 APS. The focus for the 2017 APS is on participation in the Canadian economy, transferable skills, practical training, and use of information technology. It also collected unique and detailed information on education, health, languages, society and community. In 2017, the Disability Screening Questions (DSQ) were added to the APS.
The survey population was comprised of Canadians aged 15 years and older as of the date of the 2016 Census of the Population (May 10, 2016) who were living in private dwellings. It excludes those living in institutions, on Canadian Armed Forces bases, on First Nations reserves and in certain First Nations communities in the Yukon and Northwest Territories, and those living in other collective dwellings. As the institutionalized population is excluded, the data, particularly for the older age groups, should be interpreted accordingly.
The sample for the survey was derived from a sampling frame of individuals who answered "Yes" to one of the three Census questions defining the identity population (questions 18, 20 and 21) or those who reported Aboriginal ancestry to question 17 on the Census. Although not part of the 2017 APS target population, some individuals with Aboriginal ancestry who did not report Aboriginal identity were still sampled, since past survey experience indicates that nearly one-third of these individuals will report an Aboriginal identity on the APS. Therefore, unlike the target population, the sampled population (or survey population) was composed of both the identity population and the Aboriginal ancestry-only population.
The 2017 APS was conducted from January through August, 2017. The overall response rate was 76%. More information on the APS is available on the APS survey description page and in the Concepts and Methods Guide.
Canadian Survey on Disability
The data for the non-Indigenous population are from the Canadian Survey on Disability (CSD), a post-censal and voluntary survey, where data were collected directly from survey respondents, although proxy interviews were allowed in some cases. Since 2012, the CSD is Canada’s main source of data on disabilities for those aged 15 years and older. The CSD provides data on persons with disabilities for each province and territory in Canada. The survey also collects information on disability types and severity, supports for persons with disabilities, their employment profiles, income, education, and other disability-specific information. The CSD uses Canada’s new Disability Screening Questions (DSQ).
The survey population was comprised of Canadians aged 15 years and older as of the date of the 2016 Census of the Population (May 10, 2016) who were living in private dwellings. It excludes those living in institutions, on Canadian Armed Forces bases, on First Nations reserves and those living in other collective dwellings. As the institutionalized population is excluded, the data, particularly for the older age groups, should be interpreted accordingly.
The target population for the CSD was those who reported on the CSD that they were limited in their daily activities due to a disability. Additional details of the survey are available on the CSD survey description page and in the Concepts and Methods Guide. The 2017 CSD was conducted from March through August, 2017. The overall response rate was 69.5%.
Comparability
While both the APS and CSD used the DSQ to identify individuals with a disability on the survey itself, the sampling frame for the two surveys differed. The APS specifically targets First Nations people living off reserve, Métis and Inuit in Canada. Since the APS has a much larger sample of Aboriginal peoples than the CSD, and the APS sample is considered more representative of the Aboriginal population, the APS is the official source of disability rates for Indigenous persons. The CSD relies on filter questions contained on the Census long form to build a sampling frame from a population of individuals most likely to have a disability. To ensure that the APS rates are comparable to those of the CSD, the CSD methodology was applied to the APS: anyone in the APS sample who did not report having a difficulty or long-term condition on the Activities of Daily Living questions on the 2016 Census of Population were considered not to have a disability, regardless of their answers to the DSQ on the APS (for more information on the CSD methodology, refer to the 2017 CSD Concepts and Methods Guide).
While efforts were made to ensure comparability, a number of factors could have an impact on the measurement of disability between the two surveys. Firstly, the placement of the DSQ differed, which could contribute to response bias. For instance, on the APS the DSQ was asked after health-related questions which could contribute to a priming effect that may not be the case for the CSD where the DSQ was asked at the beginning of the survey.
Additionally, since it focused on a population with disabilities, the CSD had particularities with respect to accommodating respondents with specific disabilities. For instance, people with hearing difficulties and who completed the 2016 Census online were sent a link to self-complete the CSD online, whereas others were given phone calls by interviewers. A page in Braille was included with the package containing the CSD survey letter/brochure to provide information to the visually impaired. In completing the APS, the above noted supports were not provided. Another key difference between survey administration processes is that the 2017 APS relied on CATI (Computer-Assisted Telephone Interview) and CAPI (Computer-Assisted Person Interview), with no online component as was the case for the CSD. For more for more information on the CSD and APS methodologies, refer to the 2017 CSD and APS Concepts and Methods Guides.
Methods
The population of study for the analysis were people who identified as First Nations, Métis or Inuit and were over 15 years and older on the APS. The data presented represent single Indigenous identity responses. An additional population of study is the non-Indigenous population, aged 15 years and older, derived from the CSD.
Weighted estimates were calculated using methods that took into account the survey design of the APS and CSD. Statistically significant differences between two estimates were identified using confidence intervals at the 95% level.
Estimates with higher sampling error (coefficient of variation greater than 33.3%) were presented with an ‘F’, indicating that the data were considered too unreliable to be published, while estimates suppressed due to low unweighted frequencies were also indicated with the symbol ‘F’. Estimates with a coefficient of variation between 16.6% and 33.3% were presented with an ‘E’ and should be used with caution.
Multivariate logistic regression analysis
Multivariate regression analysis provides the ability to examine the association between variables of interest, while holding constant other variables. This allows us to better isolate the unique relationships of these variables with disability within a given population.
For each Indigenous group, a logistic regression was conducted to predict the probability of having a disability based on a number of demographic characteristics—sex, age, province/territory/Inuit region, and population centre size. Based on these models, the predicted probability of having a disability was calculated, with all variables in the model held at the weighted population mean values for that Indigenous group (e.g., the proportion of men and women, mean age, weighted distribution across provinces/territories/Inuit region). For First Nations people living off reserve and Métis, the weighted distribution across provinces/territories was used; for Inuit, the weighted distribution across regions of Inuit Nunangat (as well as a category for “outside Inuit Nunangat”) was used instead. A parallel model for non-Indigenous people was then run, using equivalent variables from the CSD, and predicted probabilities were similarly calculated from this model as well. The population mean values for each Indigenous group, in turn, were used. In other words, the predicted disability rate among the non-Indigenous population was calculated, as though this population had the demographic characteristics of First Nations people living off reserve; then similarly for Métis and Inuit. This provides a comparison of the disability rate for non-Indigenous persons with each of the three Indigenous groups, after accounting for the selected demographic characteristics.
Predicted probabilities for each model are referenced in Textbox 2 and presented in the Appendix.
Limitations
The results of this analysis should be interpreted in the context of a number of methodological and conceptual limitations.
The target populations for the APS and CSD differed, as did the positioning of the DSQ instrument on both surveys; on the CSD, the DSQ occurred at the start of the survey, while on the APS it appeared further into the survey during the section on health. These differences may contribute to sampling and response biases. In this vein, the DSQ has not been validated in some Indigenous populations such as those residing in the North, and as such the measure could contain questions that are culturally biased or that operate differently among some Indigenous groups. An additional sampling bias may have come from the mode of collection described in the ‘Comparability’ section, where respondents with certain disability types were specially accommodated for the CSD but not for the APS.
Additionally, the survey population excludes those living in institutions and in other collective dwellings, in correctional facilities, on Canadian Armed Forces bases, on First Nations reserves, and those experiencing precarious housing or homelessness. Disability rates could be higher in some of these locations. For example, a study found that Indigenous people are heavily overrepresented in homeless shelters, and homelessness is associated with increased risk of poor health and, in particular, mental health issues (Anderson & Collins, 2014). Additionally, Indigenous people are also known to be overrepresented in the federal correctional system, and this is particularly the case among Indigenous youth who made up nearly half of admissions to correctional services in 2016/2017 (Malakieh, 2018). Indigenous inmates have often faced complex challenges including mental health issues, a history of time spent in the child welfare system, or having been a residential school survivor (McKay, 2018). As the institutionalized population is excluded, the data, particularly for the older age groups, should be interpreted accordingly.
Due to the cross-sectional nature of the data no cause-and-effect relationships or directionality can be inferred. Further, data limitations restrict specific populations of focus (e.g., children, 2SLGBTQQIA people) and limit the exploration of important factors that intersect with disability such as poverty, gender identity, and trauma tied to colonization. Not only could these patterns tend to remove individuals from the scope of a household survey, but they are also associated with increasing risk of developing disabilities. It is possible that those most likely to be missing from household surveys may also be those most likely to have a disability. The disability rate presented here could be impacted by such factors.
Appendix
Predicted probabilities of having a disability by sex and age among First Nations people living off reserve, Métis and Inuit
As noted in Textbox 2, to account for differences in demographic characteristics of the three Indigenous groups in comparison to non-Indigenous peoples, predicted probabilities were calculated to help identify the extent to which differences in disability rates are influenced by factors such as age, sex, geography and population centre size. In accordance with Table 1, predicted disability rates by age and sex are presented among the three Indigenous groups and the non-Indigenous population.
First Nations women and men living off reserve had higher predicted disability rates than non-Indigenous women and men across all age groups
Both First Nations men and women living off reserve had higher predicted disability rates than non-Indigenous men and women at all age groups, even after controlling for the selected demographic characteristics (Chart A1). The difference was much larger between First Nations women living off reserve and non-Indigenous women, compared to the difference between First Nations men living off reserve and non-Indigenous men. Among First Nations men and women, living off reserve, aged 55 and over, the predicted rates were much closer to those of their non-Indigenous counterparts.
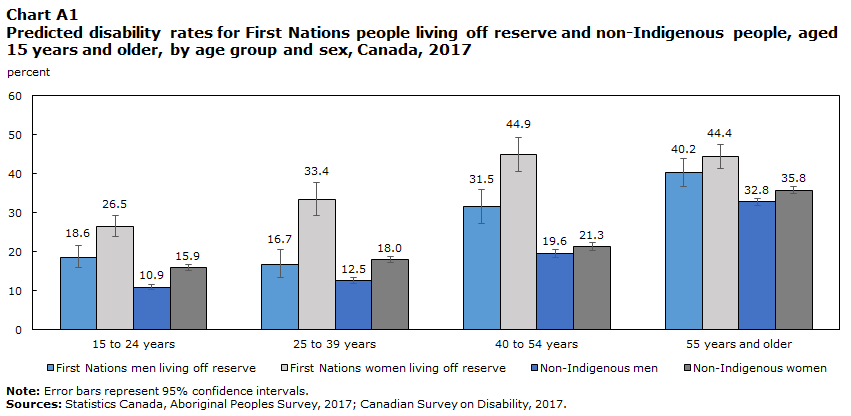
Data table for Chart A1
| 15 to 24 years | 25 to 39 years | 40 to 54 years | 55 years and older | |||||||||
|---|---|---|---|---|---|---|---|---|---|---|---|---|
| 95% confidence interval | 95% confidence interval | 95% confidence interval | 95% confidence interval | |||||||||
| Probabilities | percent | Lower | Upper | percent | Lower | Upper | percent | Lower | Upper | percent | Lower | Upper |
| First Nations men living off reserve | 18.6 | 2.7 | 3.1 | 16.7 | 3.3 | 3.9 | 31.5 | 4.2 | 4.5 | 40.2 | 3.6 | 3.7 |
| First Nations women living off reserve | 26.5 | 2.7 | 2.9 | 33.4 | 4.1 | 4.4 | 44.9 | 4.3 | 4.3 | 44.4 | 3.0 | 3.0 |
| Non-Indigenous men | 10.9 | 0.6 | 0.7 | 12.5 | 0.7 | 0.8 | 19.6 | 1.0 | 1.0 | 32.8 | 0.9 | 0.9 |
| Non-Indigenous women | 15.9 | 0.8 | 0.8 | 18.0 | 0.8 | 0.8 | 21.3 | 1.0 | 1.1 | 35.8 | 0.8 | 0.8 |
|
Note: Error bars represent 95% confidence intervals. Sources: Statistics Canada, Aboriginal Peoples Survey, 2017; Canadian Survey on Disability, 2017. |
||||||||||||
Higher predicted disability rates among Métis women and men in comparison with non-Indigenous women and men narrowed with age
Both younger Métis men and women had higher predicted disability rates than their non-Indigenous counterparts, after controlling for the selected demographic characteristics, although the difference among women was much greater (Chart A2). However, these differences between Métis and non-Indigenous people narrowed with age.
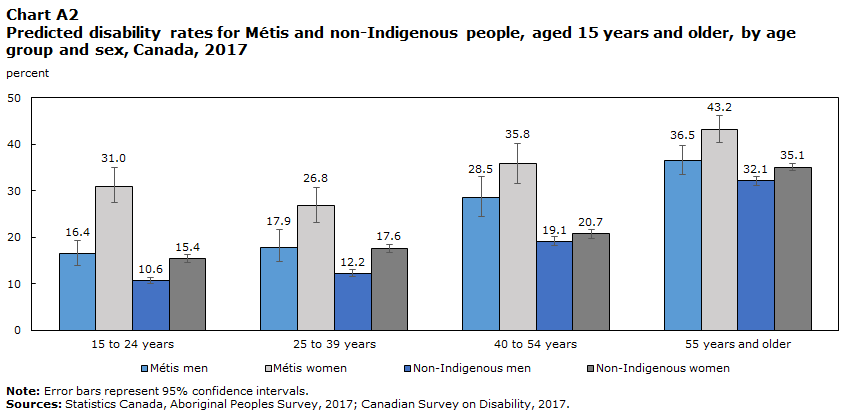
Data table for Chart A2
| 15 to 24 years | 25 to 39 years | 40 to 54 years | 55 years and older | |||||||||
|---|---|---|---|---|---|---|---|---|---|---|---|---|
| 95% confidence interval | 95% confidence interval | 95% confidence interval | 95% confidence interval | |||||||||
| Probabilities | percent | Lower | Upper | percent | Lower | Upper | percent | Lower | Upper | percent | Lower | Upper |
| Métis men | 16.4 | 2.5 | 2.9 | 17.9 | 3.2 | 3.7 | 28.5 | 4.1 | 4.5 | 36.5 | 3.1 | 3.2 |
| Métis women | 31.0 | 3.6 | 3.9 | 26.8 | 3.7 | 4.0 | 35.8 | 4.2 | 4.4 | 43.2 | 2.9 | 2.9 |
| Non-Indigenous men | 10.6 | 0.6 | 0.7 | 12.2 | 0.7 | 0.8 | 19.1 | 0.9 | 1.0 | 32.1 | 0.9 | 0.9 |
| Non-Indigenous women | 15.4 | 0.8 | 0.8 | 17.6 | 0.8 | 0.8 | 20.7 | 1.0 | 1.0 | 35.1 | 0.8 | 0.8 |
|
Note: Error bars represent 95% confidence intervals. Sources: Statistics Canada, Aboriginal Peoples Survey, 2017; Canadian Survey on Disability, 2017. |
||||||||||||
Predicted disability rates were similar among younger Inuit and non-Indigenous women and men while rates increased among older Inuit women and men
Within the Inuit population, predicted disability rates for younger Inuit women and men were not statistically different than those for the non-Indigenous population (Chart A3). However, the predicted rates of disability showed a larger increase for older Inuit; the predicted rate reached 35% for Inuit men and 36% for Inuit women aged 55 years and older, higher than that of non-Indigenous men (23%) and women (26%) in the same age group after accounting for the selected demographic characteristics.Note

Data table for Chart A3
| 15 to 24 years | 25 to 39 years | 40 to 54 years | 55 years and older | |||||||||
|---|---|---|---|---|---|---|---|---|---|---|---|---|
| 95% confidence interval | 95% confidence interval | 95% confidence interval | 95% confidence interval | |||||||||
| Probabilities | percent | Lower | Upper | percent | Lower | Upper | percent | Lower | Upper | percent | Lower | Upper |
| Inuit men | 9.1 | 2.3 | 3.0 | 11.1 | 3.4 | 4.7 | 15.0 | 4.7 | 6.4 | 35.1 | 4.2 | 4.5 |
| Inuit women | 13.2 | 2.4 | 2.9 | 18.9 | 4.1 | 5.0 | 21.8 | 4.3 | 5.0 | 36.1 | 4.7 | 5.0 |
| Non-Indigenous men | 7.2 | 2.3 | 3.4 | 8.2 | 2.6 | 3.8 | 13.3 | 4.2 | 5.7 | 23.3 | 6.6 | 8.2 |
| Non-Indigenous women | 10.6 | 3.4 | 4.7 | 12.1 | 3.8 | 5.2 | 14.5 | 4.5 | 6.1 | 25.8 | 7.2 | 8.7 |
|
Note: Error bars represent 95% confidence intervals. Sources: Statistics Canada, Aboriginal Peoples Survey, 2017; Canadian Survey on Disability, 2017. |
||||||||||||
References
Anderson, J. T., & Collins, D. (2014). Prevalence and causes of urban homelessness among Indigenous peoples: A three-country scoping review. Housing Studies, 29(7), 959-976.
Arim, R. (2012). A profile of persons with disabilities among Canadians aged 15 years or older, 2012. (89-654-X). Ottawa, ON: Statistics Canada.
Baron, M., Riva, M., & Fletcher, C. (2019). The social determinants of healthy ageing in the Canadian Arctic. International journal of Circumpolar Health, 78(1). doi: 10.1080/22423982.2019.1630234
Beulah Beatty, B., & Berdahl, L. (2011). Health care and Aboriginal seniors in urban Canada: Helping a neglected class. The International Indigenous Policy Journal, 2(1).
Burlock, A. (2017). Women with disabilities. (89-503-X). Ottawa, ON: Statistics Canada.
Carriere, G., Tjepkema, M., Pennock, J., & Goedhuis, N. (2012). Cancer patterns in Inuit Nunangat: 1998-2007. International journal of Circumpolar Health, 71. doi: 10.3402/ijch.v71i0.18581
Casey, R. (2015). Disability and unmet health care needs in Canada: A longitudinal analysis. Disability and Health Journal, 8, 173-181.
Davy, C., Harfield, S., McArthur, A., Munn, Z., & Brown, A. (2016). Access to primary health care services for Indigenous peoples: A framework synthesis. International Journal for Equity in Health, 15(163), 1-9.
Durst, D. (2006). Urban Aboriginal families of children with disabilities: Social inclusion or exclusion. Saskatchewan: National Association of Friendship Centres.
Ellsworth, L., & O'Keeffe, A. (2013). Circumpolar Inuit health systems. International journal of Circumpolar Health, 72. doi: 10.3402/ijch.v72i0.21402
Fenwick, C. (2006). Assessing pain across the cultural gap: Central Australian Indigenous peoples' pain assessment. Contemporary Nurse, 22(2), 218-227.
Firestone, M., Tyndall, M., & Fischer, B. (2015). Substance use and related harms among Aboriginal people in Canada: A comprehensive review. Journal of Health Care for the Poor and Underserved, 26(4).
Galabuzi, G. (2004). Social exclusion. In D. Raphael (Ed.), Social Determinants of Health: Canadian Perspectives (pp. 235-352). Toronto, Ontario: Canadian Scholars' Press Inc.
Government of Canada. (2019). Accessible Canada Act. Government of Canada Retrieved from https://laws.justice.gc.ca/PDF/A-0.6.pdf.
Gracey, M., & King, M. (2009). Indigenous health part 1: Determinants and disease patterns. Lancet, 374, 65-75.
Gullemin, F., Bombardier, C., & Beaton, D. (1993). Cross-cultural adaptation of health-related quality of life measures: Literature review and proposed guidelines. Journal of Clinical Epidemiology, 46, 1417-1432.
Hunt, S. M., Alonso, J., & Bucquet, D. (1991). Cross-cultural adaptation of health measures. European group for health management and quality of life assessment. Health Policy, 19(33-44).
Jimenez, N., Garroutte, E., Kundu, A., Morales, L., & Buchwald, D. (2011). A review of the experience, epidemiology, and management of pain among American Indian, Alaska Native, and Aboriginal Canadian peoples. Journal of Pain, 12, 511-522. doi: 10.1016/j.jpain.2010.12.002
Julien, N., Lacasse, A., Labra, O., & Asselin, H. (2018). Review of chronic non-cancer pain research among Aboriginal people in Canada. International Journal for Quality in Health Care, 30(3), 178-185. doi: 10.1093/intqhc/mzx195
King, M., Smith, A., & Gracey, M. (2009). Indigenous health part 2: the underlying causes of the health gap. The Lancet, 374(9683), 76-85.
Liddy, C., McKellips, F., Armstrong, C. D., Afkham, A., & Fraser-Roberts, L. (2017). Improving access to specialists in remote communities: a cross-sectional study and cost analysis of the use of eConsult in Nunavut. International journal of Circumpolar Health, 76, 1-8.
Lindblom, A. (2014). Under-detection of autism among First Nations children in British Columbia, Canada. Disability & Society, 29(8), 1248-1259.
Malakieh, J. (2018). Adult and youth correctional statistics in Canada, 2016/2017. (85-002-X). Ottawa, ON.
McGrath, P. (2006). "The biggest worry...": Research findings on pain management for Aboriginal peoples in Northern Territory, Australia. Rural and Remote Health, 6(3), 549-563.
McKay, J. (2018). Indigenous people in the federal correctional system. Report of the Standing Committee on Public Safety and National Security. Ottawa: House of Commons Canada.
McKenzie, H., Varcoe, C., Browne, A., & Day, L. (2016). Disrupting the continuities among Residential Schools, the Sixties Scoop, and child welfare: An analysis of colonial and neocolonial discourses. International Indigenous Policy Journal, 7(2). doi: 10.18584/iipj.2016.7.2.4
Morris, S., Fawcett, G., Brisebois, L., & Hughes, J. (2018). A demographic, employment and income profile of Canadians with disabilities aged 15 years and over, 2017. (89-654-X2018002). Ottawa: Statistics Canada.
Nelson, S., & Wilson, K. (2017). The mental health of Indigenous peoples in Canada: A critical review of research. Social Science & Medicine, 176 (March), 93-112.
Norris, M., & Clatworthy, S. (2011). Urbanization and migration patterns of Aboriginal populations in Canada: A half-century in review (1951-2006). Aboriginal Policy Studies, 1(1), 13-77.
Statistics Canada. (2016). 2016 Census of Population. (98-400-X2016008). Ottawa, Ontario: Statistics Canada.
Statistics Canada. (2017a). Aboriginal peoples in Canada: Key results from the 2016 Census. (11-001-X). Ottawa, Ontario: Statistics Canada Retrieved from https://www150.statcan.gc.ca/n1/daily-quotidien/171025/dq171025a-eng.htm?indid=14430-1&indgeo=3.
Statistics Canada. (2017b). The Aboriginal population in Canada, 2016 Census of population. (11-627-M). Ottawa, Ontario: Statistics Canada.
Statistics Canada. (2017c). Focus on Geography Series, 2016 Census. (98-404-X2016001). Ottawa, Ontario: Statistics Canada.
Statistics Canada. (2017d). Inuit population by residence inside or outside Inuit Nunangat, 2016. Ottawa, Ontario: Statistics Canada.
Statistics Canada. (2018). First Nations people, Métis and Inuit in Canada: Diverse and growing populations. (89-659-x2018001). Ottawa, Ontario: Statistics Canada.
The Commission on Social the Social Determinants of Health. (2007). Social determinants and Indigenous health: The international experience and its policy implications. Adelaide, Australia: The Commission on Social the Social Determinants of Health.
Thurston, W. E., Coupal, S., Jones, C. A., Crowshoe, L. F., Marshall, D. A., Homik, J., & Barnabe, C. (2014). Discordant Indigenous and provider frames explain challenges in improving access to arthritis care: A qualitative study using constructivist grounded theory International Journal of Equity Health, 13-46. doi: 10.1186/1475-9276-13-46
Truth and Reconciliation Commission of Canada. (2018). Our Mandate. Retrieved May 30, 2018.
United Nations. (2007). United Nations declaration on the rights of Indigenous peoples (pp. 1-29). Geneva: United Nations
Wilson, K., & Young, T. K. (2008). An overview of Aboriginal health research in the social sciences: Current trends and future directions. International journal of Circumpolar Health, 67, 179-189.
- Date modified: