
Aboriginal Peoples Survey, 2017
Labour Market Experiences of Métis: Key findings from the 2017 Aboriginal Peoples Survey

Archived Content
Information identified as archived is provided for reference, research or recordkeeping purposes. It is not subject to the Government of Canada Web Standards and has not been altered or updated since it was archived. Please "contact us" to request a format other than those available.
Correction Notice
Data Table descriptions for chart 3, entitled ‘Barriers to employment reported by unemployed Métis men and women’ was corrected to remove asterisk from reference group. Data Table descriptions for chart 5, entitled ‘What unemployed Métis aged 15 or older reported would help them most to find a job in 2017’ was corrected to match data presented in chart. Similarly, Data Table descriptions for chart 6, entitled ‘Main reason Métis aged 15 or older were not in the labour force despite wanting to work in 2017’ was corrected to match the data presented in chart 6.
In all three cases the corrections were made to the chart data tables in order to match the charts themselves, which remain unchanged.
Skip to text
Text begins
Start of text boxThe 2017 Aboriginal Peoples Survey (APS) marks the fifth cycle of this national survey of Métis, Inuit, and First Nations people living off reserve, aged 15 years or older. In 2017, the survey focused on participation in the economy. The APS provides data on a wide-range of topics including labour, education, language, housing and health to inform policy and programming activities aimed at improving the well-being of First Nations people living off reserve, Métis, and Inuit. It is a valuable source of information for Indigenous organizations, communities, service providers, researchers, governments, and the general public.
The following are findings for people who self-identified as Métis. Also available are Labour Market Experiences of Inuit: Key results from the 2017 Aboriginal Peoples Survey (Catalogue no. 89-653-x2018004) and Labour Market Experiences of First Nations people living off reserve: Key results from the 2017 Aboriginal Peoples Survey (Catalogue no. 89-653-x2018003).
Building partnerships
Meaningful engagement and relationship building are highly valued at Statistics Canada. We are working to strengthen lines of communication with First Nations, Métis and Inuit communities through our Aboriginal Liaison Advisors (ALAs). This network of eleven advisors across the country works with communities and organizations to increase the understanding of, and access to, Statistic Canada products and services, as well as promote the use of these data sources for decision-making and community-planning activities.
A number of Indigenous organizations and people have played a key role in either the development or testing of the survey over the five cycles of the APS. New content for the 2017 APS questionnaire was extensively tested with First Nations, Métis and Inuit respondents before it was finalized. Indigenous people were hired as interviewers and guides during data collection. As well, various National Indigenous Organizations worked with Statistics Canada to promote participation in the APS, and to review analytical findings.
Statistical capacity building
Statistics Canada is supporting Indigenous Statistical Capacity Initiative, grounded in the needs of First Nations people, Métis and Inuit and aimed at providing expanded services and working together to build statistical capacity through training, engagement, and outreach.
For the first time, the APS included the question: “Do you have a card or certificate issued by a Métis organization that identifies you as Métis?”
Statistics Canada consulted with Métis organizations to develop this question. It is designed to provide more information about the characteristics of those who had completed the application and registration processes for acquiring a card or certificate from Métis organizations and governments.
Nationally, about 45% of those who self-identified as Métis reported having a card or certificate issued by a Métis organization.
Employment
Start of text boxSix in ten (60% or 275,270 individuals) self-identified Métis aged 15 or older were employed in 2016
A higher percentage of men than women (62% versus 59%) were employed in 2016.
Employment varied with age, with 75% of core working age Métis, 52% of young Métis, and 39% of older Métis being employed in 2016.
Employment rates varied with level of education, and were higher among Métis with a university degree (79%) than among those with a high school diploma (64%) or those with less than a high school diploma (36%).
The Métis have made gains in high school and postsecondary completion. In 2016, 46% of Métis aged 15 and over had completed a postsecondary certificate diploma or degree, up from 40% in 2006. The percentage with less than a high school diploma dropped from 34% in 2006 to 25% in 2016.
| Province or territory | Percent |
|---|---|
| Canada | 60 |
| Newfoundland and Labrador | 49 |
| Prince Edward Island | 62 |
| Nova Scotia | 58 |
| New Brunswick | 52 |
| Quebec | 55 |
| Ontario | 60 |
| Manitoba | 63 |
| Saskatchewan | 62 |
| Alberta | 62 |
| British Columbia | 62 |
| Yukon | 68 |
| Northwest Territories | 68 |
| Nunavut | 85 |
| Source: Statistics Canada, 2016 Census of Population. | |
Three age groups are used in this booklet:
The ‘younger/young adults’ are those aged 15 to 24.
The ‘core working age adults’ are those aged 25 to 54, as individuals in this age group are more likely to have completed school and be available for full-time work than those aged 15 to 24, and less likely to have entered retirement than those 55 or older.
The ‘older adults’ are those aged 55 or older.
Six in ten (63%) core working age Métis were preparing for their retirement on their own or through an employer pension plan.
Most employed Métis worked a permanent job in 2017
In 2017, 85% of employed Métis worked a permanent job. Of the 15% that did not work a permanent job; 4% worked a seasonal job, 6% worked a temporary, term or contract job, 4% worked a casual job, and 1% worked a job that was in some other way non-permanent.
About 8% of employed Métis worked multiple jobs at the same time
Women were more likely to work multiple jobs (10%) than men (6%).
Around one in ten (13%) of core working age Métis had moved for job-related reasons in the past 5 years
The share of core working age Métis who moved for job-related reasons in the past 5 years was higher in British Columbia (19%), than in both Manitoba (7%) and Ontario (10%).
Self-employment
In 2017, around one in seven (14%) employed Métis were self-employed
Employed Métis men were more likely to be self-employed (16%) than employed Métis women (11%).
| Province or territory | Percent |
|---|---|
| Atlantic Canada | 11Note E: Use with caution |
| Quebec | 16 |
| Ontario | 13 |
| Manitoba | 8 |
| Saskatchewan | 13 |
| Alberta | 15 |
| British Columbia | 18 |
| Northwest Territories | 8 |
|
E use with caution Source: Statistics Canada, Aboriginal Peoples Survey, 2017. |
|
Under half of self-employed Métis owned an incorporated business, although this varied across Canada
While 43% of self-employed Métis owned an incorporated business, this share was higher among men (50%) than women (32%). Regionally, the share ranged from over 56% of those in Alberta compared to 22%E in Manitoba.
A third of self-employed Métis had hired employees
Nationally, 32% of self-employed Métis had employees. Among the provinces and territories, this ranged from 50% of self-employed Métis in Atlantic Canada to 21% of self-employed Métis in Quebec.
Freedom or independence the leading reason for choosing self-employment (37%)
Other reasons included flexible hours (8%E), the nature of the job (8%E), and the possibility of greater income (8%E).
Most (91%) self-employed Métis did not receive outside assistance for their business
Under one-tenth (9%) of self-employed Métis said they received outside assistance for their business. Of those that did receive assistance, leading sources of assistance were private sector banks and other private institutions (29%E), provincial or municipal governments (28%E) or the federal government (27%E).
Start of text boxOutside business assistance includes: financial assistance, procurement programs, information on business opportunities, help establishing business contracts, and training/development programs.
Part-Time Employment
One in five (19%) employed Métis worked part-time (less than 30 hours per week at their main job)
Women were more likely to work part-time than men (27% versus 12%). Young Métis were more likely to work part-time (40%) than older Métis (22%), who in turn were more likely than core working age Métis (12%).

Data table for Chart 1
| Reason for working part-time | Percent |
|---|---|
| Going to school | 28 |
| Involuntary part-time | 26 |
| Own preference | 15 |
| Other reasons | 13 |
| Caring for own children | 7 |
| Own illness or disability | 6Note E: Use with caution |
| Other personal or family responsibilities | 3Note E: Use with caution |
| Semi-retired | 2Note E: Use with caution |
|
E use with caution Source: Statistics Canada, Aboriginal Peoples Survey, 2017. |
|
Attending school was the leading reason for working part-time among young Métis
Two-thirds (66%) of young Métis who worked part-time did so because they were attending school. This compared with 7%E of core working age Métis. The percentage of young Métis who worked part-time because they were attending school ranged from 77% in British Columbia to 54% in Alberta.
Data table for Chart 2
| Province | Percent |
|---|---|
| Atlantic Canada | 64 |
| Quebec | 73 |
| Ontario | 64 |
| Manitoba | 67 |
| Saskatchewan | 64 |
| Alberta | 54 |
| British Columbia | 77 |
| Source: Statistics Canada, Aboriginal Peoples Survey, 2017. | |
Caring for children was a common reason for working part-time among Métis women
Over one-fifth (22%) of core working age Métis women who worked part-time reported doing so because they were caring for their children.
For one in four (26%) Métis working part-time, part-time work was not a choice
Involuntary part-time work was particularly prevalent among older Métis women. In 2017, 36% of older Métis women working part-time did so involuntarily compared to 21% of younger Métis women and 26% of core-working age women.
Start of text boxInvoluntary part-time workers are those who work part-time because they are:
a) Not able to find work with more than 30 hours per week, or
b) Not being offered more than 30 hours per week due to economic or business conditions.
Other Labour Activities
About six in ten (59%) self-identified Métis aged 15 years or older participated in other labour activities during the last year
A larger share of Métis in rural areas compared to large urban population centresNote 1 had participated in these activities (72% versus 50%).
Only 4% of Métis aged 15 or older reported doing these activities for money or to supplement their income in 2017.
Métis who were unemployed in the labour market (7%) were more likely to do other labour activities for income than those who were employed (4%) or otherwise not in the labour force (5%).
| Province or territory | Hunted, fished or trapped | Gathered wild plants | Made clothes or footwear | Made carvings, drawings, jewellery or other kinds of artwork |
|---|---|---|---|---|
| percent | ||||
| Atlantic Canada | 44 | 42 | 6Note E: Use with caution | 26 |
| Quebec | 42 | 27 | 5 | 20 |
| Ontario | 38 | 26 | 9 | 26 |
| Manitoba | 37 | 24 | 7 | 19 |
| Saskatchewan | 41 | 29 | 7 | 20 |
| Alberta | 27 | 21 | 8 | 25 |
| British Columbia | 27 | 28 | 9 | 26 |
| Yukon | 57 | 62 | 22Note E: Use with caution | 25Note E: Use with caution |
| Northwest Territories | 47 | 33 | 10 | 18 |
|
E use with caution Source: Statistics Canada, Aboriginal Peoples Survey, 2017. |
||||
There are other labour activities that can contribute to economic well-being that may not be captured with conventional measures. The APS asks about: hunting, fishing and trapping, gathering wild plants, making clothing or footwear and making carvings, jewellery and other kinds of artwork.
End of text box
Hunting, fishing and trapping
- Over one third (35%) of Métis said they hunted, fished or trapped in the past year.
- Men were more likely to report hunting, fishing or trapping than women (47% versus 25%).
- These activities were also more common among Métis residing in rural areas than among of those residing in large urban population centres (50% versus 24%).
- About 1% did these activities for income or to supplement their income.
Gathering wild plants, for example berries, rice or sweet grass
- Over a quarter (27%) of Métis gathered wild plants in the past year
- Gathering wild plants was more common in rural areas than large urban centres (39% versus 19%)
- About 1% of Métis gathered wild plants for income or to supplement their income.
Making clothing or footwear
- Almost one in ten (8%) Métis made clothing or footwear in the past year.
- Making clothes or footwear was more common among women (13%) than men (2%)
- About 1% did so for income or to supplement income.
Making carvings, drawings, jewellery or other kinds of artwork
- About a quarter (24%) of Métis made carvings, drawings, jewellery or other kinds of art in the past year
- These activities were more common among women than men (30% versus 17%)
- About 2% of Métis did these activities for income or to supplement income.
Most Métis (73%) helped out in their community at least once per month during the past 12 months
About one third (29%) of Métis 15 years or older volunteered with a group or organization at least once per month. While two-thirds (68%) of Métis 15 years of age or older reported helping people out on their own, not on behalf of an organization. For example, caring for someone’s home, driving someone to an appointment, visiting the elderly, shovelling snow or unpaid babysitting.
Unemployment
Start of text boxIn 2016, the unemployment rate among self-identified Métis was 11% (34,710 individuals)
The unemployment rates was higher among Métis men than Métis women (13% versus 10%). Unemployment rates were higher among young Métis (17%) than core working age Métis (10%) or older Métis (11%).
Unemployment rates for Métis ranged from 9% in the Northwest Territories and 9% in Manitoba to 15% in Atlantic Canada and 13% in Alberta.
Unemployment rates varied with level of education, and were lower among Métis with a university degree (6%) than among those with a high school diploma (12%) or those with less than a high school diploma (19%).
Barriers to employment
Data table for Chart 3
| Barriers to employment | Men (reference group) | Women |
|---|---|---|
| percent | ||
| A shortage of jobs | 61 | 58 |
| Not having the education | 48 | 45 |
| Not having the work experience | 37 | 49Note * |
| Not having the means of transportation | 25 | 29 |
| Not knowing the type of job one wanted | 22 | 23 |
| Other | 20 | 24 |
| Not knowing where to look for work | 17 | 15Note E: Use with caution |
E use with caution
|
||
A shortage of jobs was the most commonly experienced barrier to employment
A shortage of jobs was reported by a larger percentage of unemployed Métis in Atlantic Canada (85%), Saskatchewan (76%) and Alberta (74%) compared to Quebec (33%E) and Manitoba (40%E).
Métis women were more likely than men to report that not having enough work experience had made it difficult to find work
A larger share of unemployed Métis women (49%) than Métis men (37%) said that not having the work experience required for available jobs had made it difficult to find work.
Challenges experienced by young Métis differed from other age groups
Young Métis were less likely to report that a shortage of jobs made it difficult to find work (46%) than core working age Métis (69%) or older Métis (71%).
About one-half of young Métis reported not having the work experience required for available jobs (53%), compared to over one-third (37%) of core working age Métis, and a quarter (26%E) of older Métis.
Over a third (35%) of younger Métis reported that not having the means of transportation to get to available jobs caused them difficulty in finding work. They were more likely to report this than core working age Métis (22%E) and older Métis (17%E).
What would help?
Data table for Chart 4
| What would help most to find work | Percent |
|---|---|
| More jobs/work available | 21 |
| Other | 20 |
| More education (academic) | 16 |
| Skills training (e.g., computer, language, writing, skilled trades, etc.) | 14 |
| Transportation | 8Note E: Use with caution |
| Work experience | 8Note E: Use with caution |
| Contacts or networking | 7Note E: Use with caution |
| Job finding clubs | 3Note E: Use with caution |
| Moving to another city/region | 2Note E: Use with caution |
|
E use with caution Source: Statistics Canada, Aboriginal Peoples Survey, 2017. |
|
When asked what would help most to find a job, men and women responded differently
Among unemployed Métis, a higher share of men than women stated that more jobs would help them most in finding work (27% versus 15%E). In contrast, a higher share of Métis women than Métis men said that having more academic education would help most (21%E versus 12%E).
Young Métis reported that work experience would help them most to gain employment
One in six (16%) unemployed Métis aged 15 to 24 reported that work experience would help most to find work.
Method of looking for work
About half (47%) of unemployed Métis used more than one method to look for work
Data table for Chart 5
| Reason for not looking for work | Percent |
|---|---|
| Searched the Internet | 58 |
| Contacted potential employer(s) directly | 49 |
| Through friend(s)/relative(s) | 18 |
| Other | 15 |
| Contacted public employment agency | 14 |
| Placed or answered newspaper ad(s) | 10Note E: Use with caution |
| Community bulletin boards/radio | 7Note E: Use with caution |
| Through co-worker(s) | 5Note E: Use with caution |
|
E use with caution Source: Statistics Canada, Aboriginal Peoples Survey, 2017. |
|
Searching the internet was the top job searching method among unemployed Métis
Métis residing in large population centres were more likely to look for work on the internet (69%) than those in rural areas (48%) or small population centres (46%).
Start of text boxMost (93%) Métis have access to the internet at home
Fewer Métis in rural areas had internet access at home (88%), than those in small (93%), medium (94%), and large population centres (95%). Across Canada, home internet access among Métis was higher in BC (96%), than in Quebec (89%), the Northwest Territories (90%) and Saskatchewan (90%). Access also varied across age groups as 98% of young Métis had internet access, compared to 95% of core working age Métis and 86% of older Métis.
Eighty one percent (81%) of Métis used a smart phone, tablet, or other wireless device to access the internet in the past month
A greater percentage of Métis with a university degree (93%) compared to those with less than a high school diploma (56%), used a mobile device to access the internet in the past month.
| Province or territory | Had access to the internet at home | Accessed internet on wireless device in the past month |
|---|---|---|
| percent | ||
| Atlantic Canada | 93 | 77 |
| Quebec | 89 | 76 |
| Ontario | 93 | 82 |
| Manitoba | 93 | 85 |
| Saskatchewan | 90 | 86 |
| Alberta | 94 | 86 |
| British Columbia | 96 | 83 |
| Yukon | 89 | 82 |
| Northwest Territories | 90 | 83 |
| Source: Statistics Canada, Aboriginal Peoples Survey, 2017. | ||
Métis women were more likely to search for work through their social networks of friends or family than men
About one in five (22%E) Métis women and 14% of Métis men reported looking for work through friends and family.
Young Métis were half as likely to have contacted a public employment agency as their older counterparts
Nine percent (9%E) of young Métis contacted a public employment agency to find work, compared to 18% of those ages 25 or older.
Not in the Labour Force
Start of text boxIndividuals can be out of the labour force for a number of reasons including: being retired, caring for children/other family members, going to school, having a chronic illness or disability, or being a discouraged worker (those who want employment and are available to work but are not seeking work because they believe they cannot find suitable work).
End of text box
Start of text boxAmong Métis aged 15 or older, about a third (32% or 146,580 individuals) were not in the labour force in 2016
This share was higher among Métis women (35%) than Métis men (29%). By age group, 37% of young Métis, 18% of core working age Métis and 57% of older Métis were not in the labour force. Regionally, the share of Métis not in the labour force ranged from 38% in Quebec to 25% in the Territories.
Main reason
Of Métis that were not in the labour force in 2017, 18% wanted to work in the previous week
About a third (32%) of young adults and about a third (30%) of core working age adults who were not in the labour force wanted to work in the previous week, while 8% of older Métis did.

Data table for Chart 6
| Reason for not looking for work | Percent |
|---|---|
| Own illness or disability | 37 |
| Other reasons | 21 |
| Going to school | 16 |
| Believed no work available | 8Note E: Use with caution |
| Caring for own children | 7Note E: Use with caution |
| Waiting for recall/reply | 6Note E: Use with caution |
| Other personal or family responsibilities | 6Note E: Use with caution |
|
E use with caution Source: Statistics Canada, Aboriginal Peoples Survey, 2017. |
|
Illness or disability was the most common reason for not looking for work (37%) despite wanting to work
Among those who wanted to work but were not in the labour force, illness or disability was a more common reason for not looking for work among older Métis (49%) and core working age adults (44%) than their younger counterparts (15%E).
Further, illness or disability as the reason for not looking for work ranged from 52% of Métis in Ontario to 20%E in Saskatchewan.
Going to school was the primary reason young Métis were not in the labour force despite wanting to work
Forty-five percent (45%) of young Métis said “going to school” was the reason they did not look for work compared to 16% of all Métis.
Caring for children a key reason for not being in the labour force despite wanting to work among Métis women
Among women, 15%E cited caring for own children as the reason they were not looking for work despite wanting to work, including a quarter (25%E) of core working age Métis women.
Start of text boxDisability screening questions have been added to the 2017 APS, allowing for a deeper understanding of how disabilities impact the lives of Métis
What would help?
About a third (30%) of self-identified Métis who were not in the labour force expected to look for work within the next 12 months
Over three-quarters (79%) of young Métis, 41% of core working age Métis, and 10% of older Métis who were out of the labour force expected to look for work in the next 12 months.

Data table for Chart 7
| What would help to find work | Population |
|---|---|
| More education (academic) | 27 |
| Skills training | 21 |
| More Jobs | 20 |
| Work experience | 16 |
| Other | 16 |
| Better health | 16 |
| Résumé writing skills | 14 |
| Contacts/networking | 13 |
| Transportation | 12 |
| Child care assistance | 7Note E: Use with caution |
| Job finding clubs | 7Note E: Use with caution |
| Moving to another city/region | 5Note E: Use with caution |
| Help in starting a business | 4Note E: Use with caution |
|
E use with caution Source: Statistics Canada, Aboriginal Peoples Survey, 2017. |
|
A larger share of women than men said more education would help them find work
About a third (31%) of Métis women and a fifth (22%) of Métis men who planned on looking for work in the next 12 months stated that more education would help them find employment.
Core working age Métis women reported that child care assistance would help them find work
Around a quarter (23%E) of core working age Métis women who planned on looking for work in the next 12 months reported that childcare assistance would help them find work.
Young Métis were more likely to say work experience and resume writing skills would help them find work
A larger share of young Métis who planned on looking for work in the next 12 months reported that work experience would help them find work than core working age Métis (26% versus 9%E). Similarly, young Métis were more likely to report that résumé writing skills would be helpful than core working age Métis (22% versus 7%E).
Skills and training
Men were more likely to state that their reading and writing skills limited their job prospects
Métis men were more likely than women to state that their writing skills limited their job opportunities (23% versus 14%). The same can be said for reading skills, with men more likely to report this than women (16% versus 11%).
Older adults more likely to report that their computer skills limited their job prospects, whereas young adults more likely to report that their ability to work with numbers limited job prospects
Computer skills were seen as limiting by almost half (45%) of older Métis, over a third (36%) of core working age Métis, and about a quarter (24%) of young Métis. In contrast, young Métis were more likely to perceive their ability to work with numbers as limiting job prospects (28%) than both core working age Métis (22%) or older Métis (17%).
Data table for Chart 8
| Skill | Labour Force Status | Percent very limiting | Percent somewhat limiting |
|---|---|---|---|
| percent | |||
| Computer skills | Employed | 8 | 23 |
| Unemployed | 16 | 24 | |
| Not in Labour Force |
20 | 27 | |
| Writing skills | Employed | 3 | 11 |
| Unemployed | 7Note E: Use with caution | 18 | |
| Not in Labour Force |
14 | 19 | |
| Numeracy skills | Employed | 4 | 15 |
| Unemployed | 7 | 23 | |
| Not in Labour Force |
14 | 24 | |
|
E use with caution Source: Statistics Canada, Aboriginal Peoples Survey, 2017. |
|||
Four in ten (40%) Métis took courses, workshops, seminars, or training to develop their job skills in the past 12 months
Of those Métis who took courses, workshops, and other training, most (82%) took job-specific training (e.g., professional training, equipment, occupational health and safety).
Among Métis that did not take part in any such training in the past year, 26% wanted to take courses, workshops, seminars, or training to develop their job skills
Most Métis who wanted to take training wanted job-specific training (62%). The most common barriers that prevented them from taking training to develop their job skills were expense (49%), being too busy to take training (45%), and family responsibilities (41%).
The Aboriginal Peoples Survey and the Census
The Aboriginal Peoples Survey (APS) takes place after each Census of Population. While the Census provides key demographic, social and economic characteristics, the APS is designed to dig deeper to provide more understanding of the experiences, aspirations, and needs of First Nations people living off reserve, Métis and Inuit. Some examples:
Census of Population
- From the census, we get a picture of the characteristics of the employed and unemployed – age, sex, industry, occupation and more.
- From the census, we can get information about how many people have postsecondary qualifications, and their demographic and socioeconomic characteristics.
- From the census, we have information about the number of people who are able to conduct a conversation in an Aboriginal language, how many have an Aboriginal mother tongue, and how many are using Aboriginal languages at home and at work.
Aboriginal Peoples Survey (APS)
- From the APS, we can also learn:
- Levels of job satisfaction
- Access to training and skills development
- Reasons for working part-time
- Over-qualification/Under-qualification
- Reasons for being self-employed
- Assistance/support for business owners
- How looking for work
- Willingness to move for work
- Barriers to finding work and what would help most
- From the APS, we can gain deeper insights:
- Reasons for choosing postsecondary program
- Quality of guidance to select postsecondary programs
- Distance education
- Funding for postsecondary schooling
- Barriers to attending postsecondary schooling
- From the APS, we can learn more about Aboriginal languages:
- Levels of ability
- Ratings of how important it is to speak and understand
- Exposure to Aboriginal languages both inside and outside the home
- How and where Aboriginal languages are learned
These are just a few examples of how the APS adds more detail to the information collected in the Census. Taken together, the Census and APS create a rich source of information about the experiences and socioeconomic conditions of the Indigenous population. Other broader topics explored in the APS include:
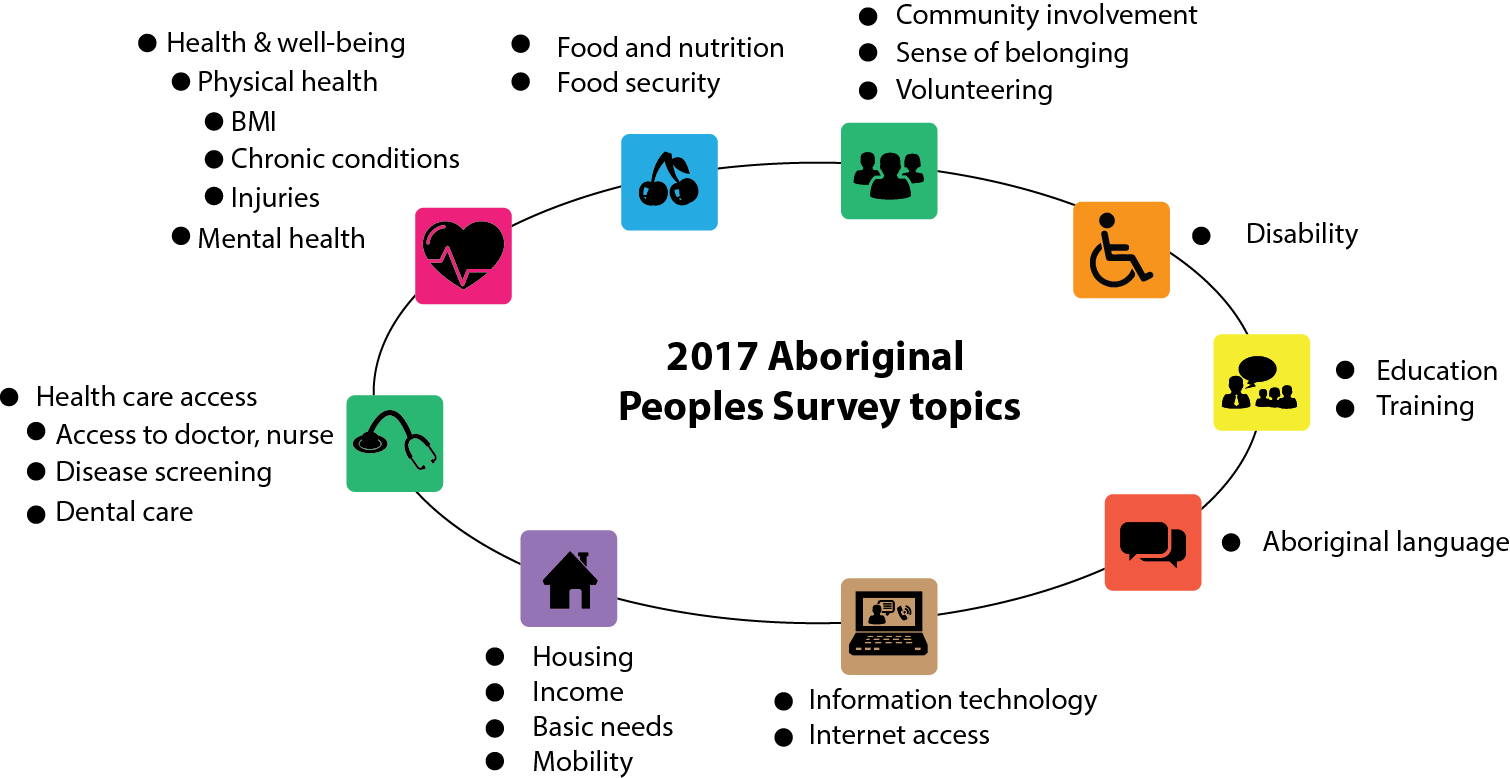
Description for Figure 1
2017 Aboriginal Peoples Survey topics
- Community Involvement
- Sense of belonging
- Volunteering
- Disability
- Education
- Training
- Aboriginal language
- Information technology
- Internet access
- Housing
- Income
- Basic needs
- Mobility
- Health care access
- Access to doctor, nurse
- Disease screening
- Dental care
- Health & wellbeing
- Physical health
- BMI
- Chronic conditions
- Injuries
- Mental health
- Physical health
- Food and nutrition
- Food security
About the 2017 Aboriginal Peoples Survey
Target population:
The 2017 Aboriginal Peoples Survey (APS) is a national survey of the Aboriginal identity population aged 15 years or older as of January 15, 2017, living in private dwellings, excluding people living on Indian reserves and settlements and in certain First Nations communities in Yukon and Northwest Territories. The concept of "Aboriginal identity" refers to those persons who reported identifying with at least one Aboriginal group, namely, First Nations (North American Indian), Métis or Inuit, those who reported being a Status Indian (Registered Indian or Treaty Indian, as defined by the Indian Act of Canada), or those who reported being a member of a First Nation or Indian band.
This is a sample survey with a cross-sectional design. The APS sample was selected from Census of Population respondents who reported an Aboriginal identity or ancestry.
Data collection:
Two computer assisted interview questionnaires were developed for this survey: a Computer Assisted Telephone Interview (CATI) and a Computer Assisted Personal Interview (CAPI). CATI and CAPI allows for more complex questionnaire flows as well as on-line edits which identify any logical inconsistencies so that interviewers can correct these with the assistance of respondents at the time of the interview.
Data collection took place from January 16, 2017 to August 15, 2017. The APS response rate was 76%, yielding a sample of approximately 24,000 Aboriginal respondents. Respondents were interviewed in the official language of their choice. For Inuit regions, the questionnaire was translated into Inuktitut and Inuinnaqtun. These versions were available as HTML files in the CAPI and CATI applications to assist interviewers with potential language barriers in the field.
Data Analysis:
Missing values including “don’t know,” “not stated” and “refusal” were excluded from the denominator when calculating percentages. Two estimates were considered to be significantly different from one another if their 95% confidence intervals did not overlap or p-values for the differences between estimates were greater than 0.05 in chi-square tests. A bootstrapping technique was applied when calculating estimates of variance.
Estimates with coefficients of variation greater than 16.6% but less than or equal to 33.3% should be interpreted with caution. These estimates are presented with an “E” throughout the report. All estimates from this report are based on survey weights that account for the sample design, non-response and known population totals.
- Date modified: