Publications
Aboriginal Peoples Survey, 2012
Labour force characteristics of the Métis: Findings from the 2012 Aboriginal Peoples Survey
Labour force characteristics of the Métis: Findings from the 2012 Aboriginal Peoples Survey
Archived Content
Information identified as archived is provided for reference, research or recordkeeping purposes. It is not subject to the Government of Canada Web Standards and has not been altered or updated since it was archived. Please "contact us" to request a format other than those available.
by Thomas Anderson and Lori Hohban

- Introduction
- Métis were employed at a rate consistent with that of the total population in 2012
- The highest employment rates were in the western provinces
- Industry and occupation
- Average job tenure of Métis
- More than four in five employed Métis held a permanent job
- Unemployment and those not in the labour force
- Reported difficulty finding work and job search methods
- Conclusion
- Definitions
- Appendix A
- Notes
- References
Introduction
Métis are one of three distinct, constitutionally recognized groups of Aboriginal Peoples in Canada (Constitution Act, 1982). In 2011, 451,790 people reported Métis identityNote 1, accounting for 32.3% of the total Aboriginal Identity population and 1.4% of the total population in Canada (National Household Survey, 2011).
The Métis population is young and growing. In 2011, Métis had a median age of 31.4 years compared to a median age of 40.1 years for the total population in Canada (National Household Survey, 2011). The number of people who identified as Métis rose by 16.3% from 2006 to 2011, while the total population rose by 5.7%. Due to this fact and Canada’s aging population, the Métis have great potential to fill job gaps and enlarge the workforce. According to the paper Closing the Gap: Partnering for Métis Labour Market Success:
Canada’s Métis communities represent a significant opportunity for both government and business. They are an emergent consumer market, a skilled and growing workforce and valued customers. The Métis are young, urban, and highly mobile. (Calgary Chamber of Commerce, 2012)
While analyzing the socioeconomic characteristics of Métis constitutes an important area of study, it is important to acknowledge the diversity that exists within the Métis population. There are multiple competing, and sometimes overlapping, conceptualizations of what it means to be Métis, which are interlocked with matters of history, language, group acceptance and geography (Sawchuk, 2001). For some, Métis identity is tied specifically to having an ancestral connection to what the Métis National Council calls “the historic Métis community” (Métis National Council, 2011), which had its origins in the Prairie provinces as well as parts of Ontario, British Columbia, the Northwest Territories and the northern United States (Sawchuk, 2001). For others, Métis identity is more broadly defined, encompassing all persons who identify as Métis (Royal Commission on Aboriginal Peoples, 1996).
Studies that focus on the Métis population’s labour force characteristics are limited, though past research has noted that the employment rate of the Métis has historically been lower than that of the non-Aboriginal population (Ciceri and Scott, 2006). More generally, the recent (2008 to 2011) labour market downturn lasted longer for Aboriginal people than for the non-Aboriginal population (Usalcas, 2011).
To address this knowledge gap, this study presents a descriptive profile of the labour force characteristics of the Métis using data from the 2012 Aboriginal Peoples Survey (APS). Where applicable, and to provide context, APS estimates for the Métis are compared with estimates for the total population from the Labour Force Survey (LFS). Because of methodological differences between the two surveys, however, differences between estimates were not tested for statistical significance.
Data sources, methods and concepts
Aboriginal Peoples Survey and Labour Force Survey
The data sources for this analysis are the 2012 Aboriginal Peoples Survey (APS) and the Labour Force Survey (LFS).
The 2012 APS is a national survey of First Nations people living off-reserve, Métis and Inuit aged 6 years and over as of February 1, 2012. It excludes people living on Indian reserves and settlements and in certain First Nations communities in the Yukon and the Northwest Territories. The survey was conducted from February 6 to July 31, 2012. Its sample of approximately 50,000 respondents was drawn from those who reported Aboriginal identity or ancestry on the 2011 National Household Survey (NHS).
The LFS is a monthly household survey that collects information on labour market activity from Canada’s civilian non-institutionalized, off-reserve population 15 years and over. The sample size is 56,000 households.
For more information about the 2012 APS or the LFS please refer to the Aboriginal Peoples Survey, 2012: Concepts and Methods Guide (Cloutier and Langlet, 2013) and the Guide to the Labour Force Survey 2013 (Statistics Canada, 2013) as listed in the reference section of this paper.
Comparability between surveys
The labour force questions on the 2012 APS are identical to those on the LFS. However, labour force questions are asked of respondents with a specific reference week in mind. For the LFS, the reference week is the calendar week (Sunday through Saturday) covered by the LFS each month—usually the week containing the 15th day of the month. In contrast, the 2012 APS used a floating reference week, which was the most recently completed seven-day period beginning on a Sunday and ending the following Saturday. The APS reference week is, therefore, based on the date of the interview. To provide comparability with the APS, the average of LFS monthly estimates for the same reference period (February to July, 2012) were used.
The LFS and APS estimates in this analysis exclude data for the territories. Thus, references to “national” totals for both the APS and the LFS pertain to the 10 provinces. The term “Prairies” refers to Manitoba, Saskatchewan and Alberta.
Data from the APS and the LFS were not seasonally adjusted. APS responses of “don’t know”, “refusal” and “not stated” were excluded in the calculation of estimatesNote 1, whereas the LFS imputes missing data.
While the labour force questions on the 2012 APS are identical to those on the LFS, estimates between the two surveys were not tested for significance due to methodological differences between the two surveys.
All estimates from both surveys are based on survey weights that account for the sample design, non-response and known population totals. The APS calculates estimates of variance using bootstrap weights; the LFS uses jackknife weights.
For the APS, comparisons of confidence intervals between estimates were used to determine if the difference between them was significant. If the 95% confidence intervals did not overlap, the difference between the two estimates was considered to be significant. This is a conservative approach, as statistical tests of significance can detect differences even in cases when confidence intervals overlap.
Estimates with coefficients of variation greater than 16.6% but less than or equal to 33.3% should be interpreted with caution and are noted with (E). Estimates with coefficients of variation greater than 33.3% were suppressed.
Métis were employed at a rate consistent with that of the total population in 2012
According to the 2001 APS, the employment rate for Métis in the ten provinces was 63.8%; using the 2012 APS, the employment rate was 64.0%.Note 2
Analyzing data taken from the 2012 Labour Force Survey, Métis were employed at a rate that was consistent with the total population in Canada (60.7% and 61.8%, respectively). While the unemployment rate was higher for Métis than the total population (10.3% versus 7.2%); this could be related to the aforementioned youth of the Métis population. Younger labour force participants, those aged 15 to 24 years, are more likely to be unemployed.
The highest employment rates were in the western provinces
According to the 2012 APS, of the 342,530 Métis aged 15 years or over, 219,350 were employed—an employment rate of 64.0%.Note 3,Note 4 According to the LFS, the employment rate for the total population in Canada was 61.9%.Note 5 Chart 1 shows the employment rates for Métis and the total population in Canada by age and sex.
Within the core working age population—persons 25 to 54 years of age—men were more likely to be employed than women (80.9% versus 72.7%). For the total population in Canada, according to the LFS, the same trend was observed, as men had an employment rate of 84.8% compared to an employment rate of 77.4% for women.
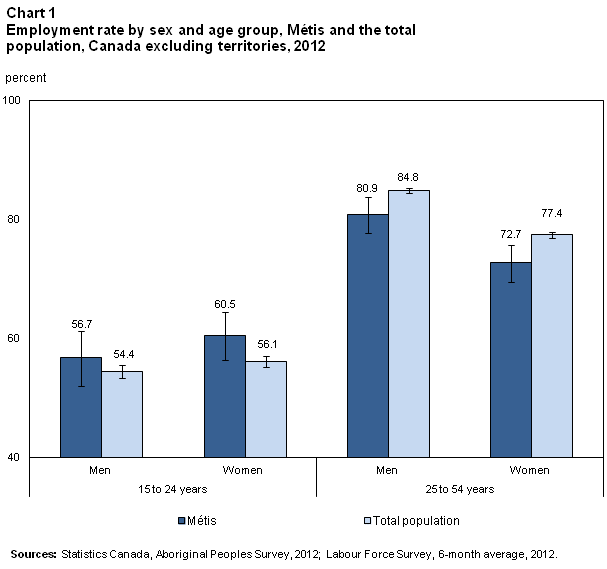
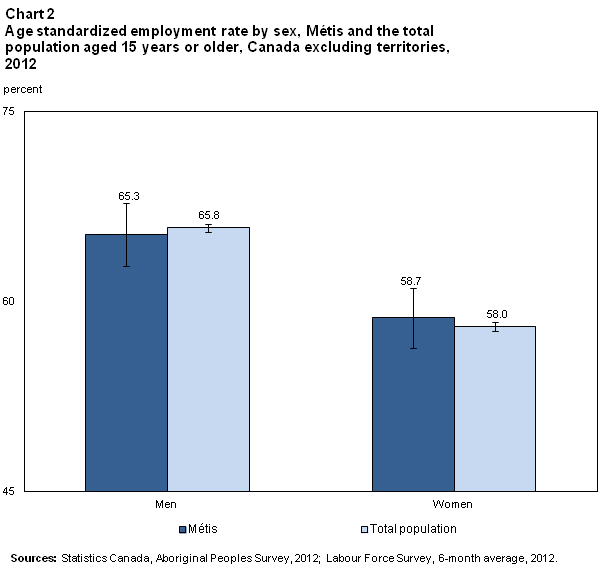
Chart 2 shows the employment rates for Métis and the total population in Canada by sex, after age standardization has been applied.Note 6
Differences in Métis employment rates emerged by region. The economic boom in the Prairie provinces, notably in the energy extraction sector (Marchand, 2011), led to higher overall employment rates and lower unemployment rates, compared with the rest of Canada (Chawla, 2008; Galarneau, 2013; Statistics Canada, 2014).
According to the 2012 APS, Métis in the Prairies were more likely to be employed than those living elsewhere in Canada (67.4% versus 60.8%). Within the Prairies, men had a significantly higher employment rate (72.0%) than women (63.4%). Based on the 2012 LFS, this difference was also apparent for the total population (data not shown).
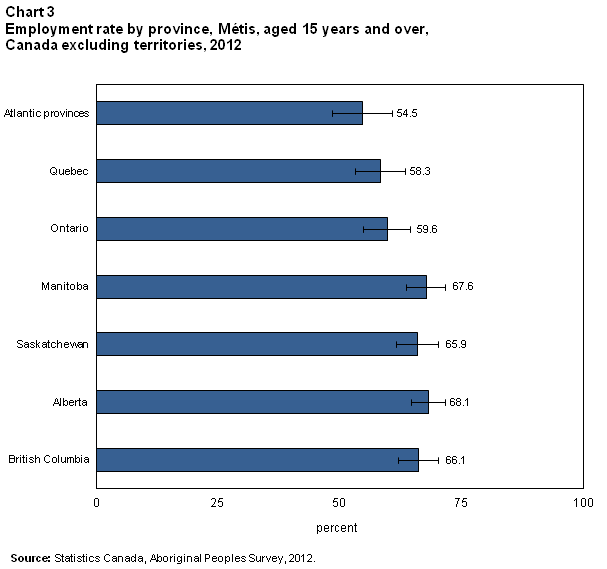
Within the Métis population, the provinces with the highest employment rates were Alberta (68.1%), Manitoba (67.6%), British Columbia (66.1%) and Saskatchewan (65.9%). Chart 3 shows the employment rates of the Métis population by province.
Industry and occupation
The most common industries in which Métis men were employed were construction (17.0%), manufacturing (11.3%), retail trade (8.5%) and transportation and warehousing (8.5%). The most common industries for Métis women were health care and social assistance (22.6%), retail trade (12.7%), educational services (11.2%) and accommodation and food services (10.5%).
The most common occupational group for employed Métis was sales and service occupations. More than 64,000 Métis were employed in sales and service occupations, making up 29.5% of all employed Métis (Chart 4). Trades, transport and equipment operators and related occupations and business, finance and administrative occupations were the next largest occupational categories for Métis, at 18.7% and 16.0% respectively.
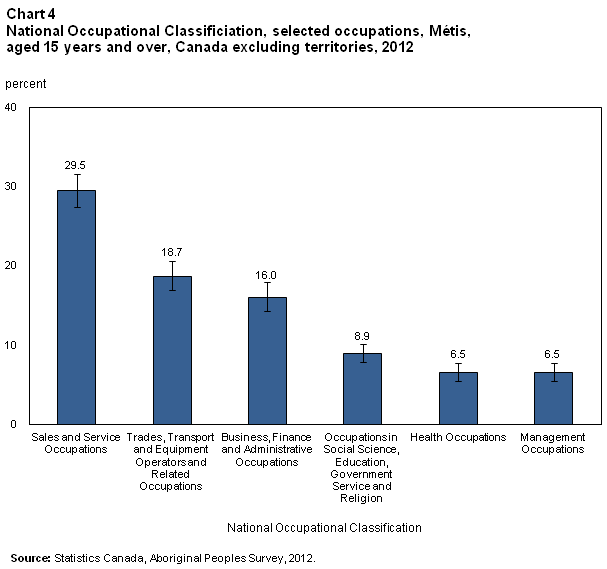
Men were more likely to be employed in trades, transport and equipment operators and related occupations than women (34.7% versus 3.2%E). Men were, however, less likely to be employed in business, finance and administrative occupations than women (7.3% versus 24.4%) and sales and service occupations (22.6% versus 36.2%).
More than half of employed Métis aged 15 to 24 years were employed in sales and service occupations; this was significantly higher than the proportion in the core working age population (52.2% versus 24.0%). Conversely, core working age Métis were more likely to be employed in management occupations (6.7% versus 1.4%E) and natural and applied sciences and related occupations (4.7% versus 1.6%E).
Table 1 shows the distribution of occupations for Métis, standardized to the age distribution of the total population in Canada; the estimates are based upon the 2012 APS and LFS, for each respective population.
| National Occupational Classification | Total population in Canada | Métis | ||
|---|---|---|---|---|
| Men | Women | Men | Women | |
| percent | ||||
| Total employed population | 100.0 | 100.0 | 100.0 | 100.0 |
| Management Occupations | 10.4 | 6.5 | 8.9 | 5.0 |
| Business, Finance and Administrative Occupations | 10.2 | 26.4 | 7.3 | 25.1 |
| Natural and Applied Sciences and Related Occupations | 11.1 | 3.2 | 6.1 | 1.7Note E: Use with caution |
| Health Occupations | 2.4 | 11.6 | 1.8Note E: Use with caution | 11.4 |
| Occupations in Social Science, Education, Government Service and Religion | 5.4 | 13.5 | 5.1 | 13.0 |
| Occupations in Art, Culture, Recreation and Sport | 2.6 | 3.9 | 3.2Note E: Use with caution | 3.6 |
| Sales and Service Occupations | 20.3 | 28.7 | 21.7 | 34.2 |
| Trades, Transport and Equipment Operators and Related Occupations | 26.6 | 2.0 | 34.8 | 3.4Note E: Use with caution |
| Occupations Unique to Primary Industry | 4.7 | 1.3 | 5.5 | Note F: too unreliable to be published |
| Occupations Unique to Processing, Manufacturing and Utilities | 6.3 | 2.8 | 5.6 | 1.3Note E: Use with caution |
|
E use with caution F too unreliable to be published Sources: Statistics Canada, Labour Force Survey, 6 month average, 2012; Aboriginal Peoples Survey, 2012. |
||||
Average job tenure of Métis
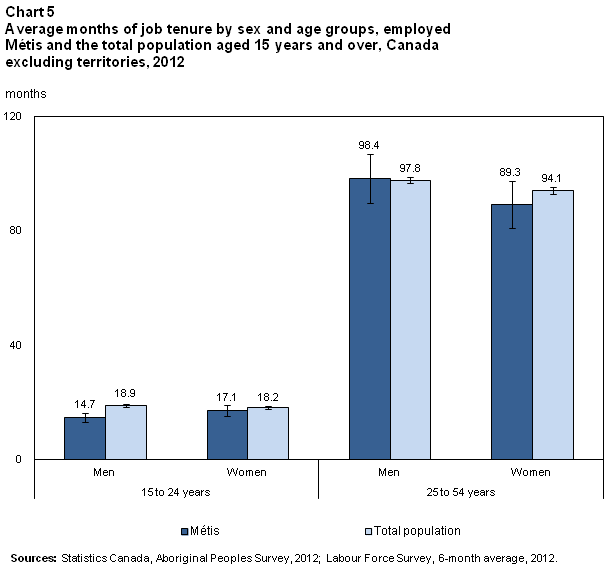
Job tenure refers to the length of time that workers have held their current job. The average job tenure for Métis was 87.2 months—96.9 months for full-time workers and 48.0 months for those who were worked part-time. Chart 5 shows the average job tenure in months for Métis, according to the 2012 APS, and for the total population in Canada, according to the LFS, by age and sex.
More than four in five employed Métis held a permanent job
On the 2012 APS, employed respondents, aged 15 years and over, were asked if their job was permanent, or if there was some way that it was not permanent. More than four in five (84.2%) of Métis who were employed had a permanent job. The proportion was higher among those in the core working age population (88.8%) compared to those aged 15 to 24 years (71.4%).
Close to four in five Métis who were employed worked full-time (79.7%). According to the 2012 APS, the remaining 44,240 (20.3%) who worked part-time were asked to cite the main reason that they usually worked less than 30 hours per week.
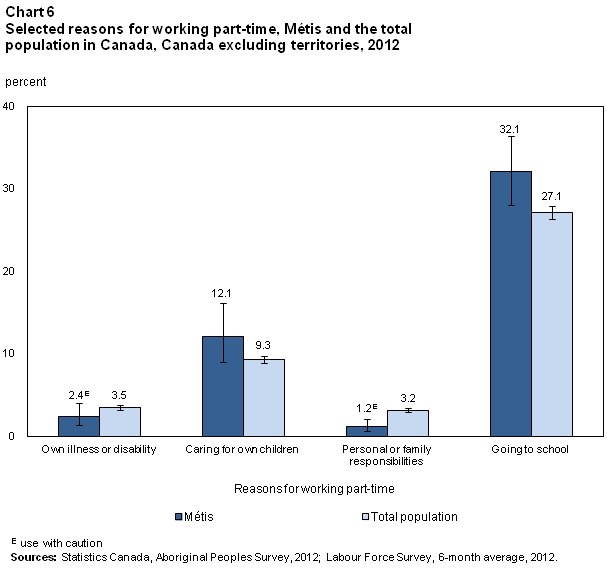
A higher percentage of women than men worked part-time (28.5% versus 11.7%). The most commonly cited reason for working part-time among Métis women was attending school (28.6%), followed by business conditions (17.6%) and caring for own children (16.7%). The two most commonly cited reasons among Métis men was going to school (40.7%) and business conditions (25.6%). Chart 6 shows selected reasons for working part-time for Métis and the total population in Canada.
Unemployment and those not in the labour force
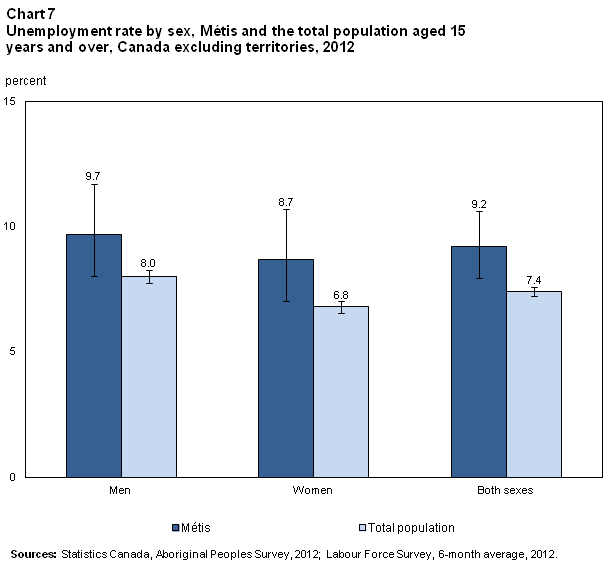
The unemployment rate for the Métis population rose from 7.0% to 9.8% from 2008 to 2010 and was higher than that of the non-Aboriginal population which rose from 5.0% to 6.8% for the same time period (Usalcas, 2011). According to the 2012 APS, Métis had an unemployment rate of 9.2%, which was down from the rate of 12.0%, observed in the 2001 APS.
The unemployment rate of Métis men was 9.7%, while the unemployment rate of Métis women was 8.7%. Chart 7 shows the unemployment rates for Métis and the total population in Canada by sex, in 2012.
The lowest provincial unemployment rates for Métis were in Saskatchewan (6.6%E) and Alberta (7.2%). Conversely, the highest rates were in the Atlantic Provinces (13.1%E), Quebec (12.1%E) and Ontario (11.7%E).
Reported difficulty finding work and job search methods
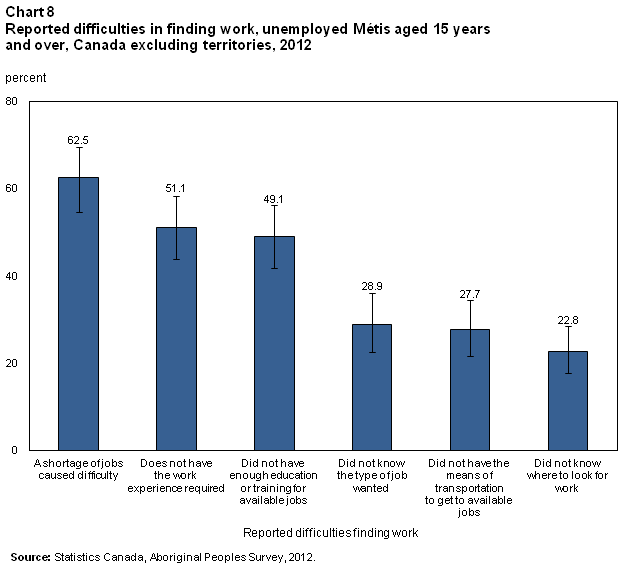
Respondents, who were unemployed, were asked if a number of factors caused them difficulty in finding work. The most commonly reported difficulty for Métis was a shortage of jobs, as just over three in five (62.5%) reported this (chart 8). Just over half (51.1%) reported not having the experience required for available jobs and just under half (49.1%) reported not having enough education or training for available jobs. Uncertainty also posed a difficulty to the job search for unemployed Métis, as 28.9% reported not knowing what type of job was wanted and 22.8% reported not knowing where to look for work. Just over one-quarter of unemployed Métis (27.7%) reported not having the means of transportation to get to available jobs.
The most commonly reported ways that unemployed Métis searched for work was by contacting potential employer(s) directly (58.5%) and by searching the Internet (57.8%). Just over one in five (20.1%) Métis searched for work through friend(s) or relative(s). Another 16.3%E placed or answered a newspaper ad or ads and 15.8%E contacted a public employment agency.
Among the Métis population aged 15 years and over, just under three-in-ten were not in the labour force (29.5%). The majority of those not in the labour force were women (57.9%). The average age of non-labour force participants was 47.2 years, significantly higher than those who were in the labour force (38.2 years).
The 2012 APS asked people who wanted a job, but had not looked for work in the previous week—that is, those that were not in the labour force—their main reason for not seeking employment. An estimated 38.5% of Métis who had not looked for work reported the reason to be an illness or disability; the percentage was significantly higher among those aged 25 to 54 (56.0%) than among 15- to 24-year-olds (9.9%E). For another 21.4%, the main reason for not seeking work was that they were going to school.
Conclusions
In many cases, the same employment trends that are observable in the total population are also found in the Métis population. What differences that do exist can often be explained by the relative youth of the Métis—a sign that could indicate their future emergence and potential within the Canadian labour market.
The labour force characteristics of the Métis differed by province. Métis living in the Prairies were more likely to be employed and less likely to be unemployed, compared with those living elsewhere in Canada. However, these labour force differences most likely reflect the economic realities of each region, not differences between regional groups.
Next steps
This profile is a first step in the analysis of labour market outcomes for the Métis and the social and economic factors with which these outcomes are associated. The 2012 Aboriginal Peoples Survey is the most comprehensive data source for studying the Métis population. An in-depth analysis examining the education and skill-level of Métis would be beneficial, as half of the unemployed population reported job search difficulties relating to a lack of experience and the same proportion reported a lack of education or training. Analyzing the income and health of Métis as it relates to their labour outcomes would also provide greater insight.
Definitions
Aboriginal Identity
Aboriginal identity refers to those persons who reported identifying with at least one Aboriginal group (North American Indian, Métis, and Inuit). For this analysis, the Métis are defined as any respondent who has self identified as Métis, and/or self-identified as Métis in combination with North American Indian or Inuit on the 2011 Aboriginal Peoples Survey.
Employed
Number of persons who, during the reference week, worked for pay or profit, or performed unpaid family work or had a job but were not at work due to own illness or disability, personal or family responsibilities, labour dispute, vacation, or other reason.
Employment rate
The employment rate is the number of persons employed expressed as a percentage of the population 15 years of age and over. The employment rate for a particular group (age, sex, marital status) is the number employed in that group expressed as a percentage of the population for that group.
Job tenure
This refers to the number of months that an employed or self-employed respondent has worked for his or her present employer or business.
Labour Force
This refers to persons who were either employed or unemployed during the reference week.
Participation rate
This refers to the total labour force expressed as a percentage of the population aged 15 years and over. The participation rate for a particular group (for example, women aged 25 years and over) is the labour force in that group expressed as a percentage of the population for that group.
Permanent job
A permanent job is one that is expected to last as long as the employee wants it, given that business conditions permit. That is, there is no pre-determined termination date.
Temporary job
A temporary job has a predetermined end date, or will end as soon as a specified project is completed. Includes seasonal jobs; temporary, term or contract jobs including work done through a temporary help agency; casual jobs; and other temporary work.
Unemployed
These are the number of persons who, during the reference week, were without work, had actively looked for work in the past four weeks, and were available for work. Those persons on layoff or who had a new job to start in four weeks or less are considered unemployed.
Unemployment rate
The unemployment rate is the number of unemployed persons expressed as a percentage of the labour force. The unemployment rate for a particular group (age, sex, marital status) is the number unemployed in that group expressed as a percentage of the labour force for that group.
Appendix A
| Variable | Description | percent |
|---|---|---|
| DLFSTAT | Labour force status | 2.6 |
| DINDG12 | Industry, business or service sector - NAICS 2012 | 4.4 |
| DOCCG06 | Work or occupational category - NOC-S 2006 | 4.5 |
| DJOBTENG | Current job/business - Tenure - Grouped | 11.6 |
| DPJOBST | Job permanency | 5.2 |
| DFTPT | Employment status - Full-time/part-time | 4.2 |
| PT_01 | Work less than 30 hours per week - Main reason | 17.9 |
| LW_03A | Difficulty in finding work - Not knowing where to look | 26.2 |
| LW_03B | Difficulty in finding work - Not knowing type of job wanted | 26.2 |
| LW_03C | Difficulty in finding work - No required work experience | 26.9 |
| LW_03D | Difficulty in finding work - Not enough education/training | 28.1 |
| LW_03E | Difficulty in finding work - No means of transportation | 27.9 |
| LW_03F | Difficulty in finding work - Shortage of jobs | 28.9 |
| LW_03G | Difficulty in finding work - Other | 27.9 |
| LW_01A | Job search method - Directly contacted employer(s) | 27.5 |
| LW_01B | Job search method - Through friend(s)/relative(s) | 27.5 |
| LW_01C | Job search method - Through co-worker(s) | 27.5 |
| LW_01D | Job search method - Newspaper ad(s) | 27.5 |
| LW_01E | Job search method - Community bulletin boards/radio | 27.5 |
| LW_01F | Job search method - Contacted public employment agency | 27.5 |
| LW_01G | Job search method - Contacted Aboriginal org./employment agency | 27.5 |
| LW_01H | Job search method - Referred by another employer | 27.5 |
| LW_01I | Job search method - Searched Internet | 27.5 |
| LW_01J | Job search method - Referred by union | 27.5 |
| LW_01K | Job search method - Other | 27.5 |
| DW_02 | Did not look for work last week - Main reason | 33.4 |
| Source: Statistics Canada, Aboriginal Peoples Survey, 2012. | ||
Notes
References
Bougie, E., Kelly-Scott, K. and Arriagada, P. (2013). The Education and Employment Experiences of the First Nations People Living off Reserve, Inuit, and Métis: Selected Findings from the 2012 Aboriginal Peoples Survey. Statistics Canada Catalogue no. 89-653-X—No. 001. Ottawa.
Calgary Chamber of Commerce. (2012). Closing the Gap: Partnering for Métis Labour Market Success. Calgary.
Capeluck, E. and Sharpe, A. (2013). Labour Market Prospects for the Métis in the Canadian Mining Industry. CSLS Research Report 2013-02. Centre for the Study of Living Standards. Ottawa.
Chawla, R. (2008). "Provincial labour force differences by level of education." Perspectives on Labour and Income. Statistics Canada Catalogue no. 75-001-X. Ottawa.
Ciceri, C. and Scott, K. (2006). "The Determinants of Employment Among Aboriginal Peoples." In Aboriginal Policy Research Series, Volume 3: “Moving Forward, Making a Difference.” Toronto: Thompson Educational Publishing, Inc.
Cloutier, E. and Langlet, E (2013). Aboriginal Peoples Survey, 2012: Concepts and Methods Guide. Statistics Canada Catalogue no. 89-653-X—No. 002. Ottawa.
The Constitution Act (1982). Schedule B to the Canada Act 1982 (UK), 1982, c 11.
Galarneau, D. (2013). Portrait of Canada's Labour Force. National Household Survey, 2011. Statistics Canada Catalogue no. 99-012-X2011002. Ottawa.
Guide to the Labour Force Survey (2013). Statistics Canada Catalogue no. 71-543-G. Ottawa.
Marchand, J. (2012). "Local labor market impacts of energy boom-bust-boom in Western Canada." Journal of Urban Economics, 71(1), 165-174.
Métis National Council website (2013). www.metisnation.ca, Accessed February 11, 2014.
Métis National Council (2011). Métis Registration Guide. Ottawa.
Royal Commission on Aboriginal Peoples (RCAP). (1996). Report of the Royal Commission on Aboriginal Peoples: Perspectives and Realities. Vol. 4. Minister of Supply and Services Canada.
Sawchuk, J. (2001). Negotiating an Identity: Métis Political Organizations, the Canadian Government, and Competing Concepts of Aboriginality. American Indian Quarterly, 25(1), 73-92.
Siggner, A. (2003). "Impact of 'Ethnic Mobility' on Socio-economic Conditions of Aboriginal Peoples." Canadian Studies in Population, 30(1), 137-158.
Statistics Canada. (2013). National Household Survey Focus on Geography Series http://www12.statcan.gc.ca/nhs-enm/2011/as-sa/fogs-spg/Pages/FOG.cfm?lang=E&level=1&GeoCode=01 , Accessed April 8, 2014.
Statistics Canada. (2014). Labour Force Survey, March 2014. http://www.statcan.gc.ca/daily-quotidien/140404/t140404a003-eng.htm Accessed July 14, 2014.
Usalcas, J. (2011). Aboriginal People and the Labour Market: Estimates from the Labour Force Survey, 2008-2010. Statistics Canada Catalogue no. 71-588-X—No. 3. Ottawa.
- Date modified:
