
“Sandwiched” between unpaid care for children and care-dependent adults: A gender-based study
by Dana Wray
Acknowledgements
Funding for this study was provided by Women and Gender Equality Canada. The author thanks Jane Badets, Stacey Wan, Patricia Houle, and Carole Sawaya for their contributions.
Highlights
- In 2022, 42% of Canadians aged 15 years or older provided unpaid care to children under 15 years old or to adults 15 years or older with a long-term condition or disability in the past 12 months.
- 6% of Canadians reported “sandwich caregiving,” or providing unpaid care to both children and care-dependent adults. Women were more likely (7%) than men (5%) to be sandwich caregivers.
- Caregivers were most likely to have multiple care responsibilities for both care-dependent groups in middle adulthood. Sandwich caregiving is most common for those 35-44 years old (29%), followed by those 45-54 years old (20%) and 55-64 years old (18%).
- Most commonly, sandwich caregivers cared for their parents or parents-in-law and own child under 15 (34%), their parents and grandchild under 15 (15%), or their spouse or partner and own child under 15 (8%).
- Nearly half of sandwich caregivers reported that the pandemic in the past 12 months led to a perceived increase in their average caregiving time for children (47%) or adults (46%).
- 86% of sandwich caregivers said that their care responsibilities affected at least one aspect of their health and well-being, compared to 74% of caregivers for only adults and 62% of caregivers for children. The most common impacts were feeling tired, worried or anxious, or overwhelmed.
- Two-thirds of non-retired sandwich caregivers (66%) said that their caregiving responsibilities affected their employment or job-seeking activities in the past 12 months. For example, sandwich caregivers reported having to adjust their schedule, reduce hours, or reduce tasks and responsibilities at work.
- Women caregivers were more likely than men to experience negative impacts on their well-being, especially if they were “sandwiched” between multiple care responsibilities.
Introduction
Care is a pressing issue in Canada, with important consequences for economic issues, societal inequalities, and the well-being of Canadians. Although issues related to needs for care have existed for decades, the COVID-19 pandemic intensified these demands and shone a light on the importance of the care economy for the wellbeing and economic prosperity of Canadians. Indeed, in the past several years, a growing group of researchers, policymakers, and advocates in Canada and internationally have called for more attention to the care economy.
According to a proposed definition by Statistics Canada, the care economy is that sector of the broader economy comprising the provision of paid and unpaid care work involved in meeting the physical, psychological, and emotional needs of children (under 15 years old) and care-dependent adults or youth (15 years or older) with long-term conditions or disabilities (Statistics Canada, 2022b; Wray et al., 2023).Note
The care economy is a central issue that is growing in importance. In 2022, about 15 million Canadians 15 or older provided unpaid or paid care to care-dependent groups in the past 12 months (Statistics Canada, 2022b). The need for care in Canada is likely to increase due to population aging and longer life expectancies (Statistics Canada, 2022a), putting pressure on not only paid health care and social care services, but also on the family and friends who provide a large part of unpaid care.
Unpaid care work is a critical part of the overall care economy. In 2022, 4 in 10 Canadians provided unpaid care to children or care-dependent adults in the past 12 months (Statistics Canada, 2022b). A recent study estimates the economic contribution of caregivers for those with long-term conditions, disabilities, or problems related to aging at $97.1 billion in 2018 (Fast et al., 2023).
Yet, this unpaid caregiving is often invisible and devalued, as well as unevenly distributed. Providing care is a gendered phenomenon. Women in Canada provide more unpaid care than men and they report more negative impacts of their caregiving responsibilities on their well-being (Moyser & Burlock, 2018; Sinha, 2012; Statistics Canada 2022b, 2023).
However, to fully understand the unpaid domain of the care economy and its impacts on Canadians, it is critical to consider all types of unpaid caregivers. Taking this perspective also sheds light on an often-overlooked group of caregivers: those who provide care to both adults and children at the same time. Due to a combination of demographic trends such as population aging and delayed fertility, some Canadians may be “sandwiched” between caregiving needs of dual care-dependent groups. As past studies generally look at care to care-dependent adults or children separately (e.g., Sinha, 2012; Moyser & Burlock, 2018), primarily due to data limitations, little is known about sandwich caregiving.
This study uses data collected in 2022 from the Canadian Social Survey (CSS) Wave 6 (Well-being and caregiving) to explore unpaid caregiving for care-dependent adults and children in Canada, including being “sandwiched” between multiple responsibilities for different care-dependent groups. The CSS Wave 6 is the only survey at Statistics Canada that asks about both unpaid care to children under age 15 as well as care-dependent adults in the past 12 months, providing a comprehensive look at unpaid caregiving. This study addresses three key research questions on unpaid caregiving in Canada in 2022. First, who provides unpaid care in Canada? Second, how much unpaid care is provided and to whom? Third, what are the impacts of providing unpaid care on caregivers?
Results I: Who provides unpaid care in Canada?
42% of Canadians provided unpaid care in the past 12 months to children under 15 years old or to adults and youth 15 years or older with a long-term condition or disability
For the first time, the Canadian Social Survey (Wave 6 – Well-being and caregiving) asked about Canadians’ unpaid caregiving responsibilities in the last twelve months for both care-dependent adults and care-dependent children (see: Data sources, definitions, and methods). Respondents were asked whether, in the past 12 months, they had cared for, helped, or looked after either someone 1) under the age of 15 years old (including their own children) or 2) over the age of 15 years old who had a long-term condition, disability, or problem related to aging, without any explicit monetary compensation.
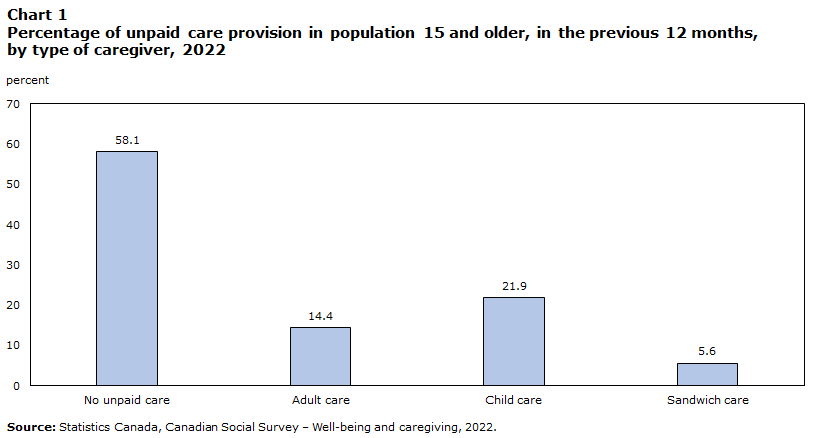
Data table for Chart 1
| Percent | 95% confidence intervals | ||
|---|---|---|---|
| lower bound | upper bound | ||
| No unpaid care | 58.1 | 56.8 | 59.3 |
| Adult care | 14.4 | 13.6 | 15.3 |
| Child care | 21.9 | 20.9 | 23.0 |
| Sandwich care | 5.6 | 5.0 | 6.2 |
| Source: Statistics Canada, Canadian Social Survey – Well-being and caregiving, 2022. | |||
In 2022, 4 in 10 Canadians aged 15 or older (42% or 13.4 million) provided unpaid care to either care-dependent adults or children in the past 12 months (Chart 1). About 6.4 million (20%) Canadians reported caring for care-dependent adults and 8.8 million (28%) provided unpaid care to care-dependent children.
Most data on care considers caregiving for either adults or children separately – but does not examine the intersection of the two. 6% of Canadians 15 or older reported “sandwich caregiving,” or providing unpaid care to both care-dependent adults and children in the past 12 months (see: Data source, definitions, and methods). As a result, nearly 1.8 million Canadians over 15 years old were “sandwiched” between multiple care responsibilities for both care-dependent adults and children in the past 12 months. When looking at unpaid caregivers specifically, 13% provided sandwich care, while 52% provided care only to children and 35% only to care-dependent adults.
Who are the caregivers for care-dependent groups in Canada?
The responsibilities of care are not evenly distributed among Canadians. Past research consistently shows that care for children and care for adults is provided disproportionately by women (Moyser & Burlock, 2018; Sinha, 2012). Less is known, however, about sandwich carers in Canada (see Williams, 2004 for an exception).
Women (44%) were more likely than men (40%) to report having provided unpaid care in the past 12 months (Table 1).Note However, there was no gender differences in caring for only care-dependent adults or only children. Instead, this difference was driven by sandwich caregiving: 7% of women, compared to 5% of men, provided care to both care-dependent adults and children in the past 12 months.
| No unpaid care | Care to adults only | Care to children only | Sandwich care | |||||||||
|---|---|---|---|---|---|---|---|---|---|---|---|---|
| % | 95% confidence intervals | % | 95% confidence intervals | % | 95% confidence intervals | % | 95% confidence intervals | |||||
| lower bound | upper bound | lower bound | upper bound | lower bound | upper bound | lower bound | upper bound | |||||
| Gender Table 1 Note 1 | ||||||||||||
| Men+ (ref.) | 60.3 | 58.4 | 62.2 | 14.2 | 12.9 | 15.5 | 21.1 | 19.5 | 22.7 | 4.5 | 3.8 | 5.3 |
| Women+ | 55.9 | 54.0 | 57.7 | 14.7 | 13.5 | 16.0 | 22.8 | 21.3 | 24.3 | 6.6 | 5.8 | 7.6 |
| Marital status | ||||||||||||
| Married (ref.) | 46.9 | 45.2 | 48.7 | 15.6 | 14.4 | 17.0 | 30.2 | 28.5 | 31.9 | 7.3 | 6.4 | 8.2 |
| Common-law | 57.0Note * | 53.1 | 60.8 | 13.4 | 11.2 | 16.0 | 23.1Note * | 20.0 | 26.4 | 6.5 | 5.0 | 8.5 |
| Never married | 73.9Note * | 71.0 | 76.6 | 12.3Note * | 10.5 | 14.4 | 11.1Note * | 9.1 | 13.3 | 2.8Note * | 2.0 | 3.8 |
| Divorced/ Separated/ Widowed | 66.2Note * | 63.3 | 68.9 | 15.6 | 13.7 | 17.7 | 13.9Note * | 12.0 | 16.1 | 4.3Note * | 3.2 | 5.9 |
| Own child less than 15 years old in household Table 1 Note 2 | ||||||||||||
| Yes | 26.4Note * | 23.8 | 29.2 | 2.5Note * | 1.8 | 3.6 | 58.8Note * | 55.8 | 61.7 | 12.3Note * | 10.6 | 14.2 |
| No (ref.) | 65.9 | 64.3 | 67.4 | 18.4 | 17.3 | 19.7 | 11.8 | 10.8 | 12.8 | 3.9 | 3.4 | 4.6 |
| Multiple generation household Table 1 Note 2 | ||||||||||||
| Yes | 35.1Note * | 28.2 | 42.8 | 18.3 | 12.9 | 25.4 | 32.7Note * | 25.9 | 40.4 | 13.8Note * | 9.5 | 19.7 |
| No (ref.) | 58.0 | 56.6 | 59.4 | 14.8 | 13.8 | 15.8 | 21.7 | 20.6 | 22.9 | 5.5 | 4.9 | 6.1 |
| 2SLGBTQ+Table 1 Note 3 | ||||||||||||
| Yes | 65.0Note * | 58.7 | 70.8 | 14.6 | 10.7 | 19.6 | 13.8Note * | 10.3 | 18.4 | 6.6 | 4.3 | 10.1 |
| No (ref.) | 57.6 | 56.3 | 59.0 | 14.4 | 13.5 | 15.4 | 22.5 | 21.3 | 23.6 | 5.5 | 4.9 | 6.1 |
| Respondent identifies as disabled Table 1 Note 4 | ||||||||||||
| Yes | 59.6 | 55.6 | 63.5 | 20.2Note * | 17 | 23.9 | 13.6Note * | 11.2 | 16.4 | 6.6 | 5.0 | 8.7 |
| No (ref.) | 57.9 | 56.4 | 59.3 | 13.6 | 12.7 | 14.5 | 23.2 | 22 | 24.4 | 5.4 | 4.8 | 6.0 |
| Age group | ||||||||||||
| 15 to 24 years old (ref.) | 74.4 | 69.8 | 78.5 | 9.6 | 7.0 | 13.0 | 13.4 | 10.4 | 17.1 | 2.6 | 1.5 | 4.5 |
| 25 to 34 years old | 61.6Note * | 57.9 | 65.2 | 6.0 | 4.2 | 8.6 | 28.7Note * | 25.5 | 32.1 | 3.7 | 2.5 | 5.3 |
| 35 to 44 years old | 38.4Note * | 35.2 | 41.6 | 6.4Note * | 5.1 | 8.0 | 45.3Note * | 42.1 | 48.5 | 10.0Note * | 8.3 | 12 |
| 45 to 54 years old | 52.4Note * | 49.2 | 55.6 | 17.3Note * | 15 | 19.8 | 22.9Note * | 20.4 | 25.7 | 7.4Note * | 5.9 | 9.2 |
| 55 to 64 years old | 56.8Note * | 54.0 | 59.6 | 26.2Note * | 23.9 | 28.6 | 10.7 | 9.1 | 12.5 | 6.3Note * | 5.1 | 7.8 |
| 65 to 74 years old | 59.3Note * | 56.4 | 62.2 | 19.0Note * | 16.9 | 21.4 | 15.9 | 13.9 | 18.1 | 5.7Note * | 4.5 | 7.3 |
| 75 years or older | 71.0 | 67.7 | 74.1 | 19.6Note * | 17.0 | 22.5 | 8.1Note * | 6.3 | 10.3 | 1.3 | 0.6 | 2.8 |
| Racialized populationTable 1 Note 5 Table 1 Note 6 | ||||||||||||
| Racialized group | 59.0 | 56.1 | 61.8 | 9.9Note * | 8.2 | 11.9 | 25.8Note * | 23.4 | 28.3 | 5.3 | 4.3 | 6.6 |
| Non-racialized population (ref.)Table 1 Note 7 | 57.7 | 56.2 | 59.2 | 16.2 | 15.2 | 17.3 | 20.5 | 19.3 | 21.8 | 5.6 | 5.0 | 6.3 |
| Indigenous identityTable 1 Note 5 | ||||||||||||
| Indigenous personTable 1 Note 8 | 57.8 | 49.9 | 65.3 | 15.8 | 10.7 | 22.6 | 18.6 | 13.5 | 25.0 | 7.8 | 4.5 | 13.2 |
| Non-Indigenous person (ref.) | 58.1 | 56.7 | 59.4 | 14.4 | 13.5 | 15.3 | 22.0 | 20.9 | 23.2 | 5.5 | 4.9 | 6.1 |
| Immigrant status | ||||||||||||
| Non-recent immigrant (10 years and older) | 58.7 | 55.7 | 61.7 | 13.0Note * | 11.1 | 15.0 | 23.1 | 20.6 | 25.9 | 5.2 | 4.0 | 6.6 |
| Recent immigrant (less than 10 years) | 60.5 | 55.2 | 65.5 | 3.8Note * | 1.7 | 8.4 | 31.8Note * | 27.3 | 36.7 | 3.9 | 2.4 | 6.2 |
| Non-immigrantTable 1 Note 9 (ref.) | 57.6 | 56.1 | 59.2 | 16.0 | 14.9 | 17.1 | 20.5 | 19.3 | 21.8 | 5.9 | 5.2 | 6.6 |
| Educational attainment | ||||||||||||
| Less than high school (ref.) | 68.8 | 64.9 | 72.5 | 12.1 | 9.9 | 14.8 | 16.2 | 13.2 | 19.6 | 2.9 | 1.9 | 4.5 |
| High school diploma | 61.3Note * | 58.4 | 64.0 | 15.5Note * | 13.6 | 17.7 | 19.2 | 17.1 | 21.5 | 4.0 | 3.1 | 5.2 |
| College or trades | 55.9Note * | 53.6 | 58.1 | 15.0Note * | 13.6 | 16.6 | 22.1Note * | 20.3 | 24.0 | 7.0Note * | 5.9 | 8.2 |
| University | 51.8Note * | 49.5 | 54.1 | 14.1 | 12.6 | 15.7 | 27.3Note * | 25.3 | 29.4 | 6.8Note * | 5.8 | 8.0 |
| Main activity in last week | ||||||||||||
| Employed | 57.8 | 56.0 | 59.6 | 12.6Note * | 11.5 | 13.8 | 24.0Note * | 22.5 | 25.6 | 5.6 | 4.9 | 6.4 |
| Not employed (ref.) | 58.4 | 56.5 | 60.4 | 16.7 | 15.3 | 18.2 | 19.4 | 17.9 | 20.9 | 5.5 | 4.7 | 6.5 |
|
||||||||||||
The living arrangement of families, perhaps unsurprisingly, is linked to unpaid caregiving. 65% of those in multiple generation households (including multigenerational or skip-generation households)Note provided care, compared to 42% of those in other households. The rate of sandwich caregiving was particularly high: 14% of those living in multiple generation households were sandwich caregivers, compared to around 6% in other households.
Although those who were born outside of Canada and those who were born in Canada (non-immigrants) have similar rates of unpaid caregiving, the care receiver varies. More specifically, recent immigrants (those who immigrated in the last 10 years) are significantly less likely to care for care-dependent adults (4%, compared to 16% for non-immigrants), but much more likely to care for children (32%, vs. 20.5% for non-immigrants). Non-recent immigrants (those who immigrated more than 10 years ago) are more similar to caregivers born in Canada. This is likely linked to two factors. First, recent immigrants may not have as large of a family network located in Canada – particularly older family members. Second, recent immigrants have a younger age structure on average when compared to non-recent immigrants or those born in Canada.
Racialized groupsNote are also similarly likely to provide care as non-racialized groups in the past 12 months, but racialized groups are less likely to care for care-dependent adults and more likely to care for children. These patterns mirror the association with immigration status, which makes sense as 76% of CSS respondents who were part of racialized groups were also not born in Canada. Although racialized groups are not a homogenous population, due to sample size limitation, it is not possible to look at variation in caregiving rates by different population groups.
Start of text box
Defining sandwich caregiving
Sandwich caregiving has been of interest for researchers, advocates, and caregivers for decades (e.g., Miller, 1981). Caregiving for adult and children care receivers with different and complex needs can have negative impacts on caregivers’ well-being (Boyczuk & Fletcher, 2016; Rubin & White-Means, 2009; Williams, 2004).
In past research, sandwich caregivers are typically defined as those caring for seniors, usually their own aging parents, and who have minor children in the household (Hodgdon et al., 2023; Sinha, 2012; Williams, 2004). Definitions vary across studies: some look at only specific age ranges, usually 40-59 (e.g., Angus Reid Institute, 2019; Parker & Patten, 2013); others consider different relationships to care receivers (e.g., Luna et al., 2021; Vlachantoni et al., 2020).
New data from the CSS Wave 6 allows for an expanded perspective on sandwich caregiving (see: Data sources, definitions, and methods). In this study, “sandwich caregiving” refers to providing care in the past 12 months to both care-dependent adults (over 15 years old, with a long-term condition or disability) and to children under age 15. This does not limit the definition to a specific age range, household co-residence, or relationship arrangement. The CSS Wave 6 also provides new data on care provision to both groups simultaneously, whereas past studies usually only have information about care to one of two groups (e.g., Sinha, 2012; Williams, 2004).
End of text box
Caregivers aged between 35 and 54 years are most likely to have multiple care responsibilities
Unpaid caregiving varies across the life course, following the progression of major life events. In mid-adulthood, as people are in prime childbearing years, they are most likely to care for children; and as people age, they are more likely to care for care-dependent adults (Statistics Canada, 2022b).
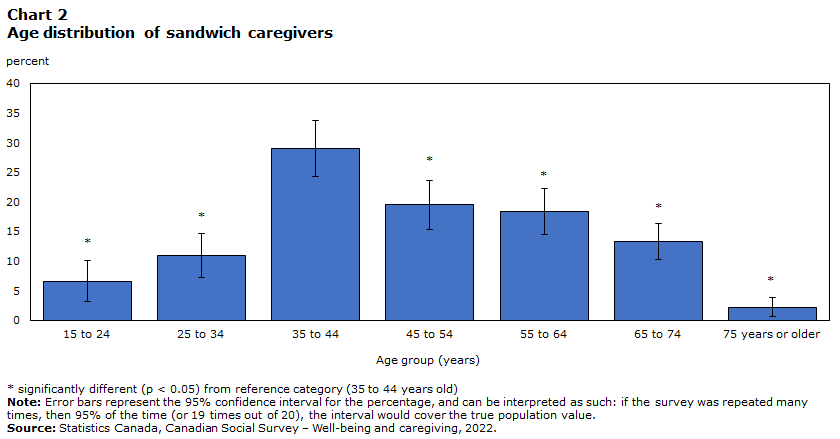
Data table for Chart 2
| Age group (years) | Percent | 95% confidence intervals | |
|---|---|---|---|
| lower bound | upper bound | ||
| 15 to 24 | 6.6Note * | 0.6 | 3.8 |
| 25 to 34 | 11Note * | 10.2 | 16.4 |
| 35 to 44 | 29 | 14.4 | 22.2 |
| 45 to 54 | 19.5Note * | 15.4 | 23.6 |
| 55 to 64 | 18.3Note * | 24.3 | 33.7 |
| 65 to 74 | 13.3Note * | 7.3 | 14.7 |
| 75 years or older | 2.2Note * | 3.1 | 10.1 |
Source: Statistics Canada, Canadian Social Survey – Well-being and caregiving, 2022. |
|||
Being “sandwiched” between multiple caregiving responsibilities is most common of those in the prime working age groups (Chart 2), with no differences between men and women in the age distribution. Nearly one-third of sandwich caregivers are between 35-44 years old (29%). Similar proportions of sandwich caregivers are between 45-54 years old (20%) and 55-64 years old (18%). The oldest (those 75 and over) and youngest (those 15 to 24 years old) age groups are the least likely to be sandwich caregivers.
This aligns generally with past research on the “sandwich generation,” which suggests that the dual responsibilities of care are most common at a time when people may have young children and aging parents (see: Defining sandwich caregiving). At the same time, Chart 2 shows that being “sandwiched” is still common at other stages of the life course. For example, about one-third of sandwich caregivers are 55 or above.
Results II: How much unpaid care is provided, and to whom?
Canadians provide care to children, parents, and spouses, but also to grandchildren, friends and neighbours
Much research on care, especially for sandwich caregiving, focuses on how parents provide care to children, or how adult children provide care to their aging parents (see: Defining sandwich caregiving). Indeed, these caregiving relationships were most common. 63% of those who cared for children in the past 12 months did so for their own child (Table 2A). Caregivers for only children were more likely to care for their own child (65%) compared to sandwich caregivers (54%). Similarly, 53% of caregivers for care-dependent adults cared for a parent or parent-in-law (Table 2B), with no difference depending on whether they were “sandwiched.”
| Relationship to adultTable 2A Percentage of unpaid caregivers in the previous 12 months, by relationship with the adult care receiver and type of caregiver, 2022 Note 1 |
Type of caregiver | |||||
|---|---|---|---|---|---|---|
| Care to adults only | Sandwich care | |||||
| Percent | 95% confidence intervals | Percent | 95% confidence intervals | |||
| lower bound | upper bound | lower bound | upper bound | |||
| Spouse/partner | 19.0 | 16.7 | 21.6 | 15.8 | 12.2 | 20.1 |
| Own child (15 and older) | 10.3Note * | 8.6 | 12.4 | 15.3 | 11.8 | 19.6 |
| Sibling | 8.6Note * | 6.9 | 10.6 | 4.6 | 2.9 | 7.3 |
| Parent | 51.4 | 48.2 | 54.7 | 57.1 | 51.7 | 62.4 |
| Other family member | 13.6 | 11.2 | 16.5 | 15.4 | 11.8 | 19.8 |
| Friend/neighbour | 17.3Note * | 15.0 | 19.8 | 9.7 | 7.1 | 13.1 |
| Other | 1.5 | 0.8 | 3.0 | 2.3 | 0.7 | 6.9 |
Source: Statistics Canada, Canadian Social Survey – Well-being and caregiving, 2022. |
||||||
| Relationship to childTable 2B Percentage of unpaid caregivers in the previous 12 months, by relationship with the child care receiver and type of caregiver, 2022 Note 1 |
Type of caregiver | |||||
|---|---|---|---|---|---|---|
| Care to children only | Sandwich care | |||||
| Percent | 95% confidence intervals | Percent | 95% confidence intervals | |||
| lower bound | upper bound | lower bound | upper bound | |||
| Own child (less than 15) | 64.9Note * | 62.1 | 67.6 | 53.5 | 48.2 | 58.8 |
| Grandchild | 19.2Note * | 17.4 | 21.2 | 30.5 | 25.9 | 35.5 |
| Sibling | 6.5 | 4.7 | 8.7 | 3.1 | 1.4 | 6.4 |
| Other family member | 2.6 | 1.7 | 3.9 | 3.7 | 2.0 | 6.8 |
| Child of friend/neighbour | 5.2Note * | 3.9 | 7.0 | 8.8 | 6.1 | 12.5 |
| Niece/nephew | 7.0Note * | 5.6 | 8.6 | 10.5 | 7.6 | 14.4 |
| Other | 0.6 | 0.3 | 1.3 | Note x: suppressed to meet the confidentiality requirements of the Statistics Act | Note x: suppressed to meet the confidentiality requirements of the Statistics Act | Note x: suppressed to meet the confidentiality requirements of the Statistics Act |
x suppressed to meet the confidentiality requirements of the Statistics Act
Source: Statistics Canada, Canadian Social Survey – Well-being and caregiving, 2022. |
||||||
At the same time, even if these care relationships were common, they should not obscure other relationships. More than half of unpaid caregivers (55%) did not provide care for their own children under 15 or their aging parents. For example, 22% of those providing care to children did so for their grandchild or grandchildren. This was more common for those with multiple care responsibilities, as 31% of sandwich caregivers compared to 19% of caregivers for only children cared for at least one grandchild, a pattern that aligns with the older average age of sandwich caregivers.
Caregivers are most likely to be “sandwiched” between their parents and own children (34%) or their parents and grandchildren (15%)
Beyond individual caregiving relationships, we can also examine how caregivers are “sandwiched” between different relationship to both care-dependent groups. As expected, the most common ‘sandwiching’ arrangement is between minor children and aging parents: 34% of sandwich caregivers reported caring for a parent (or parent-in-law) and child under 15 years old in the past 12 months. These caregivers are close to the typical profile of the sandwich generation, as about half are 35-44 years old and 31% are 45-54 years old. According to linked Census data, about 14% of these caregivers lived in multiple generation (including skip-generation) households.Note
There are many kinds of multiple caregiving responsibilities beyond this more typical profile. The second-most common (15%) sandwich caregiving arrangement is caring for a parent and grandchild. These caregivers tend to be between 55 and 74 years old. This arrangement reflects not only the aging of the population but also the increased longevity of Canadians: as caregivers move into grandparenthood and help their adult children, their own elderly parents may still be alive and requiring care (Luna et al., 2021; Vlachantoni et al., 2020).
Another way caregivers may be “sandwiched” includes providing care to one’s own spouse or partner. 8% of sandwich caregivers report caring for their partner and own child, while about 7% report caring for a grandchild alongside a spouse.
However, due to small sample sizes in the data, the CSS is limited in how much information it can provide about different “sandwiched” arrangements. Future research could explore how the intensity of caregiving and the impacts of caregiving might vary depending on the relationships.
Sandwich caregivers do different care tasks for care-dependent adults than other caregivers
Understanding which care tasks are done for care-dependent adultsNote enriches our understanding of not only what kinds of care responsibilities are taken on by unpaid caregivers, but also how these responsibilities are gendered. Care tasks tend to be gendered (Moyser & Burlock, 2018): women are more likely to provide direct, personal care – which tends to be more inflexible – whereas men are more likely to help with more indirect and flexible tasks such as household maintenance or outdoor work. Although numerous studies document differences between men and women in care tasks for adult or child caregivers (e.g., Arriagada, 2020; Moyser & Burlock, 2018; Statistics Canada, 2022b), little is known about sandwich caregivers.
| All | Men+Table 3 Note 1 | Women+Table 3 Note 1 | |||||||
|---|---|---|---|---|---|---|---|---|---|
| Percent | 95% confidence intervals | Percent | 95% confidence intervals | Percent | 95% confidence intervals | ||||
| lower bound | upper bound | lower bound | upper bound | lower bound | upper bound | ||||
| Panel A: care to adults only | |||||||||
| Transportation | 71.6 | 68.3 | 74.7 | 71.4 | 66.4 | 75.9 | 71.8 | 67.3 | 75.9 |
| Household chores | 57.8Note * | 54.5 | 61.0 | 55.2 | 50.3 | 60.0 | 60.3Note * | 55.8 | 64.6 |
| House maintenance/outdoor workTable 3 Note 2 | 53.1 | 49.8 | 56.4 | 61.9 | 57.0 | 66.5 | 44.8Note * | 40.5 | 49.2 |
| Personal careTable 3 Note 2 | 33.4Note * | 30.3 | 36.7 | 30.1 | 25.7 | 34.9 | 36.6Note * | 32.3 | 41.1 |
| Medical treatment/procedures | 32.7 | 29.7 | 35.8 | 30.4 | 26.0 | 35.1 | 34.8Note * | 30.8 | 39.1 |
| Scheduling/coordinating careTable 3 Note 2 | 41.8Note * | 38.6 | 45.1 | 36.1 | 31.5 | 41.0 | 47.2 | 42.9 | 51.6 |
| Managing finances | 42.8 | 39.6 | 46.1 | 43.5 | 38.6 | 48.5 | 42.2 | 38.0 | 46.5 |
| Emotional supportTable 3 Note 2 | 79.2 | 76.0 | 82.0 | 76.3 | 71.7 | 80.4 | 81.9 | 77.4 | 85.6 |
| Other | 4.1 | 3.0 | 5.6 | 4.4 | 2.7 | 7.2 | 3.9 | 2.7 | 5.6 |
| Panel B: sandwich care | |||||||||
| Transportation | 71.7 | 66.5 | 76.5 | 74.9 | 67.3 | 81.3 | 69.6 | 62.4 | 75.9 |
| Household chores | 64.9 | 59.7 | 69.8 | 60.3 | 51.9 | 68.2 | 68.0 | 61.3 | 74.1 |
| House maintenance/outdoor work | 54.7 | 49.3 | 59.9 | 59.2 | 50.8 | 67.1 | 51.7 | 44.8 | 58.4 |
| Personal careTable 3 Note 2 | 39.0 | 33.8 | 44.4 | 30.2 | 23.0 | 38.4 | 44.8 | 38.0 | 51.8 |
| Medical treatment/proceduresTable 3 Note 2 | 36.3 | 31.3 | 41.5 | 28.8 | 21.8 | 36.9 | 41.3 | 34.8 | 48.2 |
| Scheduling/coordinating careTable 3 Note 2 | 47.7 | 42.4 | 53.0 | 41.5 | 33.4 | 50.0 | 51.8 | 45.0 | 58.6 |
| Managing finances | 42.5 | 37.3 | 47.9 | 41.4 | 33.3 | 50.1 | 43.3 | 36.6 | 50.2 |
| Emotional supportTable 3 Note 2 | 82.4 | 77.7 | 86.3 | 76.9 | 69.2 | 83.2 | 86.0 | 79.7 | 90.6 |
| Other | 5.7 | 3.7 | 8.7 | 4.6 | 2.1 | 10.1 | 6.4 | 3.8 | 10.5 |
Source: Statistics Canada, Canadian Social Survey – Well-being and caregiving, 2022. |
|||||||||
Caregivers for multiple care-dependent groups were more likely to help with a slightly greater diversity of tasks. Sandwich caregivers helped with an average of about 5 different tasks, compared to caregivers for adults only who provided help with about 4 types of tasks.
Sandwich caregivers were more likely to report providing help with certain tasks compared to those who care only for care-dependent adults. For example, sandwich caregivers were more likely to report doing household chores and meal preparation (65% vs. 58%), personal care (39% vs. 33%), and scheduling or coordinating care (48% vs. 42%). These differences tended to be driven by women who had multiple care responsibilities: that is, men were similar regardless of providing sandwich care or not, but women sandwich caregivers were more likely to report these tasks.
Gendered differences in care tasks were similarly patterned regardless of whether caring for one or dual care-dependent groups. For example, women were more likely to provide help with scheduling and coordinating care for adults compared to men, for both sandwich carers (52% vs. 41%) and those caring for adults only (47% vs. 36%). In some cases, though, gender differences were larger for sandwich caregivers than carers for only adults. For example, about 45% of women sandwich caregivers provided personal care, compared to only 30% of men sandwich caregivers. This almost 15-point difference was more substantial than the gap between women caregivers for adults only (37%) compared to men (30%).
Those “sandwiched” between multiple care responsibilities report the same average caregiving time as caregivers for only one care-dependent group
In an average week in the past 12 months, caregivers for care-dependent adults reported providing 21 hours of care on average, whereas caregivers for children provided 39 hours. Sandwich caregivers provided similar hours of care in an average week for care-dependent adults and for children, respectively.Note
An important factor in caregiving time is co-residence: living in the same household as their care receiver is associated with more intense caregiving. Both caregivers for children and caregivers for adults spent significantly longer on caregiving when they lived currently or in the past 12 months with a care receiver (Appendix Table A1).Note For example, on average, caregivers for a household adult spend 18 more hours caring in an average week compared to caregivers for non-household adults and caregivers for a household child spend 13 hours more than caregivers for non-household children.
Having a care receiver that is an immediate family member is also associated with more intense caregiving. Caring for a spouse or partner or for an own child is associated with significantly more time in caregiving, once adjusting for sociodemographic factors and other care arrangements (such as household co-residence) (Appendix Table A1). For example, those who cared for a spouse or partner spent about 10 hours more in an average week, compared to other caregiving relationships. Those who cared for household children reported spending 36 hours more in an average week, compared to other caregiving relationships – a dramatic difference.
In addition, women reported significantly more care time for both adults and children compared to men. Net of other sociodemographic and care factors, women spent 4 hours more caregiving in an average week for care-dependent adults compared to men, and 8 hours more for children compared to men (Appendix Table A1).
Almost half of sandwich caregivers felt that the pandemic led to increased caregiving time
The COVID-19 pandemic was a shock to the lives of unpaid caregivers. As lockdown restrictions in early 2020 limited access to paid care services such as daycares or residential care facilities, unpaid caregivers were faced with a different set of care responsibilities for children (Leclerc, 2020) and adults (Anderson et al., 2021; Beach et al., 2021). However, data for the CSS Wave 6 were collected in July to August 2022. At this time, there were relatively fewer restrictions related to the pandemic in Canada. Indeed, studies suggest that disruptions to gendered patterns of care that happened in the early period of the pandemic (e.g., Shafer et al., 2020) may have dissipated as the pandemic moved past the initial shock and lockdown period (Sánchez et al., 2021). As such, the data collected by the CSS may show different patterns than data collected in early months of the pandemic.
Given this pandemic context, how did unpaid caregivers perceive the impact of the pandemic over the last 12 months on their caregiving time for care-dependent adults or children? Caregivers for children were more likely to report impacts than caregivers for adults. 41% of caregivers for only children felt their time increased (Chart 3), compared to 31% of caregivers for only care-dependent adults (Chart 4).
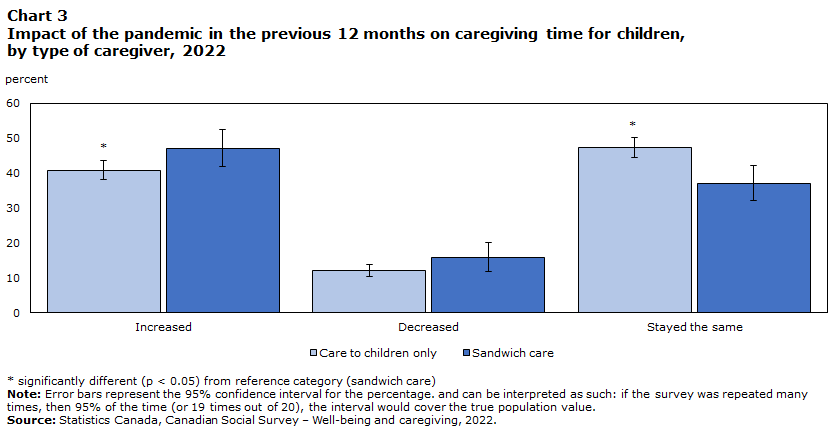
Data table for Chart 3
| Care to children only | Sandwich care | |||||
|---|---|---|---|---|---|---|
| Percent | 95% confidence intervals | Percent | 95% confidence intervals | |||
| lower bound | upper bound | lower bound | upper bound | |||
| Increased | 40.8Note * | 38.1 | 43.5 | 47.0 | 41.7 | 52.3 |
| Decreased | 12.1 | 10.3 | 13.9 | 15.9 | 11.8 | 20.0 |
| Stayed the same | 47.2Note * | 44.3 | 50.1 | 37.1 | 32.0 | 42.2 |
Source: Statistics Canada, Canadian Social Survey – Well-being and caregiving, 2022. |
||||||
Sandwich caregivers were significantly more likely to feel impacts of the pandemic on increased caregiving time, compared to caregivers for only one care-dependent group. Nearly half of sandwich caregivers reported a perceived increase in their time spent caring for children (47%) or adults (46%). However, once adjusting for other sociodemographic and care factors using regression models (Appendix Table A2), sandwich caregivers were not more likely to report pandemic-related increases to care time. This suggests that this association can be explained by the characteristics of sandwich caregivers or their caregiving arrangements.
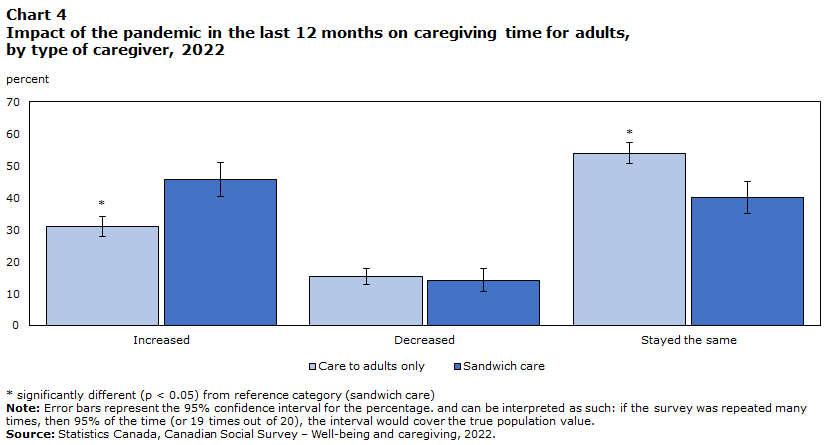
Data table for Chart 4
| Care to adults only | Sandwich care | |||||
|---|---|---|---|---|---|---|
| Percent | 95% confidence intervals | Percent | 95% confidence intervals | |||
| lower bound | upper bound | lower bound | upper bound | |||
| Increased | 30.9Note * | 27.8 | 34.0 | 45.7 | 40.4 | 51.0 |
| Decreased | 15.2 | 12.7 | 17.7 | 14.2 | 10.7 | 17.7 |
| Stayed the same | 53.9Note * | 50.6 | 57.2 | 40.1 | 35.0 | 45.2 |
Source: Statistics Canada, Canadian Social Survey – Well-being and caregiving, 2022. |
||||||
The types of care provided changed how caregivers perceived the pandemic’s impacts (Appendix Table A2). Caregiving arrangements that are associated with more hours of care were also associated with perceived increases in caregiving time due to the pandemic, compared to no change or decreases in time.
For example, living in the same household as a care receiver was associated with a higher likelihood of reporting that the pandemic in the past 12 months led to increases in care time, compared to no change or decreases. Caregivers for children were also more likely to report perceived increases in care time if they had a care receiver(s) with a long-term condition or disability that required more care, net of other factors.
Impacts were also not evenly distributed across caregivers, either (Appendix Table A2). Women and caregivers from a racialized group were both more likely to report perceived increases for time caring for care-dependent adults, once adjusting for other sociodemographic and care factors. IndigenousNote caregivers were more likely to perceive increases in care time for children, net of these other factors. However, there was no gender difference in impacts on care for children.
Results III: What are the impacts of unpaid caregiving?
86% of sandwich caregivers report negative impacts on their physical health and well-being due to their caregiving responsibilities
At first glance, most caregivers reported coping well with their caregiving responsibilities. Caregivers for children were less likely to report struggling with caregiving (5%) compared to caregivers for adults (15%) or sandwich caregivers (17%).
Yet, when looking more specifically at impacts to health and well-being, this picture shifts. Caregivers tended to report slightly lower levels of general perceived health and mental health than non-caregivers. Caregivers for only adults (18%) and sandwich caregivers (21%) were more likely to report having fair or poor mental health compared to caregivers for children or non-caregivers (14%). Caregivers for only adults and sandwich caregivers (15%) were both more likely to report fair or poor general health. In contrast, caregivers for children were less likely than non-caregivers and other caregivers to report poor overall health.
When asked specifically about how their care responsibilities affected their health and well-being, most caregivers reported at least one negative impact (Chart 5). Sandwich caregivers were most likely, with 86% reporting at least one impact, compared to 74% of caregivers for adults and 62% of caregivers for children. This aligns with past research on caregivers with multiple care responsibilities, which finds that being “sandwiched” between aging parents and minor children is associated with heightened stress, lower psychological well-being, and less healthy behaviour (Hodgdon et al., 2023).

Data table for Chart 5
| Care to adults only | Care to children only | Sandwich care | |||||||
|---|---|---|---|---|---|---|---|---|---|
| Percent | 95% confidence intervals | Percent | 95% confidence intervals | Percent | 95% confidence intervals | ||||
| lower bound | upper bound | lower bound | upper bound | lower bound | upper bound | ||||
| Tired | 51.5Note * | 7.0 | 11.0 | 52.0Note * | 4.1 | 6.9 | 69.2 | 7.6 | 15.0 |
| Worried / anxious | 55.1Note * | 12.7 | 18.1 | 30.9Note * | 8.8 | 12.4 | 64.7 | 12.6 | 21.2 |
| Overwhelmed | 34.1Note * | 11.4 | 15.8 | 32.4Note * | 10.6 | 14.6 | 50.0 | 13.9 | 22.5 |
| Short-tempered / irritable | 29.5Note * | 13.3 | 17.7 | 28.2Note * | 7.8 | 11.4 | 39.0 | 15.9 | 24.5 |
| Disturbed sleep |
30.7Note * | 19.8 | 25.2 | 25.0Note * | 8.9 | 12.5 | 37.6 | 21.5 | 31.3 |
| Depressed | 22.5 | 27.8 | 33.6 | 10.7Note * | 22.6 | 27.4 | 26.4 | 32.5 | 42.7 |
| Resentful | 15.5Note * | 26.6 | 32.4 | 9.6Note * | 25.7 | 30.7 | 20.2 | 33.7 | 44.3 |
| Isolated | 13.6Note * | 31.0 | 37.2 | 12.6Note * | 29.9 | 34.9 | 18.2 | 44.7 | 55.3 |
| Lonely | 15.4 | 51.8 | 58.4 | 10.6Note * | 28.4 | 33.4 | 16.9 | 59.6 | 69.8 |
| Loss of appetite |
9.0 | 48.2 | 54.8 | 5.5Note * | 49.1 | 54.9 | 11.3 | 64.5 | 73.9 |
Source: Statistics Canada, Canadian Social Survey – Well-being and caregiving, 2022. |
|||||||||
Over two-thirds of sandwich caregivers reported feeling tired (69%), compared to about half of caregivers for only adults or only children. Significantly more sandwich caregivers (65%) reported feeling worried or anxious compared to caregivers for only adults (55%) or those for only children (31%). In addition, fully half of sandwich caregivers were overwhelmed (50%), compared to only about a third of caregivers for care-dependent adults or children.
Similarly, over a third of sandwich caregivers reported having disturbed sleep (38%), more than caregivers for adults (31%) or children (25%). Nearly a quarter of sandwich caregivers (26%) and caregivers for adults (23%) reported that their care responsibilities in the past 12 months made them feel depressed.
Compared to other caregivers, caregivers for children reported feeling significantly less worried or anxious (31%), less lonely (11%), and less depressed (11%). However, they felt just as tired (52%), overwhelmed (32%), and short-tempered or irritable (28%) compared to caregivers for adults.
Over two-thirds of sandwich caregivers felt their employment or job-seeking was negatively affected by their caregiving
Caregiving responsibilities, particularly those for care-dependent adults, have negative consequences for one’s job and employment potential. Due to their responsibilities for care-dependent adults, caregivers experience both short-term disruptions to their work as well as potential long-term consequences for their career (Keating et al., 2014; Sinha, 2012). It is less clear, however, how being “sandwiched” in between different caregiving responsibilities might impact employment.
The CSS asked all respondents about whether their caregiving responsibilities affected their employment or job-seeking activities in the past 12 months. These impacts vary significantly by the type of caregiver, for caregivers who were not retired as a main activity in the past week.Note
| Employment impactTable 4 Note 2 | Type of caregiverTable 4 Note 1 | ||||||||
|---|---|---|---|---|---|---|---|---|---|
| Care to adults only | Care to children only | Sandwich care | |||||||
| Percent | 95% confidence intervals | Percent | 95% confidence intervals | Percent | 95% confidence intervals | ||||
| lower bound | upper bound | lower bound | upper bound | lower bound | upper bound | ||||
| Quit/lost job | 3.1Note * | 1.9 | 5.0 | 2.5Note * | 1.8 | 3.5 | 5.6 | 3.3 | 9.2 |
| Additional job | 1.6 | 0.8 | 3.2 | 1.6 | 1.1 | 2.4 | 1.5 | 0.5 | 4.4 |
| Reduced hours | 4.9Note * | 3.6 | 6.6 | 8.7Note * | 7.2 | 10.6 | 14.1 | 10.3 | 18.8 |
| Increased hours | 2.8 | 1.7 | 4.5 | 4.0 | 3.1 | 5.2 | 4.7 | 2.9 | 7.5 |
| Adjusted schedule | 14.9Note * | 12.4 | 17.8 | 18.5Note * | 16.3 | 21.0 | 30.0 | 25.0 | 35.5 |
| Reduced tasks and responsibilities | 3.8Note * | 2.7 | 5.3 | 4.5Note * | 3.5 | 5.8 | 9.3 | 6.5 | 13.1 |
| Gave up opportunities | 3.3Note * | 2.3 | 4.9 | 5.1Note * | 4.0 | 6.4 | 11.1 | 7.9 | 15.3 |
| Unable to work | 5.8 | 3.5 | 9.5 | 5.4 | 4.1 | 7.0 | 7.3 | 4.8 | 11.0 |
| Other | 1.9 | 1.1 | 3.2 | 1.5 | 1.0 | 2.2 | 2.2 | 1.1 | 4.3 |
Source: Statistics Canada, Canadian Social Survey – Well-being and caregiving, 2022. |
|||||||||
Sandwich caregivers were most likely to report impacts on their employment due to their caregiving responsibilities in the past 12 months, compared to other caregivers. 66% of sandwich caregivers reported at least one negative consequence for their employment, compared to 39% for caregivers for children and 30% for caregivers for adults.
In particular, sandwich caregivers were more likely to report adjusting their schedule to deal with caregiving (30%) compared to caregivers for children (19%) or for adults (15%) only. These sandwich carers were also more likely to reduce hours (14%) or reduce tasks and responsibilities (9%). Finally, sandwich caregivers also reported having given up better opportunities at work more (7%) than other caregivers.
Over one-third of sandwich caregivers experienced financial hardship due to caregiving responsibilities
Unpaid caregiving not only has costs for health and well-being, but also substantial economic costs. These costs may be driven by labour market consequences or by out-of-pocket expenses (Keating et al., 2014). Together, these costs contribute to higher levels of economic strain for caregivers.Note
Indeed, caregivers were more likely to say that their household had difficulty meeting its financial needs (in terms of transportation, housing, food, clothing, and other necessary expenses) in the past 12 months. About 22% of non-caregivers reported finding it difficult or very difficult, compared to 26% of caregivers for adults or children only. Sandwich caregivers were significantly more likely to have difficulty, as 35% reported it was difficult or very difficult.
When asked specifically about the impact of their caregiving responsibilities, 35% of sandwich caregivers reported experiencing financial hardship due to their caregiving responsibilities, compared to about 25% for caregivers for only care-dependent adults or for only children.Note
Women experience more negative impacts than men due to caregiving responsibilities, especially when ‘sandwiched’ between both care-dependent groups
In general, women report coping as well or only slightly less well with their caregiving responsibilities as do men. Yet, women report significantly more negative consequences for their well-being, financial situation, relationships, and employment due to their caregiving responsibilities. In particular, women who are sandwich caregivers fare poorly compared to women providing care to only adults or only children, as well as compared to men who are sandwich caregivers.
| Men+Table 5 Note 1 | Women+Table 5 Note 1 | |||||
|---|---|---|---|---|---|---|
| Percent | 95% confidence intervals | Percent | 95% confidence intervals | |||
| lower bound | upper bound | lower bound | upper bound | |||
| Panel A: Care to adults only | ||||||
| Not coping wellTable 5 Note 3 | 11.5 | 8.4 | 15.5 | 17.7 | 14.0 | 22.1 |
| Well-beingTable 5 Note 3 | 69.1 | 64.4 | 73.5 | 79.1Note * | 75.3 | 82.4 |
| Financial hardship | 22.8Note * | 18.7 | 27.6 | 21.1Note * | 17.8 | 24.8 |
| Relational strain | 27.9 | 23.7 | 32.5 | 32.0Note * | 28.1 | 36.1 |
| EmploymentTable 5 Note 2 Table 5 Note 3 | 25.2Note * | 20.3 | 30.9 | 38.8Note * | 33.2 | 44.7 |
| Panel B: Care to children only | ||||||
| Not coping well | 4.6Note * | 3.1 | 6.8 | 5.5Note * | 4.0 | 7.4 |
| Well-beingTable 5 Note 3 | 54.6Note * | 50.3 | 58.9 | 67.4Note * | 63.7 | 70.8 |
| Financial hardship | 23.4Note * | 19.9 | 27.3 | 20.9Note * | 18.0 | 24.0 |
| Relational strain | 22.5Note * | 19.2 | 26.3 | 24.1Note * | 21.2 | 27.4 |
| EmploymentTable 5 Note 2 | 35.6Note * | 31.3 | 40.1 | 41.4Note * | 37.5 | 45.4 |
| Panel C: Sandwich care | ||||||
| Not coping well | 14.2 | 9.1 | 21.5 | 18.1 | 13.4 | 24.0 |
| Well-beingTable 5 Note 3 | 75.1 | 67.3 | 81.5 | 92.7 | 89.2 | 95.1 |
| Financial hardshipTable 5 Note 3 | 28.0 | 20.9 | 36.5 | 41.1 | 34.4 | 48.1 |
| Relational strainTable 5 Note 3 | 38.1 | 30.3 | 46.6 | 50.1 | 43.4 | 56.9 |
| EmploymentTable 5 Note 2 | 51.8 | 42.6 | 60.9 | 58.5 | 51.0 | 65.6 |
Source: Statistics Canada, Canadian Social Survey – Well-being and caregiving, 2022. |
||||||
Across types of caregivers, women are the most likely to report that their unpaid caregiving responsibilities caused negative impacts to their health and well-being. This gendered difference is largest for sandwich caregivers, where 93% of women reported negative consequences, compared to 76% of men. Almost 7 out of 10 women (69%) who care for children report at least one impact to their health and well-being, compared to 55% of men. The smallest gap was between women (79%) and men (70%) who cared for care-dependent adults.
Women who were sandwich caregivers were most likely to report more negative outcomes overall than men who were sandwich caregivers. Indeed, fully half of women sandwich caregivers (50%) felt that caregiving caused strain in their relationships, compared to just over one-third of men sandwich caregivers (38%). Similarly, 41% of women sandwich caregivers said their caregiving responsibilities led to financial hardship in the past 12 months, compared to 28% of their male counterparts.
Women who cared only for care-dependent adults were also more likely than men to report their caregiving affected their employment or job-seeking negatively. Nearly 4 out of 10 (39%) non-retired women caring only for adults reported at least one impact, compared to 25% of men.
However, there were no statistically significant gendered differences in how caregiving affected employment between men and women sandwich caregivers or caregivers for children. This may be because the CSS only provides a cross-sectional snapshot in time. In addition, women who provided care as sandwich caregivers or to children were significantly less likely to report being employed as a main activity in the past week,Note compared to men.Note It is possible that women may have changed their employment due to their caregiving responsibilities outside of the reference period of the past 12 months. However, without additional data on employment in the past 12 months, it is not possible to assess this in depth. Future research examining work and caregiving histories of sandwich caregivers would be important.
Summary
Unpaid caregiving is a critical part of Canada’s care economy, especially as trends such as population aging, longer life expectancies, more complex care needs, and delayed fertility put pressure on Canadians who provide care. Using the Wave 6 of the CSS, this study provides an updated portrait of unpaid caregivers in Canada in 2022, with a particular focus on those who are ‘sandwiched’ between caregiving responsibilities for dual care-dependent groups.
13.4 million Canadians aged 15 and older (about 42%) provided unpaid care to either care-dependent adults or children in the past 12 months. 1.8 million Canadians, or about 13% of unpaid caregivers, were sandwiched between the unique care demands of both care-dependent groups. Women were more likely to provide unpaid care, mainly because more women are sandwiched between multiple caregiving responsibilities than men. Being in the middle of dual caregiving roles was most common for those in mid-adulthood.
Canadians provided unpaid care not only to their immediate family – such as their own children, their spouse, or their parents – but also to their grandchildren, their nieces and nephews, and friends and neighbours, among others. Although caregivers were most likely to be sandwiched between their parents and own children, as is typical of the “sandwich generation,” 15% were sandwiched between their parents and grandchildren – a stark example of the pressures of population aging and delayed fertility.
Although sandwich caregivers juggled multiple care responsibilities, they reported the same average hours of caregiving time in an average week as caregivers for only one care-dependent group. The factors related to more intense caregiving were very similar across caregivers: having a care receiver live in the household, or an immediate family care receiver, were associated with more caregiving time.
The responsibilities of unpaid caregiving, especially sandwich caregiving, are not evenly distributed. In particular, this study reinforces that caregiving is gendered: women are not only more likely to be caregivers, but are also more likely to spend more time on caregiving, often on more inflexible and direct types of care tasks. The impact of caregiving is also gendered, as women sandwich caregivers are more likely than men to report more negative impacts on their physical health and well-being, financial well-being, family relations, and employment.
Data sources, definitions, and methods
Data sources
This study uses data from the Canadian Social Survey (CSS) Wave 6 (Well-being and Caregiving). The CSS has a target population of non-institutionalized persons 15 years of age or older, living off-reserve in the 10 provinces of Canada. This survey was collected from July 15 to August 28, 2022, with an estimated response rate of 56.5%.
To provide additional information about household living arrangements, data from the 2021 Census and the CSS Wave 6 were linked in the Social Data Linkage Environment (SDLE) and integration keys were used to prepare the final file. Approximately 89% of the records in the CSS were linked to a Census record.Note
Definitions
Data and concepts in the CSS are based on Statistics Canada’s conceptual framework of the care economy (Wray et al., 2023). The care economy is that sector of the broader economy comprising the provision of paid and unpaid care work involved in meeting the physical, psychological, and emotional needs of care-dependent adults and children (Statistics Canada, 2022b; Wray et al., 2023; see also Peng, 2019).
Unpaid caregiving: In the past 12 months, having “cared for or looked after” unpaid someone under the age of 15 years old; or having “helped or cared” for someone 15 years or older with a long-term condition, a disability, or a problem related to aging.Note The care is given without explicit remuneration because of a personal relationship to family or friends, and does not include care provided by someone on behalf of a volunteer organization.
This care could be ongoing or temporary, regular or irregular, and can vary in intensity. The tasks of care work range from direct, hands-on care such as activities of daily living (e.g., feeding or bathing) to more complex or indirect care (e.g., cleaning, transportation), as well as care management (e.g., helping schedule or coordinate care), and supervising the care receiver.
Sandwich caregiving: In the past 12 months, providing unpaid care to care-dependent children under 15 years old and care-dependent adults and youth aged 15 or older with a long-term condition, disability, or problems related to aging (see: Defining sandwich caregiving.)
Methodology
The total sample of the CSS Wave 6 was 9,767 respondents (4,200 of whom were unpaid caregivers). Where appropriate in analyses, respondents with not stated responses on key characteristics were excluded using listwise deletion.
Descriptive statistics were used to examine the sociodemographic characteristics of unpaid caregivers, the characteristics of caregiving, and caregivers’ reported impacts on well-being. Statistical tests were conducted to assess the statistical significance of these estimates. In addition, ordinary least squares (OLS) linear regression and logistic regression analyses were conducted where appropriate to assess the factors associated with care outcomes. All estimates in this study used population weights and bootstrap weights from the CSS.
Appendix
| Children (N=2,481) |
Care-dependent adults (N=2,033) |
|||||
|---|---|---|---|---|---|---|
| Coefficient | 95% confidence intervals | Coefficient | 95% confidence intervals | |||
| lower bound | upper bound | lower bound | upper bound | |||
| hours | ||||||
| Unpaid sandwich care | 2.2 | -1.8 | 6.1 | 1.1 | -2.9 | 5.1 |
| Multiple adult care receivers (ref. = 1 adult care receiver) | Note ...: not applicable | Note ...: not applicable | Note ...: not applicable | -1.4 | -4.9 | 2.0 |
| Adult care receiver(s) lives in household | Note ...: not applicable | Note ...: not applicable | Note ...: not applicable | 17.8Note *** | 12.6 | 23.0 |
| Adult care receiver is spouse or partner | Note ...: not applicable | Note ...: not applicable | Note ...: not applicable | 9.7Note * | 1.6 | 17.9 |
| Adult care receiver(s) is own child (ref. = no) | Note ...: not applicable | Note ...: not applicable | Note ...: not applicable | 7.5Note * | 0.1 | 14.9 |
| Adult care receiver(s) is sibling (ref. = no) | Note ...: not applicable | Note ...: not applicable | Note ...: not applicable | -0.8 | -7.9 | 6.2 |
| Adult care receiver(s) is parent (ref. = no) | Note ...: not applicable | Note ...: not applicable | Note ...: not applicable | -0.3 | -5.6 | 5.1 |
| Adult care receiver(s) is other family member (ref. = no) | Note ...: not applicable | Note ...: not applicable | Note ...: not applicable | -2.0 | -8.2 | 4.3 |
| Adult care receiver(s) is friend or neighbour (ref. = no) | Note ...: not applicable | Note ...: not applicable | Note ...: not applicable | -1.9 | -9.1 | 5.3 |
| Multiple child care receivers (ref. = 1 child care receiver) | 1.1 | -2.4 | 4.6 | Note ...: not applicable | Note ...: not applicable | Note ...: not applicable |
| Child care receiver(s) lives in household | 12.6Note *** | 7.1 | 18.2 | Note ...: not applicable | Note ...: not applicable | Note ...: not applicable |
| Child care receiver(s) has long-term condition or disability requiring extra care | 3.4 | -1.7 | 8.5 | Note ...: not applicable | Note ...: not applicable | Note ...: not applicable |
| Child care receiver(s) is own child | 37.7Note *** | 27.5 | 47.9 | Note ...: not applicable | Note ...: not applicable | Note ...: not applicable |
| Child care receiver(s) is grandchild | 3.3 | -5.2 | 11.8 | Note ...: not applicable | Note ...: not applicable | Note ...: not applicable |
| Child care receiver(s) is sibling | 5.7 | -15.3 | 26.7 | Note ...: not applicable | Note ...: not applicable | Note ...: not applicable |
| Child care receiver(s) is other family member | -0.2 | -11.1 | 10.7 | Note ...: not applicable | Note ...: not applicable | Note ...: not applicable |
| Child care receiver(s) is child of friend/neighbour | -3.2 | -10.9 | 4.4 | Note ...: not applicable | Note ...: not applicable | Note ...: not applicable |
| Child care receiver(s) is other relationship | -4.4 | -14.3 | 5.5 | Note ...: not applicable | Note ...: not applicable | Note ...: not applicable |
| Age group of child care receiver (ref. = 0 to 5 years old) | ||||||
| 6 to 14 years old | -4.9Note * | -9.2 | -0.5 | Note ...: not applicable | Note ...: not applicable | Note ...: not applicable |
| Both age groups | -0.9 | -5.7 | 3.9 | Note ...: not applicable | Note ...: not applicable | Note ...: not applicable |
| Gender (ref. = man+)Appendix Table A1 Note 1 | ||||||
| Woman+ | 7.6Note *** | 4.5 | 10.7 | 4.3Note ** | 1.0 | 7.6 |
| Marital status (ref. = married) | ||||||
| Common-law | -1.6 | -6.7 | 3.4 | 1.9 | -3.7 | 7.4 |
| Never married | -4.6 | -11.6 | 2.5 | 4.8 | -1.5 | 11.1 |
| Widowed/separated/divorced | 0.6 | -4.1 | 5.2 | 3.9 | -2.3 | 10.0 |
| Household arrangement (ref. = single generation) | ||||||
| Multi- or skip generation | 2.0 | -6.4 | 10.4 | 0.2 | -9.1 | 9.5 |
| Missing record linkage | -3.8 | -8.9 | 1.3 | 2.8 | -3.2 | 8.8 |
| 2SLGBTQ+Appendix Table A1 Note 2 (ref. = no) | ||||||
| Yes | 0.9 | -6.8 | 8.5 | -3.2 | -9.7 | 3.2 |
| Respondent identifies as having a disabilityAppendix Table A1 Note 3 (ref. = no) | ||||||
| Yes | 0.1 | -5.3 | 5.5 | 4.9 | -1.6 | 11.5 |
| Age group (years) (ref. = 35 to 44) | ||||||
| 15 to 24 | -3.5 | -16.4 | 9.3 | -15.7Note *** | -23.5 | -7.8 |
| 25 to 34 | 5.5 | -0.2 | 11.2 | -2.0 | -10.2 | 6.1 |
| 45 to 54 | -5.7Note * | -11.0 | -0.4 | 0.9 | -5.6 | 7.4 |
| 55 to 64 | -1.9 | -9.6 | 5.7 | 0.6 | -5.2 | 6.5 |
| 65 to 74 | -5.5 | -13.7 | 2.8 | -4.2 | -10.7 | 2.3 |
| 75 or older | -7.4 | -16.6 | 1.8 | -0.1 | -9.9 | 9.8 |
| Racialized groupAppendix Table A1 Note 4 (ref. = non-racialized population) | ||||||
| Racialized population | -1.1 | -5.9 | 3.7 | 0.8 | -6.3 | 7.9 |
| Indigenous identityAppendix Table A1 Note 5 (ref. = not Indigenous) | ||||||
| Indigenous | -0.4 | -10.0 | 9.3 | -3.2 | -15.9 | 9.5 |
| Immigrant status (ref. = not an immigrantAppendix Table A1 Note 6) | ||||||
| Non-recent immigrant (10 years and older) | -6.0Note * | -10.6 | -1.3 | 5.0 | -2.3 | 12.2 |
| Recent immigrant (less than 10 years old) | -4.5 | -11.6 | 2.7 | 1.1 | -8.2 | 10.5 |
| Education (ref. = less than high school) | ||||||
| High school diploma | 0.9 | -6.8 | 8.5 | -5.2 | -14.1 | 3.7 |
| College or trades | 0.1 | -5.3 | 5.5 | -6.2 | -15.0 | 2.6 |
| University | -3.5 | -16.4 | 9.3 | -11.7Note * | -20.7 | -2.7 |
| Employment status (ref. = not employed last week) | ||||||
| Employed last week | -4.5 | -11.6 | 2.7 | -4.6Note * | -9.0 | -0.3 |
... not applicable
Source: Statistics Canada, Canadian Social Survey – Well-being and caregiving, 2022. |
||||||
| Care receiver children (N=2,511) |
Care-dependent adults (N=2,083) |
|||||
|---|---|---|---|---|---|---|
| Odds ratioAppendix Table A2 Note 1 | 95% confidence intervals | Odds ratioAppendix Table A2 Note 1 | 95% confidence intervals | |||
| lower bound | upper bound | lower bound | upper bound | |||
| Unpaid sandwich care | 1.3 | 1.0 | 1.8 | 1.6Note ** | 1.2 | 2.1 |
| Multiple adult care receivers (ref. = 1 adult care receiver) | Note ...: not applicable | Note ...: not applicable | Note ...: not applicable | 1.6Note ** | 1.1 | 2.2 |
| Adult care receiver(s) lives in household | Note ...: not applicable | Note ...: not applicable | Note ...: not applicable | 1.8Note ** | 1.2 | 2.6 |
| Adult care receiver is spouse or partner | Note ...: not applicable | Note ...: not applicable | Note ...: not applicable | 1.1 | 0.6 | 1.8 |
| Adult care receiver(s) is own child (ref. = no) | Note ...: not applicable | Note ...: not applicable | Note ...: not applicable | 1.1 | 0.7 | 1.8 |
| Adult care receiver(s) is sibling (ref. = no) | Note ...: not applicable | Note ...: not applicable | Note ...: not applicable | 1.3 | 0.7 | 2.3 |
| Adult care receiver(s) is parent (ref. = no) | Note ...: not applicable | Note ...: not applicable | Note ...: not applicable | 1.3 | 0.8 | 1.9 |
| Adult care receiver(s) is other family member (ref. = no) | Note ...: not applicable | Note ...: not applicable | Note ...: not applicable | 1.9 | 1.1 | 3.0 |
| Adult care receiver(s) is friend or neighbour (ref. = no) | Note ...: not applicable | Note ...: not applicable | Note ...: not applicable | 1.1 | 0.7 | 1.7 |
| Multiple child care receivers (ref. = 1 child care receiver) | 1.2 | 0.9 | 1.5 | Note ...: not applicable | Note ...: not applicable | Note ...: not applicable |
| Child care receiver(s) lives in household | 2.5Note *** | 1.6 | 4.0 | Note ...: not applicable | Note ...: not applicable | Note ...: not applicable |
| Child care receiver(s) has long-term condition or disability requiring extra care | 1.9Note ** | 1.3 | 2.9 | Note ...: not applicable | Note ...: not applicable | Note ...: not applicable |
| Child care receiver(s) is own child | 1.2 | 0.6 | 2.5 | Note ...: not applicable | Note ...: not applicable | Note ...: not applicable |
| Child care receiver(s) is grandchild | 1.1 | 0.5 | 2.4 | Note ...: not applicable | Note ...: not applicable | Note ...: not applicable |
| Child care receiver(s) is sibling | 0.7 | 0.2 | 2.5 | Note ...: not applicable | Note ...: not applicable | Note ...: not applicable |
| Child care receiver(s) is other family member | 0.9 | 0.3 | 2.6 | Note ...: not applicable | Note ...: not applicable | Note ...: not applicable |
| Child care receiver(s) is child of friend/neighbour | 0.9 | 0.5 | 1.7 | Note ...: not applicable | Note ...: not applicable | Note ...: not applicable |
| Child care receiver(s) is niece/nephew | 0.5 | 0.3 | 1.0 | Note ...: not applicable | Note ...: not applicable | Note ...: not applicable |
| Age group of child care receiver (ref. = 0 to 5 years old) | ||||||
| 6-14 years old | 1.2 | 0.9 | 1.6 | Note ...: not applicable | Note ...: not applicable | Note ...: not applicable |
| Both age groups | 1.0 | 0.7 | 1.5 | Note ...: not applicable | Note ...: not applicable | Note ...: not applicable |
| Gender (ref. = man+)Appendix Table A2 Note 2 | ||||||
| Woman+ | 1.0 | 0.7 | 1.2 | 1.3Note * | 1.0 | 1.7 |
| Marital status (ref. = married) | ||||||
| Common-law | 0.9 | 0.6 | 1.3 | 1.1 | 0.8 | 1.7 |
| Never married | 1.1 | 0.6 | 1.8 | 1.3 | 0.8 | 1.9 |
| Widowed/separated/divorced | 1.2 | 0.8 | 1.8 | 0.9 | 0.6 | 1.3 |
| Household arrangement (ref. = single generation) | ||||||
| Multi- or skip generation | 0.7 | 0.4 | 1.2 | 1.8 | 0.9 | 3.5 |
| Missing record linkage | 0.7 | 0.5 | 1.0 | 0.7 | 0.4 | 1.1 |
| 2SLGBTQ+Appendix Table A2 Note 3 (ref. = no) | ||||||
| Yes | 1.3 | 0.7 | 2.4 | 1.5 | 0.8 | 2.9 |
| Respondent identifies as having a disabilityAppendix Table A2 Note 4 (ref. = no) | ||||||
| Yes | 1.1 | 0.7 | 1.6 | 1.3 | 0.9 | 1.8 |
| Age group (years) (ref. = 35 to 44) | ||||||
| 15 to 24 | 0.5 | 0.2 | 1.5 | 0.8 | 0.4 | 1.8 |
| 25 to 34 | 0.5Note ** | 0.4 | 0.8 | 0.5Note * | 0.3 | 1.0 |
| 45 to 54 | 0.8 | 0.6 | 1.2 | 1.1 | 0.7 | 1.7 |
| 55 to 64 | 0.7 | 0.4 | 1.2 | 0.8 | 0.5 | 1.2 |
| 65 to 74 | 0.4Note * | 0.2 | 0.8 | 0.7 | 0.4 | 1.2 |
| 75 or older | 0.3Note * | 0.1 | 0.8 | 0.4Note * | 0.2 | 0.9 |
| Racialized groupAppendix Table A2 Note 5 (ref. = non-racialized population) | ||||||
| Racialized population | 1.2 | 0.8 | 1.8 | 1.7Note * | 1.0 | 2.9 |
| Indigenous identityAppendix Table A2 Note 6 (ref. = not Indigenous) | ||||||
| Indigenous | 2.3Note * | 1.0 | 5.2 | 1.0 | 0.4 | 2.5 |
| Immigrant status (ref. = not an immigrantAppendix Table A2 Note 7) | ||||||
| Non-recent immigrant (10 years and older) | 0.8 | 0.6 | 1.2 | 0.9 | 0.6 | 1.5 |
| Recent immigrant (less than 10 years old) | 0.8 | 0.5 | 1.4 | 0.4 | 0.2 | 1.1 |
| Education (ref. = less than high school) | ||||||
| High school diploma | 0.9 | 0.5 | 1.7 | 1.0 | 0.5 | 1.7 |
| College or trades | 1.3 | 0.7 | 2.2 | 1.2 | 0.7 | 2.1 |
| University | 2.3Note ** | 1.3 | 4.1 | 1.6 | 0.9 | 2.8 |
| Employment status (ref. = not employed last week) | ||||||
| Employed last week | 0.9 | 0.7 | 1.2 | 0.9 | 0.7 | 1.3 |
... not applicable
The dependent variable in the logistic regression was recoded into a binary variable. In response to the question, “How has the COVID-19 pandemic affected the average amount of time you spent helping or caring for any of these [children / care-dependent adults] in the past 12 months?”, “it has increased” = 1 and “it has decreased” or “the amount of time has not changed” = 0. Those who did not provide a response were dropped. Source: Statistics Canada, Canadian Social Survey – Well-being and caregiving, 2022. |
||||||
References
Addati, L., U. Cattaneo, V. Esquivel, & Valarino, I. (2018). Care work and care jobs for the future of decent work. Research Report, International Labour Organization [ILO]. Geneva: International Labour Organization.
Angus Reid Institute. (2019). Caregiving in Canada: As population ages, one-in-four Canadians over 30 are looking after loved ones .
Anderson, S., Parmar, J., Dobbs, B., & Tian, P. G. J. (2021). A tale of two solitudes: Loneliness and anxiety of family caregivers caring in community homes and congregate care. International Journal of Environmental Research and Public Health, 18(19), 10010.
Arriagada, P. (2020). The experiences and needs of older caregivers in Canada. Insights on Canadian Society. Statistics Canada Catalogue no. 75-006-X.
Beach, S. R., Schulz, R., Donovan, H., & Rosland, A-M. (2021). Family caregiving during the COVID-19 pandemic. The Gerontologist 61(5): 650-660.
Boyczuk, A. M., & Fletcher, P. C. (2016). The ebbs and flows: Stresses of sandwich generation caregivers. Journal of Adult Development 23: 51-61.
Fast, J., Duncan, K. A., Keating, N. C., & Kim, C. (2023). Valuing the contributions of family caregivers to the care economy. Journal of Family and Economic Issues.
Keating, N. C., Fast, J. E., Lero, D. S., Lucas, S. J., & Eales, J. (2014). A taxonomy of the economic costs of family care to adults. The Journal of the Economics of Ageing 3: 11-20.
Hodgdon, B. T., Wong, J. D., & Pittman, P. S. (2023). The psychological well-being and physical health of sandwiched caregivers in the United States: A scoping review. Families, Systems, & Health 41(2): 240-255.
Leclerc, K. (2020). Caring for their Children: Impacts of COVID-19 on Parents. StatCan COVID-19: Data to Insights for a Better Canada. Statistics Canada, catalogue no. 45280001.
Luna, S., Rivera, F., & Ramos, P. (2021). Dual caregiving by grandmothers with older relatives: Personal factors influencing health and stress. Journal of Health Psychology 26(11): 1882-1900.
Moyser, M., & Burlock, A. (2018). Time use: Total work burden, unpaid work, and leisure. Women in Canada: A gender-based statistical report. Statistics Canada catalogue no. 89-503-X.
Miller, D. A. (1981). The ‘sandwich’ generation: Adult children of the aging. Social Work 26(5): 419-423.
Parker, K., & Patten, E. (2013). The sandwich generation: Rising financial burdens for middle-aged Americans. Pew Research Center. January 30.
Peng, I. (2019). The care economy: A new research framework. Sciences Po LIEPP Working Paper no. 89.
Rubin, R. M., & White-Means, S. I. (2009). Informal caregiving: Dilemmas of sandwiched caregivers. Journal of Family and Economic Issues 30: 252-267.
Sánchez, A. R., Fasang, A. E., & Harkness, S. (2021). Gender division of housework during the COVID-19 pandemic: Temporary shocks or durable change? Demographic Research 45: 1297-1316.
Shafer, K., Scheibling, C. and Milkie, M.A. (2020). The division of domestic labor before and during the covid-19 pandemic in Canada: Stagnation versus shifts in fathers’ contributions. Canadian Review of Sociology/Revue canadienne de sociologie, 57: 523-549.
Sinha, M. (2012). Portrait of caregivers, 2012. Spotlight on Canadians: Results from the General Social Survey. Statistics Canada Catalogue no. 89-652-X, no. 001.
Statistics Canada. (2022a). Census in brief: A generational portrait of Canada’s aging population from the 2021 Census. Statistics Canada Catalogue no. 98-200-X, issue 2021003.
Statistics Canada. (2022b). More than half of women provide care to children and care-dependent adults in Canada, 2022. The Daily, November 8. Statistics Canada Catalogue no. 11-001-X.
Statistics Canada. (2022c). Families, households, and marital status reference guide, Census of Population 2021. Statistics Canada catalogue no. 98-500-X, issue 2021002.
UN Women. (2018). Promoting women’s economic empowerment: Recognizing and investing in the care economy.
Vlachantoni, A., Evandrou, M., Falkingham, J., & Gomez-Leon, M. (2020). Caught in the middle in mid-life: Provision of care across multiple generations. Ageing and Society, 40(7): 1490–1510.
Williams, C. (2004). The sandwich generation. Perspectives on Labour and Income 5(9). Statistics Canada Catalogue no. 75-001-XIE.
Wray, D., Badets, J., Keating, N., & Fast, J. (2023). Canada’s care economy: A conceptual framework. Spotlight on Canadians: Results from the General Social Survey. Statistics Canada catalogue no. 89-652-X.
- Date modified: