
The duration of first unions: A comparative analysis between landed immigrants and Canadian-born individuals
by Clémence Zossou (Diversity and Sociocultural Statistics) and Solène Lardoux (Université de Montréal)
For several decades, the family institution has undergone changes, including the deinstitutionalization of marriage,Note which is becoming more unstable. In Canada, there is an increase in the complexity of family structures and changes in the forms of conjugal life, including the steady growth in common-law unions and the fact that these are not only a path to married life, but also a setting in which to have and bring up children.Note All these changes have resulted in a higher prevalence of second marriages and common-law unions,Note which could result in an increasing number of children living in step-families, delayed childbearing and even reduced fertility.
At the same time, the immigrant population in Canada continues to grow. In 2021, landed immigrantsNote accounted for nearly one-quarter (23%) of the Canadian population, or more than 8.3 million people. This is up from about 7.5 million in 2016. Marital practices in the country of origin can contrast with the practices in the receiving country. Furthermore, once immigrants arrive in Canada, they experience changes associated with settling in a new country with different lifestyles and must adapt to new life situations. It can thus be assumed that union formation and dissolution behavioursNote differ between landed immigrants and Canadian-born individuals. According to data from the General Social Survey (GSS) – Family, in 2017, Canadian-born individuals (31%) were more likely than those born outside the country (13%) to enter a second or subsequent union.Note However, despite numerous studies on union dissolution,Note none examined the immigrant population.
Aiming at filling this knowledge gap in the Canadian literature on union stability among immigrants, this article analyzes the duration of first unionsNote (be it a marriage or a common-law union) by comparing Canadian-born individuals and landed immigrants. Firstly, the timing of the dissolution of first unions—a process called “union dissolution” for better readability—is analyzed by landed immigrant status and sex.Note Next, the extent to which certain sociodemographic characteristics influence the risk of these unions dissolving is examined. The analysis draws on historical data from the 2017 GSS – Family, applies survival analysis methods, and focuses on respondents who were 20 years of age or older at the time of the survey and were or had ever been in a couple relationship, marriage or common-law union.
Union dissolution is more common among the Canadian-born, compared to landed immigrants
In 2017, nearly two in five people aged 20 and older (36%) in Canada had experienced the dissolution of their first union (Table 1). Compared with landed immigrants (24%), Canadian-born individuals (41%) were relatively more likely to have ended their first union. Among those born in Canada, union dissolution was less likely for men (38%) than for women (43%). Conversely, there was no statistically significant difference between men and women among landed immigrants.
For the population as a whole, union dissolution was more common among those in the baby boom generation—born from 1945 to 1964— (40%) compared with those in previous cohorts (1917 to 1944) (31%) and those in younger cohorts (1965 to 1997) (34%). When immigrant status is considered, the same pattern is observed among Canadian-born individuals. In contrast, among landed immigrants, there was no difference between those born from 1945 to 1964 and those born from 1917 to 1944. Furthermore, among younger generations (those born from 1965 to 1997), union dissolution was more than twice as common among Canadian-born individuals (40%) than among landed immigrants (18%).
| Both sexes | Men | Women | |||||||
|---|---|---|---|---|---|---|---|---|---|
| Total population | Canadian-born individuals | Landed immigrants | All men | Canadian-born men | Landed immigrants | All women | Canadian-born women | Landed immigrants | |
| percent | |||||||||
| Total population | 36.0 | 40.6Note * | 23.5 | 34.3 | 38.4Note ** | 22.7 | 37.7 | 42.8Note *** | 24.3 |
| Birth cohort | |||||||||
| 1917 to 1944 | 30.6Table 1 Note † | 32.1Table 1 Note † | 26.4 | 24.9Table 1 Note † | 26.3Table 1 Note † | 21.3Table 1 Note † | 37.4 | 38.6Table 1 Note † | 32.9 |
| 1945 to 1964 (ref.) | 40.4 | 43.0Note * | 31.7 | 39.6 | 41.5Note ** | 31.2 | 41.2 | 44.2Note *** | 32.2 |
| 1965 to 1997 | 33.8Table 1 Note † | 40.3Table 1 Note † Note * | 17.8Table 1 Note † | 32.2Table 1 Note † | 38.0Table 1 Note † Note ** | 17.7Table 1 Note † | 35.3Table 1 Note † | 42.5Note *** | 17.8Table 1 Note † |
| Age at the beginning of the union | |||||||||
| Younger than 25 years (ref.) | 43.2 | 46.6Note * | 29.8 | 42.7 | 44.8Note ** | 31.3 | 43.5 | 47.9Note *** | 29.0 |
| 25 years and older | 26.1Table 1 Note † | 30.2Table 1 Note † Note * | 19.0Table 1 Note † | 26.2Table 1 Note † | 30.3Table 1 Note † Note ** | 19.0Table 1 Note † | 25.9Table 1 Note † | 30.2Table 1 Note † Note *** | 18.9Table 1 Note † |
| Union type | |||||||||
| Marriage (ref.) | 24.2 | 28.5Note * | 17.6 | 20.8 | 24.3Note ** | 15.0 | 27.5 | 32.7Note *** | 20.1 |
| Common-law union followed by marriage | 32.3Table 1 Note † | 32.5Table 1 Note † | 31.1Table 1 Note † | 33.1Table 1 Note † | 31.8Table 1 Note † | 39.4Table 1 Note † | 31.7Table 1 Note † | 33.1Note *** | 24.6 |
| Common-law union | 64.6Table 1 Note † | 65.4Table 1 Note † | 63.7Table 1 Note † | 64.3Table 1 Note † | 65.1Table 1 Note † | 63.0Table 1 Note † | 65.0Table 1 Note † | 65.7Table 1 Note † | 64.6Table 1 Note † |
| Children born or adopted during this union | |||||||||
| Yes | 25.9Table 1 Note † | 29.4Table 1 Note † Note * | 17.4Table 1 Note † | 22.9Table 1 Note † | 26.2Table 1 Note † Note ** | 14.3Table 1 Note † | 28.7Table 1 Note † | 32.4Table 1 Note † Note *** | 20.4Table 1 Note † |
| No (ref.) | 58.8 | 63.2Note * | 44.2 | 58.5 | 61.6Note ** | 48.9 | 59.2 | 65.0Note *** | 38.9 |
| Highest level of education | |||||||||
| Below bachelor level (ref.) | 39.7 | 43.1Note * | 27.7 | 37.7 | 40.5Note ** | 26.9 | 41.7 | 45.6Note *** | 28.4 |
| Bachelor’s degree or higher | 28.1Table 1 Note † Table 1 Note ‡ | 34.1Table 1 Note † Note * | 18.0Table 1 Note † | 26.8Table 1 Note † | 32.3Table 1 Note † Note ** | 17.8Table 1 Note † | 29.4Table 1 Note † | 35.7Table 1 Note † Note *** | 18.2Table 1 Note † |
| Racialized population Table 1 Note 1 | |||||||||
| Yes | 19.2Table 1 Note † | 30.5Table 1 Note † Note * | 17.6Table 1 Note † | 18.2Table 1 Note † | 30.2Note ** | 16.0Table 1 Note † | 20.1Table 1 Note † | 30.8Table 1 Note † Note *** | 19.3Table 1 Note † |
| No (ref.) | 40.2 | 41.0Note * | 34.0 | 38.2 | 38.7 | 34.2 | 42.0 | 43.2Note *** | 33.7 |
| Engaged in religious or spiritual activities on an individual basis in the previous 12 months | |||||||||
| Yes (ref.) | 33.7 | 38.9Note * | 22.3 | 30.6 | 35.2Note ** | 20.5 | 36.1 | 41.7Note *** | 23.9 |
| No | 39.3Table 1 Note † | 42.7Table 1 Note † Note * | 25.6 | 38.2Table 1 Note † | 41.2Table 1 Note † Note ** | 25.9Table 1 Note † | 40.7Table 1 Note † | 44.6Note *** | 25.2 |
| Separated or divorced parents | |||||||||
| Yes | 49.3Table 1 Note † | 51.7Table 1 Note † Note * | 35.7Table 1 Note † | 46.6Table 1 Note † | 47.4Table 1 Note † | 38.5Table 1 Note † | 51.5Table 1 Note † | 55.4Table 1 Note † Note *** | 33.7Table 1 Note † |
| No (ref.) | 32.0 | 36.4Note * | 21.5 | 30.8 | 35.0Note ** | 20.9 | 33.1 | 37.9Note *** | 22.1 |
| Place where the union began | |||||||||
| In Canada | Note ...: not applicable | Note ...: not applicable | 25.7Table 1 Note † | Note ...: not applicable | Note ...: not applicable | 24.1Table 1 Note † | Note ...: not applicable | Note ...: not applicable | 27.6Table 1 Note † |
| Outside Canada and still ongoing at the time of immigration (ref.) | Note ...: not applicable | Note ...: not applicable | 13.2 | Note ...: not applicable | Note ...: not applicable | 12.1 | Note ...: not applicable | Note ...: not applicable | 14.1 |
| Number of years since immigration | |||||||||
| Less than 10 years | Note ...: not applicable | Note ...: not applicable | 11.7Table 1 Note † | Note ...: not applicable | Note ...: not applicable | 13.1Table 1 Note † | Note ...: not applicable | Note ...: not applicable | 10.3Table 1 Note † |
| 10 to 29 years | Note ...: not applicable | Note ...: not applicable | 20.6Table 1 Note † | Note ...: not applicable | Note ...: not applicable | 19.8Table 1 Note † | Note ...: not applicable | Note ...: not applicable | 21.4Table 1 Note † |
| 30 years or more (ref.) | Note ...: not applicable | Note ...: not applicable | 34.7 | Note ...: not applicable | Note ...: not applicable | 32.7 | Note ...: not applicable | Note ...: not applicable | 36.8 |
... not applicable
|
|||||||||
In 2017, union dissolution was more common among individuals whose first union was a common-law union (65%), compared with those whose first union began with a marriage (24%). In comparison with those whose first union began with a marriage, union dissolution was slightly more common among those who married their partner following a common-law union (32%). These differences in the prevalence of dissolution by union type are similar among Canadian-born individuals and landed immigrants. However, the latter stand out by an even lower prevalence of dissolution when the union began with a marriage (18%).
Union dissolution was less common among individuals who became parents during their first union (26%) than among those who did not (59%). This difference was more pronounced among landed immigrants than among Canadian-born individuals.
Data from the 2017 GSS also show that individuals with an educational attainment below a bachelor’s degree (40%) were more likely to have experienced the dissolution of their first union than those with a bachelor’s degree or higher (28%). This pattern by level of educational attainment were similar between Canadian-born individuals and landed immigrants.
Union dissolution was less common among racialized groupsNote (19%), compared with the rest of the population (40%). This difference in prevalence was greater among landed immigrants than among Canadian-born individuals.
Union dissolution was 1.5 times more common among individuals whose parents had separated or divorced (49%), compared with those whose parents were still together (32%). The same trend is observed among those born in Canada and landed immigrants.
Finally, among landed immigrants, first union dissolution was less common for individuals whose union was ongoing at the time of immigration (13%) than for those whose first union began after they arrived in Canada (26%). Furthermore, the prevalence of union dissolution increases with the number of years since immigrants arrived in the country.
Analysis of the timing of first union dissolution
The duration of the first union varies depending on landed immigrant status
Analyzing the timing of first union dissolution determines the likelihood of dissolution over time. The proportion of persons in ongoing first unions decreases from 96% after the first year of the union to its lowest level (58%) after the 40th year (Chart 1). Five years after the start of the union, 84% of those in their first union remained together. After the 10th year, this was the case for 75%, 70% after the 15th year and 65% after the 20th year of the first union.
The same analysis is now repeated by sex and landed immigrant status. The first unions of those born in Canada are much less durable than those of landed immigrants. Among those born in Canada, men experienced first union dissolution later than women. For example, twenty years after the start of the union, 59% of women were still in their first union, compared with 63% of men. Finally, for landed immigrants, there is no difference in the curves for both sexes; immigrant men and women experienced union dissolution at the same pace.

Data table for Chart 1
| Years | Canadian-born men | Landed immigrant men | Landed immigrant women | Canadian-born women | Total population |
|---|---|---|---|---|---|
| percent | |||||
| 0 | 100 | 100 | 100 | 100 | 100 |
| 1 | 96 | 97 | 99 | 95 | 96 |
| 2 | 91 | 95 | 96 | 91 | 92 |
| 3 | 87 | 93 | 94 | 87 | 89 |
| 4 | 84 | 92 | 93 | 83 | 86 |
| 5 | 81 | 91 | 92 | 80 | 84 |
| 6 | 79 | 89 | 91 | 78 | 82 |
| 7 | 77 | 87 | 90 | 76 | 80 |
| 8 | 76 | 87 | 88 | 74 | 78 |
| 9 | 74 | 86 | 88 | 72 | 77 |
| 10 | 72 | 85 | 87 | 71 | 75 |
| 11 | 71 | 84 | 85 | 69 | 74 |
| 12 | 70 | 83 | 84 | 68 | 73 |
| 13 | 69 | 82 | 83 | 67 | 71 |
| 14 | 68 | 82 | 82 | 66 | 71 |
| 15 | 67 | 82 | 81 | 64 | 70 |
| 16 | 66 | 81 | 80 | 63 | 69 |
| 17 | 65 | 81 | 80 | 62 | 68 |
| 18 | 64 | 80 | 79 | 62 | 67 |
| 19 | 64 | 80 | 78 | 60 | 66 |
| 20 | 63 | 79 | 77 | 59 | 65 |
| 21 | 62 | 79 | 76 | 58 | 64 |
| 22 | 61 | 78 | 76 | 57 | 64 |
| 23 | 61 | 78 | 76 | 56 | 63 |
| 24 | 60 | 77 | 76 | 56 | 62 |
| 25 | 60 | 77 | 75 | 55 | 62 |
| 26 | 59 | 76 | 74 | 54 | 61 |
| 27 | 58 | 76 | 74 | 54 | 61 |
| 28 | 58 | 75 | 73 | 54 | 60 |
| 29 | 58 | 75 | 73 | 53 | 60 |
| 30 | 57 | 75 | 72 | 53 | 60 |
| 31 | 57 | 74 | 72 | 53 | 59 |
| 32 | 57 | 73 | 71 | 52 | 59 |
| 33 | 57 | 72 | 71 | 52 | 59 |
| 34 | 57 | 72 | 71 | 52 | 58 |
| 35 | 56 | 72 | 71 | 51 | 58 |
| 36 | 56 | 72 | 70 | 51 | 58 |
| 37 | 56 | 72 | 70 | 51 | 58 |
| 38 | 56 | 71 | 70 | 51 | 58 |
| 39 | 56 | 71 | 70 | 51 | 58 |
| 40 | 56 | 71 | 70 | 51 | 58 |
| Source: Statistics Canada, General Social Survey – Family, 2017. | |||||
Among landed immigrants, the place where the first union was formed is another important factor to consider to better understand the risk of union dissolution (Chart 2). More than 80% of landed immigrants whose first union began outside the country and was ongoing at the time of immigration were still in their first union by its 40th year, while this is the case for 67% of immigrants whose first union was formed once in Canada.
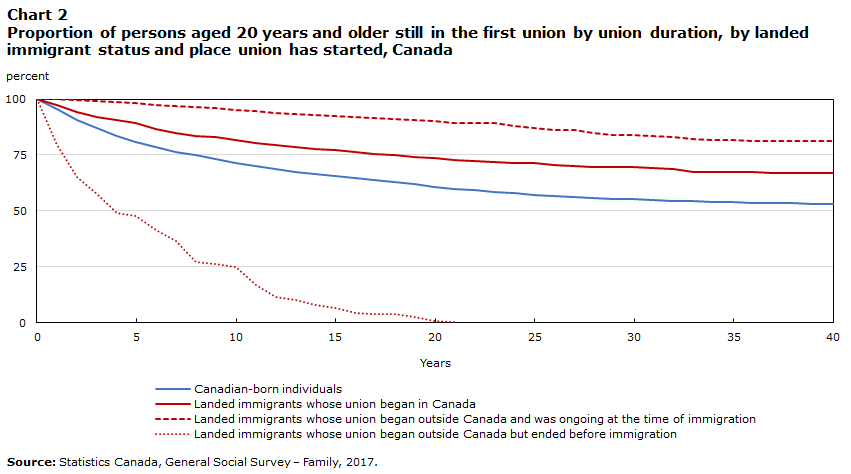
Data table for Chart 2
| Years | Canadian-born individuals | Landed immigrants whose union began in Canada | Landed immigrants whose union began outside Canada and was ongoing at the time of immigration | Landed immigrants whose union began outside Canada but ended before immigration |
|---|---|---|---|---|
| percent | ||||
| 0 | 100 | 100 | 100 | 100 |
| 1 | 95 | 97 | 100 | 80 |
| 2 | 91 | 94 | 100 | 65 |
| 3 | 87 | 92 | 99 | 58 |
| 4 | 84 | 91 | 99 | 49 |
| 5 | 81 | 89 | 98 | 48 |
| 6 | 79 | 87 | 97 | 42 |
| 7 | 76 | 85 | 97 | 36 |
| 8 | 75 | 84 | 97 | 27 |
| 9 | 73 | 83 | 96 | 26 |
| 10 | 71 | 82 | 95 | 25 |
| 11 | 70 | 80 | 95 | 17 |
| 12 | 69 | 79 | 94 | 11 |
| 13 | 68 | 79 | 93 | 10 |
| 14 | 67 | 78 | 93 | 8 |
| 15 | 65 | 77 | 93 | 7 |
| 16 | 65 | 76 | 92 | 4 |
| 17 | 64 | 76 | 92 | 4 |
| 18 | 63 | 75 | 91 | 4 |
| 19 | 62 | 74 | 91 | 3 |
| 20 | 61 | 73 | 90 | 1 |
| 21 | 60 | 73 | 89 | 0 |
| 22 | 59 | 72 | 89 | Note ...: not applicable |
| 23 | 59 | 72 | 89 | Note ...: not applicable |
| 24 | 58 | 72 | 88 | Note ...: not applicable |
| 25 | 57 | 71 | 87 | Note ...: not applicable |
| 26 | 57 | 71 | 86 | Note ...: not applicable |
| 27 | 56 | 70 | 86 | Note ...: not applicable |
| 28 | 56 | 70 | 85 | Note ...: not applicable |
| 29 | 55 | 70 | 84 | Note ...: not applicable |
| 30 | 55 | 70 | 84 | Note ...: not applicable |
| 31 | 55 | 69 | 83 | Note ...: not applicable |
| 32 | 54 | 69 | 83 | Note ...: not applicable |
| 33 | 54 | 68 | 82 | Note ...: not applicable |
| 34 | 54 | 68 | 82 | Note ...: not applicable |
| 35 | 54 | 67 | 82 | Note ...: not applicable |
| 36 | 54 | 67 | 81 | Note ...: not applicable |
| 37 | 54 | 67 | 81 | Note ...: not applicable |
| 38 | 53 | 67 | 81 | Note ...: not applicable |
| 39 | 53 | 67 | 81 | Note ...: not applicable |
| 40 | 53 | 67 | 81 | Note ...: not applicable |
|
... not applicable Source: Statistics Canada, General Social Survey – Family, 2017. |
||||
The timing of first union dissolution of landed immigrants (men) and Canadian-born individuals varies depending on birth cohort
Among Canadian-born individuals, men from older generations (those born from 1917 to 1944) experienced first union dissolution later than those born in the generations that followed (Chart 3-a). Men born in Canada from 1965 to 1997 ended their unions earlier and in greater numbers. Conversely, the probabilities of first union dissolution among landed immigrant men followed narrower patterns. However, as with their Canadian-born counterparts, the timing of the first union dissolution of those born from 1917 to 1944 occurred later than that among more recent cohorts. The curves for the 1945 to 1964 cohort and the 1965 to 1997 cohort intersect occasionally. These two groups experienced union dissolution at a similar pace.
Among women (Chart 3-b), the timing of first union dissolution for landed immigrants was virtually the same across birth cohorts. The timing of union dissolution for landed immigrants is similar to that of women born in Canada in the pre-baby boom generation (1917 to 1944). Among women born in Canada, the timing of the dissolution varies by birth cohort. For example, twenty years after the start of the union, 76% of from the 1917 to 1944 cohort were still in this union, compared with 65% of those born from 1945 to 1964 and 51% of those born from 1965 to 1977.

Data table for Chart 3-a
| Years | Men born in Canada from 1917 to 1944 | Men born in Canada from 1945 to 1964 | Men born in Canada from 1965 to 1997 | Landed immigrant men born from 1917 to 1944 | Landed immigrant men born from 1945 to 1964 | Landed immigrant men born from 1965 to 1997 |
|---|---|---|---|---|---|---|
| percent | ||||||
| 0 | 100 | 100 | 100 | 100 | 100 | 100 |
| 1 | 99 | 97 | 94 | 99 | 98 | 97 |
| 2 | 98 | 93 | 87 | 99 | 96 | 94 |
| 3 | 98 | 90 | 83 | 98 | 93 | 92 |
| 4 | 96 | 87 | 79 | 98 | 91 | 91 |
| 5 | 96 | 85 | 76 | 97 | 90 | 90 |
| 6 | 94 | 83 | 73 | 97 | 88 | 87 |
| 7 | 93 | 81 | 70 | 97 | 86 | 86 |
| 8 | 93 | 79 | 69 | 97 | 85 | 85 |
| 9 | 92 | 77 | 67 | 96 | 85 | 85 |
| 10 | 92 | 76 | 65 | 96 | 83 | 85 |
| 11 | 92 | 74 | 63 | 96 | 82 | 83 |
| 12 | 90 | 73 | 61 | 96 | 81 | 82 |
| 13 | 89 | 72 | 60 | 95 | 80 | 81 |
| 14 | 89 | 71 | 58 | 95 | 79 | 81 |
| 15 | 88 | 70 | 57 | 95 | 79 | 81 |
| 16 | 88 | 69 | 56 | 94 | 78 | 81 |
| 17 | 87 | 68 | 56 | 94 | 77 | 81 |
| 18 | 87 | 67 | 55 | 94 | 76 | 81 |
| 19 | 86 | 67 | 54 | 94 | 76 | 81 |
| 20 | 85 | 66 | 52 | 93 | 75 | 80 |
| 21 | 84 | 66 | 51 | 92 | 75 | 80 |
| 22 | 83 | 65 | 51 | 92 | 74 | 79 |
| 23 | 83 | 64 | 51 | 92 | 74 | 79 |
| 24 | 82 | 63 | 50 | 90 | 73 | 74 |
| 25 | 81 | 63 | 50 | 90 | 73 | 74 |
| 26 | 81 | 62 | 50 | 89 | 73 | 74 |
| 27 | 79 | 62 | 50 | 88 | 73 | 74 |
| 28 | 79 | 61 | 50 | 88 | 72 | 74 |
| 29 | 78 | 61 | 50 | 87 | 71 | 74 |
| 30 | 78 | 60 | 50 | 87 | 71 | 74 |
| 31 | 77 | 60 | 50 | 87 | 71 | 74 |
| 32 | 77 | 60 | 50 | 86 | 70 | 74 |
| 33 | 77 | 60 | 50 | 83 | 69 | 74 |
| 34 | 77 | 60 | 50 | 83 | 69 | 74 |
| 35 | 76 | 59 | Note ...: not applicable | 83 | 69 | Note ...: not applicable |
| 36 | 76 | 59 | Note ...: not applicable | 83 | 69 | Note ...: not applicable |
| 37 | 76 | 59 | Note ...: not applicable | 83 | 69 | Note ...: not applicable |
| 38 | 76 | 59 | Note ...: not applicable | 83 | 69 | Note ...: not applicable |
| 39 | 76 | 59 | Note ...: not applicable | 83 | 69 | Note ...: not applicable |
| 40 | 76 | 59 | Note ...: not applicable | 83 | 69 | Note ...: not applicable |
|
... not applicable Source: Statistics Canada, General Social Survey – Family, 2017. |
||||||

Data table for Chart 3-b
| Years | Women born in Canada from 1917 to 1944 | Women born in Canada from 1945 to 1964 | Women born in Canada from 1965 to 1997 | Landed immigrant women born from 1917 to 1944 | Landed immigrant women born from 1945 to 1964 | Landed immigrant women born from 1965 to 1997 |
|---|---|---|---|---|---|---|
| percent | ||||||
| 0 | 100 | 100 | 100 | 100 | 100 | 100 |
| 1 | 100 | 97 | 93 | 99 | 98 | 99 |
| 2 | 98 | 94 | 87 | 99 | 97 | 95 |
| 3 | 98 | 91 | 83 | 97 | 95 | 94 |
| 4 | 97 | 88 | 77 | 97 | 93 | 93 |
| 5 | 96 | 86 | 74 | 96 | 92 | 92 |
| 6 | 95 | 83 | 71 | 95 | 90 | 90 |
| 7 | 94 | 81 | 68 | 95 | 89 | 89 |
| 8 | 94 | 80 | 66 | 93 | 87 | 89 |
| 9 | 93 | 78 | 64 | 93 | 86 | 88 |
| 10 | 90 | 77 | 62 | 92 | 85 | 87 |
| 11 | 89 | 75 | 60 | 90 | 84 | 86 |
| 12 | 89 | 74 | 59 | 88 | 83 | 85 |
| 13 | 87 | 73 | 58 | 88 | 82 | 83 |
| 14 | 85 | 72 | 57 | 88 | 81 | 82 |
| 15 | 83 | 71 | 55 | 87 | 80 | 82 |
| 16 | 82 | 70 | 54 | 87 | 79 | 81 |
| 17 | 80 | 69 | 54 | 86 | 78 | 80 |
| 18 | 79 | 68 | 53 | 86 | 77 | 80 |
| 19 | 78 | 66 | 52 | 84 | 76 | 79 |
| 20 | 76 | 65 | 51 | 82 | 75 | 79 |
| 21 | 76 | 64 | 49 | 81 | 74 | 78 |
| 22 | 75 | 63 | 47 | 81 | 74 | 78 |
| 23 | 74 | 62 | 47 | 81 | 74 | 78 |
| 24 | 73 | 62 | 46 | 80 | 74 | 78 |
| 25 | 73 | 61 | 45 | 79 | 73 | 75 |
| 26 | 71 | 60 | 45 | 77 | 72 | 75 |
| 27 | 70 | 60 | 45 | 77 | 72 | 75 |
| 28 | 69 | 60 | 45 | 75 | 71 | 75 |
| 29 | 69 | 59 | 44 | 74 | 71 | 75 |
| 30 | 68 | 59 | 44 | 74 | 71 | 75 |
| 31 | 68 | 58 | 44 | 74 | 70 | 75 |
| 32 | 67 | 58 | 44 | 74 | 70 | 75 |
| 33 | 67 | 58 | 44 | 73 | 70 | 75 |
| 34 | 66 | 57 | 44 | 72 | 70 | 75 |
| 35 | 66 | 57 | 44 | 72 | 70 | 75 |
| 36 | 66 | 57 | 44 | 72 | 69 | 75 |
| 37 | 66 | 57 | Note ...: not applicable | 72 | 69 | Note ...: not applicable |
| 38 | 65 | 56 | Note ...: not applicable | 72 | 69 | Note ...: not applicable |
| 39 | 65 | 56 | Note ...: not applicable | 72 | 69 | Note ...: not applicable |
| 40 | 65 | 56 | Note ...: not applicable | 71 | 69 | Note ...: not applicable |
|
... not applicable Source: Statistics Canada, General Social Survey – Family, 2017. |
||||||
First union dissolution occurs earlier among those with an education below bachelor level
Charts 4-a and 4-b show survival curves based on education level and landed immigrant status among men and women. People with more education experience later union dissolution than those with less education. For landed immigrants, the influence of education level on the timing of first union dissolution is evident since the onset of the union. From the first years after union formation, a difference in the proportion of individuals still in their first union can indeed be observed between immigrants with a bachelor’s degree or higher and those with a level of education below a bachelor’s degree. For Canadian-born individuals, the difference between those with higher and lower education levels only becomes apparent ten years after the start of the union.
The same trend can be seen among men and women. For example, in the 20th year after the start of the first union, 76% of landed immigrants (men) with a level of education below a bachelor’s degree were still in their first union, compared with 84% of those with a bachelor’s degree or higher (Chart 4-a). Among women, at the same duration since the start of the union, 75% of landed immigrants whose educational attainment is lower than a bachelor’s degree were still in their first union, compared with 81% of those with a bachelor’s degree or higher (Chart 4-b).

Data table for Chart 4-a
| Years | Canadian-born men whose highest level of education is below bachelor level | Canadian-born men whose highest level of education is a bachelor’s degree or higher | Landed immigrant men whose highest level of education is below bachelor level | Landed immigrant men whose highest level of education is a bachelor’s degree or higher |
|---|---|---|---|---|
| percent | ||||
| 0 | 100 | 100 | 100 | 100 |
| 1 | 96 | 96 | 97 | 98 |
| 2 | 91 | 90 | 94 | 96 |
| 3 | 87 | 87 | 92 | 95 |
| 4 | 84 | 84 | 91 | 93 |
| 5 | 82 | 81 | 89 | 93 |
| 6 | 80 | 79 | 86 | 92 |
| 7 | 77 | 77 | 85 | 90 |
| 8 | 75 | 76 | 84 | 90 |
| 9 | 74 | 75 | 83 | 89 |
| 10 | 72 | 74 | 83 | 89 |
| 11 | 70 | 73 | 81 | 87 |
| 12 | 69 | 72 | 80 | 86 |
| 13 | 68 | 71 | 79 | 86 |
| 14 | 67 | 71 | 79 | 86 |
| 15 | 65 | 70 | 79 | 85 |
| 16 | 64 | 69 | 78 | 85 |
| 17 | 64 | 69 | 78 | 85 |
| 18 | 63 | 68 | 77 | 84 |
| 19 | 62 | 68 | 76 | 84 |
| 20 | 61 | 68 | 76 | 84 |
| 21 | 60 | 67 | 75 | 83 |
| 22 | 60 | 67 | 75 | 83 |
| 23 | 59 | 67 | 75 | 82 |
| 24 | 58 | 66 | 74 | 80 |
| 25 | 57 | 66 | 74 | 80 |
| 26 | 57 | 66 | 73 | 80 |
| 27 | 56 | 65 | 73 | 78 |
| 28 | 56 | 65 | 73 | 77 |
| 29 | 56 | 64 | 72 | 77 |
| 30 | 55 | 64 | 72 | 77 |
| 31 | 55 | 64 | 72 | 77 |
| 32 | 55 | 63 | 71 | 76 |
| 33 | 55 | 63 | 69 | 76 |
| 34 | 55 | 63 | 69 | 76 |
| 35 | 54 | 63 | 69 | 76 |
| 36 | 54 | 63 | 69 | 75 |
| 37 | 54 | 63 | 68 | 75 |
| 38 | 54 | 63 | 68 | 75 |
| 39 | 54 | 62 | 68 | 75 |
| 40 | 54 | 62 | 68 | 75 |
| Source: Statistics Canada, General Social Survey – Family, 2017. | ||||

Data table for Chart 4-b
| Years | Canadian-born women whose highest level of education is below bachelor level | Canadian-born women whose highest level of education is a bachelor’s degree or higher | Landed immigrant women whose highest level of education is below bachelor level | Landed immigrant women whose highest level of education is a bachelor’s degree or higher |
|---|---|---|---|---|
| percent | ||||
| 0 | 100 | 100 | 100 | 100 |
| 1 | 95 | 96 | 99 | 98 |
| 2 | 91 | 91 | 96 | 97 |
| 3 | 87 | 87 | 94 | 95 |
| 4 | 83 | 82 | 93 | 94 |
| 5 | 80 | 80 | 92 | 93 |
| 6 | 78 | 78 | 90 | 91 |
| 7 | 75 | 76 | 89 | 90 |
| 8 | 74 | 75 | 87 | 90 |
| 9 | 72 | 74 | 87 | 89 |
| 10 | 70 | 72 | 85 | 89 |
| 11 | 69 | 71 | 84 | 88 |
| 12 | 67 | 70 | 82 | 87 |
| 13 | 66 | 69 | 81 | 86 |
| 14 | 65 | 68 | 80 | 86 |
| 15 | 63 | 67 | 79 | 86 |
| 16 | 62 | 67 | 78 | 85 |
| 17 | 61 | 66 | 77 | 84 |
| 18 | 60 | 65 | 76 | 83 |
| 19 | 59 | 64 | 75 | 82 |
| 20 | 58 | 62 | 75 | 81 |
| 21 | 57 | 61 | 73 | 81 |
| 22 | 56 | 60 | 73 | 80 |
| 23 | 55 | 60 | 73 | 80 |
| 24 | 54 | 59 | 73 | 80 |
| 25 | 54 | 59 | 72 | 79 |
| 26 | 53 | 58 | 71 | 78 |
| 27 | 53 | 57 | 71 | 77 |
| 28 | 53 | 57 | 71 | 75 |
| 29 | 52 | 56 | 71 | 75 |
| 30 | 52 | 56 | 70 | 75 |
| 31 | 51 | 55 | 70 | 74 |
| 32 | 51 | 55 | 69 | 74 |
| 33 | 51 | 55 | 69 | 74 |
| 34 | 50 | 54 | 69 | 74 |
| 35 | 50 | 54 | 69 | 74 |
| 36 | 50 | 54 | 69 | 74 |
| 37 | 50 | 54 | 68 | 74 |
| 38 | 50 | 54 | 68 | 74 |
| 39 | 49 | 54 | 68 | 74 |
| 40 | 49 | 54 | 68 | 74 |
| Source: Statistics Canada, General Social Survey – Family, 2017. | ||||
Compared with married people, first union dissolution occurs earlier among those in common-law unions
Marriage plays a key role in union dissolution both among those born in Canada and among landed immigrants. The analysis of dissolution timing shows that individuals whose first union involved a marriage (either direct marriage or a common-law union followed by marriage) experienced a later pace of dissolution of that union than those whose first union was a common-law union (charts 5-a and 5-b). The timing of first union dissolution by union type is very similar for landed immigrants and for those born in Canada, for men and women.
Among men, just under half of landed immigrants (47%) in common-law unions had already broken up by the fifth year since the startcommon-law of the union, compared with 5% of those who were married (Chart 5-a). Moreover, regardless of landed immigrant status, married men showed a similar pace of dissolution before the seventh year. Among men in common-law unions, differences in dissolution timing between landed immigrants and Canadian-born men only become apparent from the 15th year of the union.
The same pattern is observed among women. For example, 51% of Canadian-born women who were in a common-law union had already experienced the dissolution of their union before the fifth year, compared with 8% of those who were married (Chart 5-b). Married women, regardless of their landed immigrant status, experience marriage dissolution faster than married men.
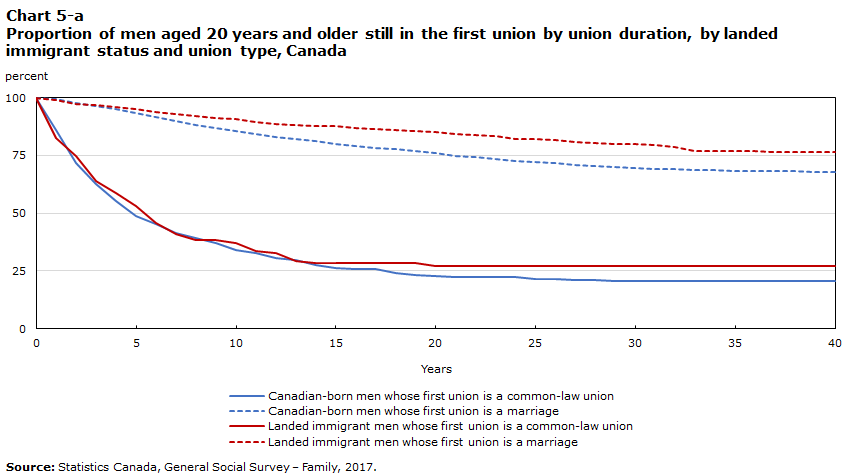
Data table for Chart 5-a
| Years | Canadian-born men whose first union is a common-law union | Canadian-born men whose first union is a marriage | Landed immigrant men whose first union is a common-law union | Landed immigrant men whose first union is a marriage |
|---|---|---|---|---|
| percent | ||||
| 0 | 100 | 100 | 100 | 100 |
| 1 | 86 | 99 | 82 | 99 |
| 2 | 72 | 98 | 75 | 97 |
| 3 | 63 | 96 | 64 | 97 |
| 4 | 55 | 95 | 59 | 96 |
| 5 | 49 | 93 | 53 | 95 |
| 6 | 46 | 92 | 46 | 94 |
| 7 | 41 | 90 | 41 | 93 |
| 8 | 39 | 88 | 38 | 92 |
| 9 | 37 | 87 | 38 | 91 |
| 10 | 34 | 86 | 37 | 91 |
| 11 | 33 | 84 | 34 | 90 |
| 12 | 31 | 83 | 33 | 89 |
| 13 | 30 | 82 | 29 | 88 |
| 14 | 28 | 81 | 28 | 88 |
| 15 | 26 | 80 | 28 | 88 |
| 16 | 26 | 79 | 28 | 87 |
| 17 | 26 | 78 | 28 | 86 |
| 18 | 24 | 78 | 28 | 86 |
| 19 | 23 | 77 | 28 | 86 |
| 20 | 23 | 76 | 27 | 85 |
| 21 | 22 | 75 | 27 | 84 |
| 22 | 22 | 74 | 27 | 84 |
| 23 | 22 | 74 | 27 | 84 |
| 24 | 22 | 73 | 27 | 82 |
| 25 | 22 | 72 | 27 | 82 |
| 26 | 22 | 72 | 27 | 82 |
| 27 | 21 | 71 | 27 | 81 |
| 28 | 21 | 70 | 27 | 80 |
| 29 | 21 | 70 | 27 | 80 |
| 30 | 20 | 70 | 27 | 80 |
| 31 | 20 | 69 | 27 | 79 |
| 32 | 20 | 69 | 27 | 79 |
| 33 | 20 | 69 | 27 | 77 |
| 34 | 20 | 69 | 27 | 77 |
| 35 | 20 | 68 | 27 | 77 |
| 36 | 20 | 68 | 27 | 77 |
| 37 | 20 | 68 | 27 | 77 |
| 38 | 20 | 68 | 27 | 76 |
| 39 | 20 | 68 | 27 | 76 |
| 40 | 20 | 68 | 27 | 76 |
| Source: Statistics Canada, General Social Survey – Family, 2017. | ||||
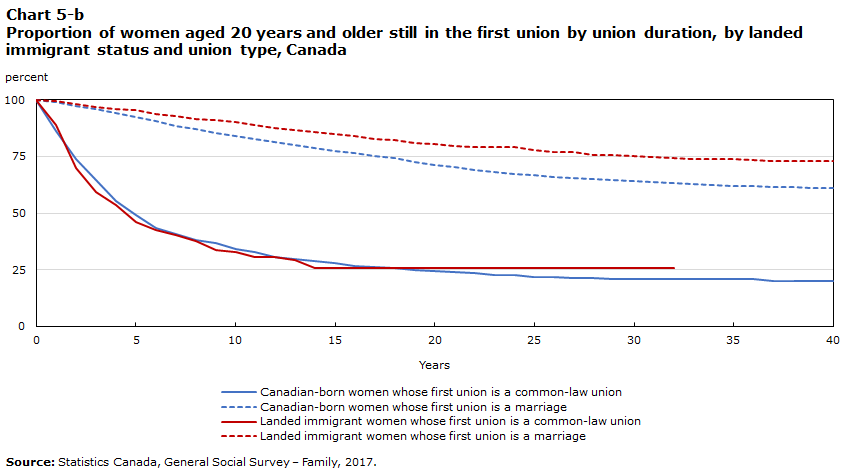
Data table for Chart 5-b
| Years | Canadian-born women whose first union is a common-law union | Canadian-born women whose first union is a marriage | Landed immigrant women whose first union is a common-law union | Landed immigrant women whose first union is a marriage |
|---|---|---|---|---|
| percent | ||||
| 0 | 100 | 100 | 100 | 100 |
| 1 | 86 | 99 | 89 | 99 |
| 2 | 74 | 97 | 70 | 98 |
| 3 | 64 | 96 | 59 | 97 |
| 4 | 55 | 94 | 53 | 96 |
| 5 | 49 | 92 | 46 | 95 |
| 6 | 43 | 91 | 43 | 94 |
| 7 | 41 | 89 | 40 | 93 |
| 8 | 38 | 87 | 38 | 92 |
| 9 | 37 | 85 | 34 | 91 |
| 10 | 34 | 84 | 33 | 90 |
| 11 | 33 | 83 | 31 | 89 |
| 12 | 31 | 81 | 31 | 87 |
| 13 | 30 | 80 | 29 | 87 |
| 14 | 29 | 79 | 26 | 86 |
| 15 | 28 | 77 | 26 | 85 |
| 16 | 27 | 77 | 26 | 84 |
| 17 | 26 | 75 | 26 | 83 |
| 18 | 26 | 74 | 26 | 82 |
| 19 | 25 | 73 | 26 | 81 |
| 20 | 24 | 71 | 26 | 81 |
| 21 | 24 | 70 | 26 | 80 |
| 22 | 24 | 69 | 26 | 79 |
| 23 | 23 | 68 | 26 | 79 |
| 24 | 23 | 67 | 26 | 79 |
| 25 | 22 | 67 | 26 | 78 |
| 26 | 22 | 66 | 26 | 77 |
| 27 | 21 | 65 | 26 | 77 |
| 28 | 21 | 65 | 26 | 76 |
| 29 | 21 | 64 | 26 | 76 |
| 30 | 21 | 64 | 26 | 75 |
| 31 | 21 | 64 | 26 | 75 |
| 32 | 21 | 63 | 26 | 74 |
| 33 | 21 | 63 | Note ...: not applicable | 74 |
| 34 | 21 | 62 | Note ...: not applicable | 74 |
| 35 | 21 | 62 | Note ...: not applicable | 74 |
| 36 | 21 | 62 | Note ...: not applicable | 73 |
| 37 | 20 | 62 | Note ...: not applicable | 73 |
| 38 | 20 | 61 | Note ...: not applicable | 73 |
| 39 | 20 | 61 | Note ...: not applicable | 73 |
| 40 | 20 | 61 | Note ...: not applicable | 73 |
|
... not applicable Source: Statistics Canada, General Social Survey – Family, 2017. |
||||
Engagement in religious or spiritual activities does not affect the timing of first union dissolution for landed immigrant women
Analysis of the timing of first union dissolution among men (Chart 6-a) shows that engagement in religious or spiritual activities in the past year is associated with a later pace of union dissolution, both for those born in Canada and for landed immigrants. However, while the difference between those who had engaged in religious or spiritual activities and those who had not is observable from the early years since the start of the union for Canadian-born men, differences are observed only after the 10th year among landed immigrant men.
Among women, engagement in religious or spiritual activities affects the timing of first union dissolution only among those born in Canada (Chart 6-b). For example, by the 10th year since the start of the union, 86% of landed immigrant women were still in their first union, regardless of whether they had engaged in religious or spiritual activities in the past year. In comparison, among Canadian-born women, this was true for 73% of those who engaged in religious or spiritual activities and for 67% of those who did not.

Data table for Chart 6-a
| Years | Canadian-born men who engage in religious or spiritual activities | Canadian-born men who do not engage in religious or spiritual activities | Landed immigrant men who engage in religious or spiritual activities | Landed immigrant men who do not engage in religious or spiritual activities |
|---|---|---|---|---|
| percent | ||||
| 0 | 100 | 100 | 100 | 100 |
| 1 | 96 | 95 | 97 | 97 |
| 2 | 92 | 89 | 94 | 95 |
| 3 | 89 | 85 | 93 | 94 |
| 4 | 86 | 82 | 92 | 92 |
| 5 | 84 | 79 | 90 | 91 |
| 6 | 82 | 77 | 88 | 89 |
| 7 | 80 | 74 | 87 | 87 |
| 8 | 79 | 73 | 87 | 86 |
| 9 | 77 | 71 | 86 | 85 |
| 10 | 76 | 69 | 86 | 84 |
| 11 | 75 | 68 | 85 | 83 |
| 12 | 74 | 66 | 84 | 81 |
| 13 | 73 | 65 | 84 | 80 |
| 14 | 72 | 64 | 83 | 79 |
| 15 | 71 | 62 | 83 | 79 |
| 16 | 70 | 62 | 83 | 78 |
| 17 | 69 | 62 | 82 | 77 |
| 18 | 68 | 61 | 82 | 77 |
| 19 | 67 | 60 | 82 | 76 |
| 20 | 67 | 59 | 81 | 76 |
| 21 | 66 | 58 | 81 | 74 |
| 22 | 65 | 58 | 81 | 74 |
| 23 | 64 | 58 | 80 | 74 |
| 24 | 63 | 57 | 79 | 74 |
| 25 | 63 | 56 | 79 | 74 |
| 26 | 62 | 56 | 78 | 73 |
| 27 | 61 | 56 | 78 | 73 |
| 28 | 61 | 55 | 78 | 72 |
| 29 | 61 | 54 | 77 | 72 |
| 30 | 61 | 54 | 77 | 72 |
| 31 | 60 | 54 | 77 | 71 |
| 32 | 60 | 54 | 76 | 70 |
| 33 | 60 | 54 | 75 | 69 |
| 34 | 60 | 53 | 75 | 68 |
| 35 | 60 | 53 | 75 | 68 |
| 36 | 60 | 53 | 75 | 68 |
| 37 | 60 | 53 | 74 | 68 |
| 38 | 60 | 53 | 74 | 68 |
| 39 | 60 | 53 | 74 | 68 |
| 40 | 60 | 53 | 74 | 68 |
| Source: Statistics Canada, General Social Survey – Family, 2017. | ||||

Data table for Chart 6-b
| Years | Canadian-born women who engage in religious or spiritual activities | Canadian-born women who do not engage in religious or spiritual activities | Landed immigrant women who engage in religious or spiritual activities | Landed immigrant women who do not engage in religious or spiritual activities |
|---|---|---|---|---|
| percent | ||||
| 0 | 100 | 100 | 100 | 100 |
| 1 | 95 | 95 | 99 | 99 |
| 2 | 92 | 89 | 96 | 97 |
| 3 | 88 | 85 | 94 | 95 |
| 4 | 85 | 81 | 93 | 94 |
| 5 | 83 | 77 | 92 | 93 |
| 6 | 80 | 74 | 90 | 91 |
| 7 | 78 | 72 | 90 | 90 |
| 8 | 77 | 70 | 88 | 89 |
| 9 | 75 | 68 | 88 | 88 |
| 10 | 73 | 67 | 87 | 86 |
| 11 | 72 | 66 | 86 | 85 |
| 12 | 70 | 64 | 84 | 84 |
| 13 | 69 | 63 | 84 | 83 |
| 14 | 68 | 62 | 83 | 81 |
| 15 | 67 | 61 | 82 | 81 |
| 16 | 66 | 60 | 81 | 79 |
| 17 | 64 | 59 | 80 | 79 |
| 18 | 64 | 58 | 79 | 78 |
| 19 | 62 | 57 | 78 | 77 |
| 20 | 61 | 56 | 78 | 76 |
| 21 | 61 | 54 | 77 | 76 |
| 22 | 60 | 53 | 77 | 75 |
| 23 | 58 | 53 | 76 | 75 |
| 24 | 57 | 53 | 76 | 75 |
| 25 | 57 | 52 | 75 | 74 |
| 26 | 56 | 52 | 74 | 74 |
| 27 | 56 | 51 | 74 | 74 |
| 28 | 56 | 51 | 73 | 73 |
| 29 | 55 | 50 | 72 | 73 |
| 30 | 55 | 50 | 72 | 73 |
| 31 | 54 | 49 | 71 | 72 |
| 32 | 54 | 49 | 71 | 72 |
| 33 | 54 | 49 | 71 | 71 |
| 34 | 53 | 48 | 71 | 70 |
| 35 | 53 | 48 | 71 | 70 |
| 36 | 53 | 48 | 71 | 70 |
| 37 | 53 | 48 | 71 | 69 |
| 38 | 52 | 48 | 71 | 69 |
| 39 | 52 | 48 | 71 | 69 |
| 40 | 52 | 48 | 71 | 68 |
| Source: Statistics Canada, General Social Survey – Family, 2017. | ||||
The factors associated with first union dissolution
Factors associated with the risk of first union dissolution in Canada as estimated from Cox semiparametric models are presented in Table 2, by landed immigrant status and sex. The odds ratios indicate the relative risks of experiencing union dissolution at any given moment based on certain characteristics. It is thus possible to identify individual factors that increase or decrease the risk of union dissolution.
| All respondents | Canadian-born individuals | Landed immigrants | ||||
|---|---|---|---|---|---|---|
| Model 1 | Model 2 | Model 3 | Model 4 | Model 5 | Model 6 | |
| Men | Women | Men | Women | Men | Women | |
| odds ratio | ||||||
| Canadian-born individuals (ref.) | 1.00 | 1.00 | Note ...: not applicable | Note ...: not applicable | Note ...: not applicable | Note ...: not applicable |
| Landed immigrants | 0.94Table 2 Note † | 0.81Note * | Note ...: not applicable | Note ...: not applicable | Note ...: not applicable | Note ...: not applicable |
| Birth cohort | ||||||
| 1917 to 1944 | 0.63Note *** | 0.95 | 0.67Note *** | 0.98 | 0.42Note ** | 0.74 |
| 1945 to 1964 (ref.) | 1.00 | 1.00 | 1.00 | 1.00 | 1.00 | 1.00 |
| 1965 to 1997 | 1.02 | 1.12 | 1.05 | 1.17Note * | 1.11 | 1.46 |
| Age at the beginning of the union | ||||||
| Younger than 25 years (ref.) | 1.00 | 1.00 | 1.00 | 1.00 | 1.00 | 1.00 |
| 25 years and older | 0.63Note *** | 0.53Note *** | 0.62Note *** | 0.50Note *** | 0.75 | 0.72 |
| Union type | ||||||
| Common-law union (ref.) | 1.00 | 1.00 | 1.00 | 1.00 | 1.00 | 1.00 |
| Marriage | 0.29Note *** | 0.29Note *** | 0.29Note *** | 0.31Note *** | 0.28Note *** | 0.20Note *** |
| Children born or adopted during this union | ||||||
| Yes | 0.26Note *** | 0.28Note *** | 0.26Note *** | 0.26Note *** | 0.27Note *** | 0.40Note *** |
| No (ref.) | 1.00 | 1.00 | 1.00 | 1.00 | 1.00 | 1.00 |
| Highest level of education | ||||||
| Below bachelor level (ref.) | 1.00 | 1.00 | 1.00 | 1.00 | 1.00 | 1.00 |
| Bachelor’s degree or higher | 0.88Note * | 0.87Note * | 0.88 | 0.91 | 0.79 | 0.65Note * |
| Racialized population Table 2 Note 1 | ||||||
| Yes | 0.80 | 0.87 | 1.07 | 1.08 | 0.73 | 0.91 |
| No (ref.) | 1.00 | 1.00 | 1.00 | 1.00 | 1.00 | 1.00 |
| Engaged in religious or spiritual activities on an individual basis in the previous 12 months | ||||||
| Yes (ref.) | 1.00 | 1.00 | 1.00 | 1.00 | 1.00 | 1.00 |
| No | 0.96 | 0.90Note * | 0.98 | 0.89Note * | 0.89 | 1.03 |
| Separated or divorced parents | ||||||
| Yes | 1.20Note ** | 1.42Note *** | 1.17Note * | 1.43Note *** | 1.41 | 1.42 |
| No (ref.) | 1.00 | 1.00 | 1.00 | 1.00 | 1.00 | 1.00 |
| Place where the union began | ||||||
| In Canada | Note ...: not applicable | Note ...: not applicable | Note ...: not applicable | Note ...: not applicable | 1.32 | 1.43 |
| Outside Canada and still ongoing at the time of immigration (ref.) | Note ...: not applicable | Note ...: not applicable | Note ...: not applicable | Note ...: not applicable | 1.00 | 1.00 |
| Number of years since immigration | ||||||
| Less than 30 years (ref.) | Note ...: not applicable | Note ...: not applicable | Note ...: not applicable | Note ...: not applicable | 1.00 | 1.00 |
| 30 years or more | Note ...: not applicable | Note ...: not applicable | Note ...: not applicable | Note ...: not applicable | 1.55 | 1.68Note * |
... not applicable
Source: Statistics Canada, General Social Survey – Family, 2017. |
||||||
Landed immigrant women are less likely to experience first union dissolution
Models 1 and 2 of Table 2 estimate the statistical effect of landed immigrant status on the risk of first union dissolution separately for men and women. After controls for sociodemographic characteristics are included, landed immigrant status does not affect the risk of experiencing union dissolution among men. Conversely, landed immigrant women were 19% less likely to experience first union dissolution than Canadian-born women. The difference in the pace of union dissolution that was found among men in the descriptive analysis can thus be explained in terms of their different sociodemographic composition rather than by the mere fact of being landed immigrants. Most men were selected to immigrate in Canada based on certain characteristics that influence the process of union dissolution. According to the 2017 GSS data, landed immigrants are distinct from the Canadian-born in characteristics that are themselves associated with a lower risk of marital dissolution: they are more educated, more likely to start a union through marriage and to have had at least one child in their first union, compared with those born in Canada. For women, landed immigrant status had an equally significant association with union dissolution as their sociodemographic characteristics.
The earlier analysis of the timing of union dissolution indicated that landed immigrants whose first union began in Canada tended to end their first union sooner than those whose union had began outside of Canada and was still ongoing at the time of immigration (Chart 2). However, models 5 and 6 show that this difference disappears once sociodemographic characteristics are considered, both for men and women, as no statistically significant difference in the risk of experiencing first union dissolution is observed among landed immigrants whose union began in Canada and those whose union started outside the country. These findings seem counterintuitive, as it could be assumed that first unions that started in Canada may end at a faster pace, considering cultural differences and differences in societal norms surrounding divorce between the country of origin of landed immigrants and Canada. Furthermore, the fact that divorce is not yet as socially acceptable in the culture of the countries of origin of some landed immigrants as it is in Canada, landed immigrants whose unions began before their arrival in Canada and who may still be attached to certain norms and values of the country of origin may be less inclined to union dissolution than those whose first union began in Canada. However, the constraints and difficulties experienced by immigrants upon their arrival may lead them to strengthen their family and marital ties with family members in Canada. While gaining recognition outside the home may be difficult, where some immigrants may even experience discrimination (in employment, housing, health or other), the household can be a place of refuge and recognition of a person’s status and family role, and the couple relationship may enable to develop action strategies to better adapt to the host society.
Finally, the length of stay in Canada is associated with an increased risk of first union dissolution among landed immigrant women. Those who had been in Canada for at least 30 years were 68% more likely to experience the dissolution of their union than those who had arrived more recently. Conversely, among men, the number of years since immigration to Canada does not significantly affect the risk of landed immigrants’ first union dissolution.
The level of education affects the risk of first union dissolution only among landed immigrant women
The descriptive analysis of the timing of first union dissolution by education level showed that higher educational attainment is associated with a longer duration of first unions, regardless of sex and landed immigrant status. Once the effect of certain sociodemographic characteristics is taken into consideration, this negative relationship between the risk of first union dissolution and the level of education is confirmed. However, this relationship was statistically significant only among landed immigrant women. Model 6 shows that immigrant women with a bachelor’s degree or higher were 35% less likely to experience first union dissolution than those whose highest education level is below a bachelor’s degree.
These results for landed immigrant women confirm for Canada previous findings on the association between education levels and the risk of union dissolution observed elsewhere,Note namely, the existence of a negative relationship between educational attainment and the risk of union dissolution. The lower risk of union dissolution among those with more education can be attributed to the increasing prevalence of separation and divorces, which has been accompanied by a shift in the effect of education level on the risk of separation, from positive to negative. While in the past, those with higher education divorced more frequently, this is the case nowadays for those with lower education, particularly among landed immigrant women.Note This can be explained by the fact that the possibility of divorce is no longer a privilege reserved only for higher social classes, as divorce has become more common and less expensive. Furthermore, couples with lower levels of education are often low-income couples and therefore more likely to face financial difficulties. These difficulties can in turn increase the risk of conflict and thus undermine the couple’s stability.Note Finally, less educated people may be less likely to have communication skills to resolve conflicts in the relationship,Note which could also jeopardize their relationship.
The presence of children born or adopted during the first union is negatively associated with the risk of first union dissolution
In Canada, the presence of children born or adopted during the first union is associated with a lower risk of dissolution, regardless of landed immigrant status and sex. When controls are included for certain sociodemographic characteristics, a negative relationship is observed between the presence of children from the union and the risk of its dissolution. As shown in research on union dissolution in other countries,Note in Canada, both among people who were born in Canada and among landed immigrants, having children together is associated with a lower risk of union dissolution. For example, landed immigrant women who had children (born or adopted) during the union were 60% less likely to experience union dissolution than those who did not have children (Model 6). It should be noted that the presence of children on the risk of union dissolution had a lower effect for landed immigrant women than for their male counterparts (73%). Among those born in Canada, having children during the union is also associated with a lower risk of union dissolution, similarly among women and men.
It is important not to assert a causal link between the presence of born or adopted children and the risk of union dissolution, given the potential for an inverse association. On the one hand, having children could be a “protective” factor in unions, helping them last longer. On the other, happier and longer unions could also lead more often to having children. These results could support one or both of these explanations.
Certain sociodemographic characteristics influence the risk of first union dissolution only among Canadian-born individuals
Studies on union dissolution have shown that certain characteristics, such as age at the beginning of the union,Note engagement in religious activities,Note or parental separation or divorce,Note influence the risk of union dissolution. However, this analysis on the determinants of first union duration show that these characteristics are associated to the risk of union dissolution only among those born in Canada.
When other sociodemographic characteristics are considered, the effect of age at the beginning of the union was not significant among landed immigrants, both for women and men (models 5 and 6). In contrast, among those born in Canada (models 3 and 4), there is a negative and statistically significant relationship between the risk of union dissolution and the age at the beginning of the first union. For example, the risk of separation for Canadian-born women whose first union started at 25 years of age and older was 50% lower than that for women whose union began at a younger age. This effect of age at the beginning of the union is lower among men. Those who were 25 and older at the time of union formation were 38% less likely to separate than those who were younger at the start of their first union.
The results show a positive association between having experienced parental separation or divorce and the risk of first union dissolution. However, this effect is statistically significant only for those born in Canada. For example, Canadian-born women who experienced the separation or divorce of their parents were 43% more at risk of first union dissolution than those whose parents were still together. The effect is lower for Canadian-born men.
Finally, religion can affect the economic and demographic behaviours of individuals and families, particularly with respect to the choice of partner or spouse.Note Thus, participation in religious celebrations could be associated with a lower risk of separation or divorce. The results for Canada support previous findings, showing that engagement in religious or spiritual activities in the past year is generally associated with a lower risk of first union dissolution. However, this lower risk was significant only for Canadian-born women. Those who reported having engaged in religious or spiritual activities in the past year had a lower propensity (11%) to separate than women who had not engaged in such activities.
Conclusion
This analysis examined for the first time the process of first union dissolution in Canada, by landed immigrant status and sex. Specifically, the timing and risk of first union dissolution were examined, as were the differences, if any, between those born in Canada and landed immigrants.
First, the timing of first union dissolution analysis showed that Canadian-born individuals experience first union dissolution sooner after its formation than landed immigrants. When certain sociodemographic characteristics are controlled for, this relationship exists only among women. In other words, men have a similar risk of first union dissolution whether they are landed immigrants or born in Canada. In addition, the type of union (marriage or common-law union) and the presence of children born or adopted during that union similarly affect the risk of first union dissolution for Canadian-born individuals and landed immigrants.
Among Canadian-born individuals, factors such as birth cohort, age at the time of union formation, parental separation, and engagement in religious or spiritual activities have some effect on the likelihood of first union dissolution. Compared with baby boomers, men born in Canada from 1917 to 1944 were less likely to experience first union dissolution. Among Canadian-born women, younger cohorts (born from 1965 to 1997) were at a greater risk of separating than women from the baby boom generation. Those born in Canada whose first union began at a younger age (younger than 25 years) were more likely to separate. Not having experienced parental separation seems to have a protective effect on the outcome of first unions among Canadian-born individuals. Engaging in religious or spiritual activities also reduces the risk of first union dissolution for Canadian-born women.
Among landed immigrants, higher education is associated to a lower risk of first union dissolution among women. Moreover, unlike men, the number of years since immigration is also associated with a greater risk of union dissolution among women. For men, the effect of the number of years since immigration may be nullified by that of the birth cohort.
This analysis is not without limits. On the one hand, the data on highest level of education were collected at the time of the survey, which could differ from that during the union. The analysis could have been more precise if information on the individual’s educational trajectory since the beginning of the union had been available, so that its effect could be analyzed as varying over time. This is also true for engagement in religious or spiritual activities and the presence of children born or adopted during the union. Furthermore, it would have been interesting to see how the sociodemographic characteristics of (former) partners or spouses affect the risk of first union dissolution. However, while the 2017 GSS collects some information on partner characteristics for unions that are ongoing at the time of the survey, this is not the case for partners from previous unions. Finally, including the country or region of origin of landed immigrants as an analytical dimension would make it possible to measure the effect of divorce norms and values in the countries of origin of landed immigrants, as well as the conditions of integration into the host society, on the duration of their unions once they have settled in Canada.
This article constituted an exploration on union dynamics by immigration status in Canada. It could serve as a starting point for future more in-depth analyses. It can also be useful to governments at different levels when implementing public family policies (e.g. those aimed at helping families maintain links with children, custody and arrangements, and financial support for children after separation).
Data and methodology
Data
The data this analysis is based on are from the 2017 General Social Survey (GSS) – Family.
The GSS – Family tracks trends and changes in Canadian families. It collects historical information on conjugal and parental history (i.e., the date of events in the family trajectory, such as marriages, common-law unions and the birth of children), family history, leaving the parental home, fertility intentions, and other socioeconomic characteristics. The target population for the 2017 GSS includes those aged 15 years and older who are non-institutionalized and live in one of the 10 Canadian provinces. This is a sample survey of 20,600 respondents, with a cross-sectional design. Data were collected directly from respondents using computer-assisted telephone interviews.
This analysis focuses on respondents aged 20 and older at the time of the survey who had ever been in a relationship (marriage or common-law union) at least once. The sample consists of 17,200 people, of whom 13,683 were born in Canada and 3,392 were born outside Canada (3,102 landed immigrants and 290 non-permanent residents).
Methodology
In this article, the association between certain sociodemographic characteristics and the risk of first union dissolution is analyzed. Landed immigrants are compared with Canadian-born individuals. This was done using a methodological approach with a two-step survival analysis: an analysis of the timing of union dissolution and a semiparametric analysis using the Cox model.
The survival analysis, or event history model, is used to study the transition from one state to another and to measure the statistical effect of independent variables on the risk of experiencing this transition. In this analysis, the variable of interest is the change in marital status (from the status of “first union” to “end of the first union through separation or divorce”), i.e., the duration of the first union until its dissolution. The analysis is based on the formation of an at-risk group, i.e., a group at risk of experiencing first union dissolution. These are all people who were ever in a relationship, aged at least 20 years old at the time of the survey and who were at least 15 years old at the start of the first union. The composition of this at-risk group changes as time passes and individuals experience the event of interest (exiting the at-risk group by having experienced the event of interest) or are censored at the time of the survey (exiting the at-risk group without experiencing the event of interest, i.e., the dissolution of the first union). The observation period is therefore different for each person and depends on the age at the start of the union (i.e., the start of the risk of experiencing dissolution).
For the semiparametric analysis, different models by sex were estimated for landed immigrants and Canadian-born individuals. The statistical effect of the independent variables is expressed as coefficients indicating the relative odds or risk ratio. For binary or categorical variables, as in this analysis, the interpretation of coefficients considers the risk relative to the reference category. Thus, a relative risk greater than 1 indicates a greater risk of experiencing the event of interest than individuals in the reference category, while a lower risk is expressed by a value less than 1.
References
Amato, P.R. (1996). Explaining the intergenerational transmission of divorce. Journal of Marriage and Family 58(3), 628–640.
Andersson, G. (1997). The impact of children on divorce risks of Swedish women. European Journal of Population 13(2), 109-145.
Bernardi, F. and C.L. Comolli. (2017, 29 octobre-3 novembre). Change in the educational gradient of divorce and heterogeneous consequences of parental separation on children’s educational outcomes in Spain [séance de conférence]. Union internationale pour l'étude scientifique de la population, XXVIIIe Congrès international de la population, Le Cap, Afrique du Sud.
Bohnert, N. (2011). Examining the determinants of union dissolution among married and common-law unions in Canada. Canadian Studies in Population 38(3-4), 75-92.
Brines, J. and K. Joyner. (1999). The ties that bind: Principles of cohesion in cohabitation and marriage. American Sociological Review 64(3), 333-355.
Cherlin, A.J. (2004). The deinstitutionalization of American marriage. Journal of Marriage and Family 66(14), 848-861.
Hall, D.R. and J.Z. Zhao. (1995). Cohabitation and Divorce in Canada: Testing the Selectivity Hypothesis. Journal of Marriage and Family 57(2), 421-427.
Hoem, J.M. (1997). Educational Gradients in Divorce Risks in Sweden in Recent Decades. Population Studies 51(1), 19-27.
Lapierre-Adamcyk, E., C. Le Bourdais and N. Marcil-Gratton. (1999). Vivre en couple pour la première fois : la signification du choix de l’union libre au Québec and en Ontario. Cahiers québécois de démographie 28(1-2), 199-227.
Le Bourdais, C. and É. Lapierre-Adamcyk. (2004). Changes in Conjugal Life in Canada: Is Cohabitation Progressively Replacing Marriage? Journal of Marriage and Family 66(14), 929-942.
Le Bourdais, C., É. Lapierre-Adamcyk, and A. Roy. (2014). Instabilité des unions libres : une analyse comparative des facteurs démographiques. Recherches sociographiques 55(1), 53-78.
Lehrer, E.L. (2004). Religion as a Determinant of Economic and Demographic Behavior in the United States. Population and Development Review 30(4), 707-726.
Lehrer, E.L. (2008). Age at marriage and marital instability: revisiting the Becker–Landes–Michael hypothesis. Journal of Population Economics 21(2), 463-484.
Lyngstad, T.H. and M. Jalovaara. (2010). A review of the antecedents of union dissolution. Demographic Research 23(10), 257-292.
Ménard, F.-P. (2011). What makes it fall apart? The determinants of the dissolution of marriages and common-law unions in Canada. McGill Sociological Review 2, 59-76.
Statistics Canada. (May15, 2019). Family Matters: New relationships after separation or divorce [infographics].
Steele, F., C. Kallis, H. Goldstein and H. Joshi. (2005). The relationship between childbearing and transitions from marriage and cohabitation in Britain. Demography 42(4), 647-673.
Trovato, F. (1993). Religious Disaffiliation and Divorce in Canada. Journal of Divorce & Remarriage 20(1-2), 189-204.
- Date modified: