
Chart 5
Labour statistics among women and men with disabilities aged 25 to 54, by severity of disability, Canada, 2011
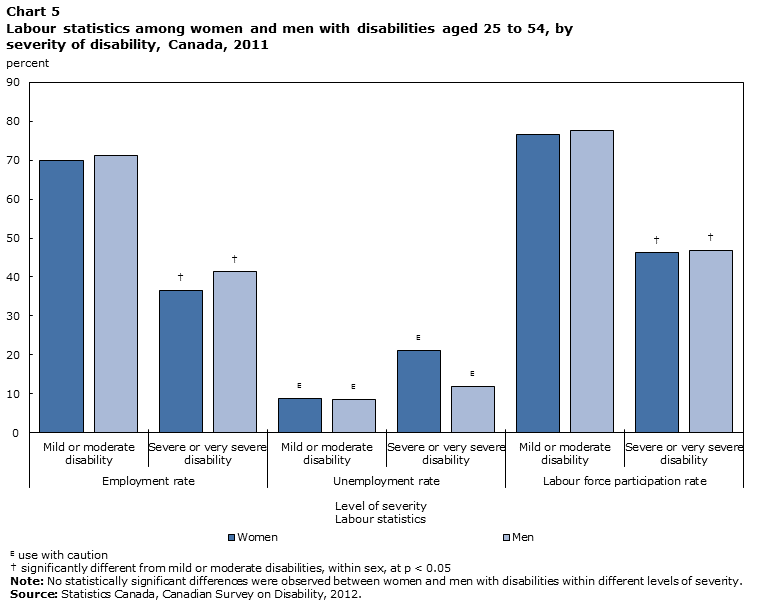
Data table for Chart 5
| Sex | Employment status | Level of severity | |
|---|---|---|---|
| Mild or moderate disability | Severe or very severe disability | ||
| percent | |||
| Women | Employment rate | 69.9 | 36.6Data table Note † |
| Unemployment rate | 8.7Note E: Use with caution | 21.0Note E: Use with caution | |
| Labour force participation rate | 76.6 | 46.3Data table Note † | |
| Men | Employment rate | 71.2 | 41.4Data table Note † |
| Unemployment rate | 8.4Note E: Use with caution | 11.8Note E: Use with caution | |
| Labour force participation rate | 77.7 | 46.9Data table Note † | |
E use with caution
Source: Statistics Canada, Canadian Survey on Disability, 2012. |
|||
- Date modified: