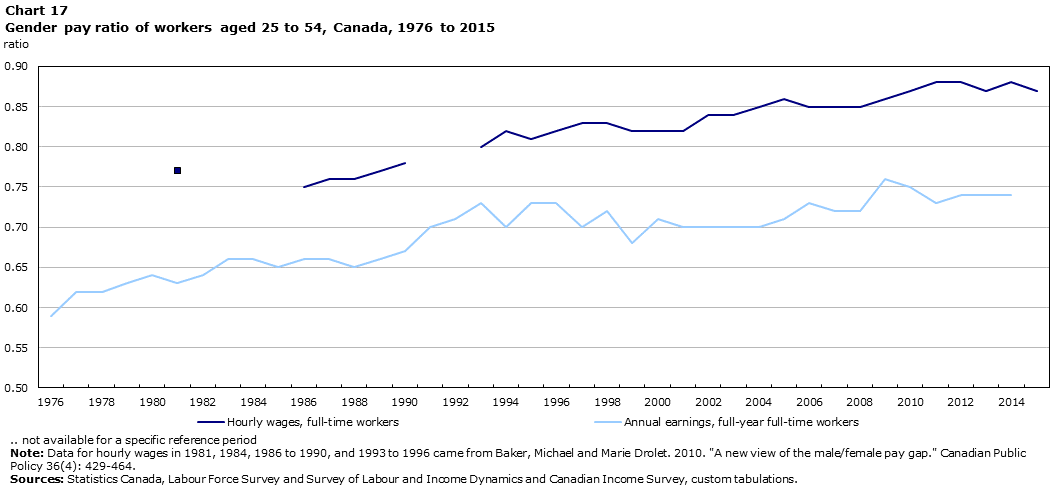
Chart 17
Gender pay ratio of workers aged 25 to 54, Canada, 1976 to 2015

Data table for Chart 17
| Years | Hourly wages, full-time workers | Annual earnings, full-year full-time workers |
|---|---|---|
| ratio | ||
| 1976 | Note ..: not available for a specific reference period | 0.59 |
| 1977 | Note ..: not available for a specific reference period | 0.62 |
| 1978 | Note ..: not available for a specific reference period | 0.62 |
| 1979 | Note ..: not available for a specific reference period | 0.63 |
| 1980 | Note ..: not available for a specific reference period | 0.64 |
| 1981 | 0.77 | 0.63 |
| 1982 | Note ..: not available for a specific reference period | 0.64 |
| 1983 | Note ..: not available for a specific reference period | 0.66 |
| 1984 | 0.74 | 0.66 |
| 1985 | Note ..: not available for a specific reference period | 0.65 |
| 1986 | 0.75 | 0.66 |
| 1987 | 0.76 | 0.66 |
| 1988 | 0.76 | 0.65 |
| 1989 | 0.77 | 0.66 |
| 1990 | 0.78 | 0.67 |
| 1991 | Note ..: not available for a specific reference period | 0.70 |
| 1992 | Note ..: not available for a specific reference period | 0.71 |
| 1993 | 0.80 | 0.73 |
| 1994 | 0.82 | 0.70 |
| 1995 | 0.81 | 0.73 |
| 1996 | 0.82 | 0.73 |
| 1997 | 0.83 | 0.70 |
| 1998 | 0.83 | 0.72 |
| 1999 | 0.82 | 0.68 |
| 2000 | 0.82 | 0.71 |
| 2001 | 0.82 | 0.70 |
| 2002 | 0.84 | 0.70 |
| 2003 | 0.84 | 0.70 |
| 2004 | 0.85 | 0.70 |
| 2005 | 0.86 | 0.71 |
| 2006 | 0.85 | 0.73 |
| 2007 | 0.85 | 0.72 |
| 2008 | 0.85 | 0.72 |
| 2009 | 0.86 | 0.76 |
| 2010 | 0.87 | 0.75 |
| 2011 | 0.88 | 0.73 |
| 2012 | 0.88 | 0.74 |
| 2013 | 0.87 | 0.74 |
| 2014 | 0.88 | 0.74 |
| 2015 | 0.87 | Note ..: not available for a specific reference period |
|
.. not available for a specific reference period Note: Data for hourly wages in 1981, 1984, 1986 to 1990, and 1993 to 1996 came from Baker, Michael and Marie Drolet. 2010. "A new view of the male/female pay gap." Canadian Public Policy 36(4): 429-464. Sources: Statistics Canada, Labour Force Survey and Survey of Labour and Income Dynamics and Canadian Income Survey, custom tabulations. |
||
- Date modified: