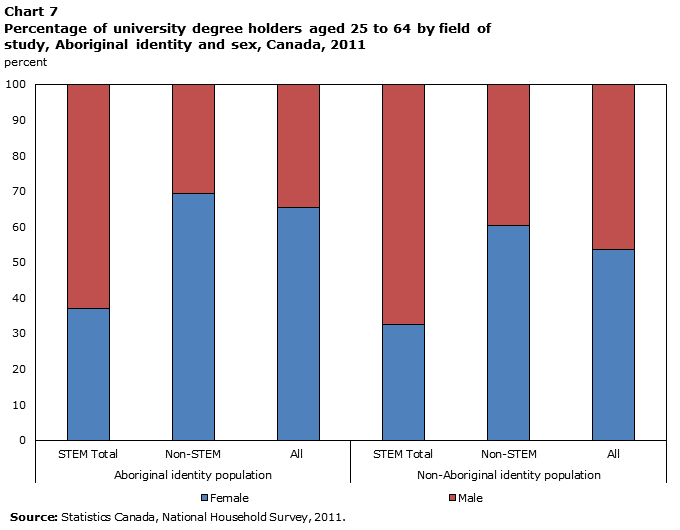
Chart 7
Percentage of university degree holders aged 25 to 64 by field of study, Aboriginal identity and sex, Canada, 2011
Chart 7
Percentage of university degree holders aged 25 to 64 by field of study, Aboriginal identity and sex, Canada, 2011
Data table for Chart 7
Data table for Chart 7
Table summary
This table displays the results of Data table for Chart 7 Female and Male, calculated using percent units of measure (appearing as column headers).
Female
Male
percent
Aboriginal identity population
STEM Total
37
63
Non-STEM
69
31
All
65
35
Non-Aboriginal identity population
STEM Total
33
67
Non-STEM
60
40
All
54
46
Source: Statistics Canada, National Household Survey, 2011.