
Chart 28 Percentage of adults who were classified as meeting the criteria of selected mental health disorders, by sex and age group, Canada excluding territories, 2012
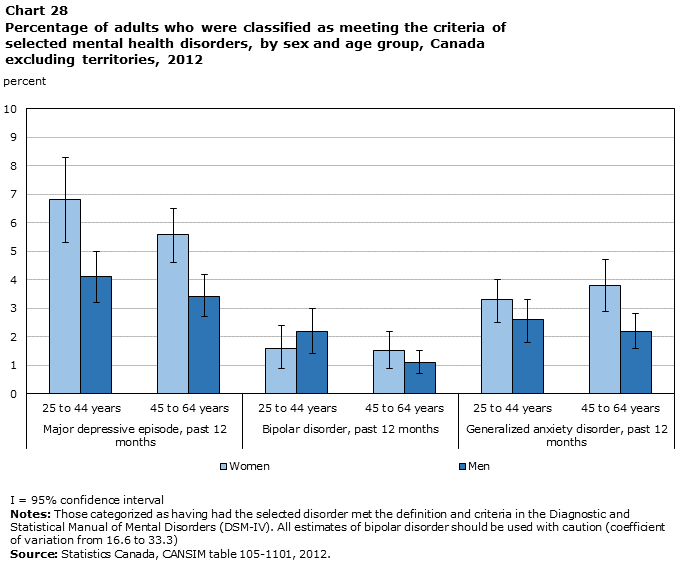
Description for Chart 28
| Women | Men | |||||
|---|---|---|---|---|---|---|
| Percent | Error bars | Percent | Error bars | |||
| negative | positive | negative | positive | |||
| Major depressive episode, past 12 months | ||||||
| 25 to 44 years | 6.8 | 1.5 | 1.5 | 4.1 | 0.9 | 0.9 |
| 45 to 64 years | 5.6 | 1.0 | 0.9 | 3.4 | 0.7 | 0.8 |
| Bipolar disorder, past 12 months | ||||||
| 25 to 44 years | 1.6 | 0.7 | 0.8 | 2.2 | 0.8 | 0.8 |
| 45 to 64 years | 1.5 | 0.6 | 0.7 | 1.1 | 0.4 | 0.4 |
| Generalized anxiety disorder, past 12 months | ||||||
| 25 to 44 years | 3.3 | 0.8 | 0.7 | 2.6 | 0.8 | 0.7 |
| 45 to 64 years | 3.8 | 0.9 | 0.9 | 2.2 | 0.6 | 0.6 |
|
Notes: Those categorized as having had the selected disorder met the definition and criteria in the Diagnostic and Statistical Manual of Mental Disorders (DSM-IV). All estimates of bipolar disorder should be used with caution (coefficient of variation from 16.6 to 33.3) Source: Statistics Canada, CANSIM table 105-1101, 2012. |
||||||
- Date modified: