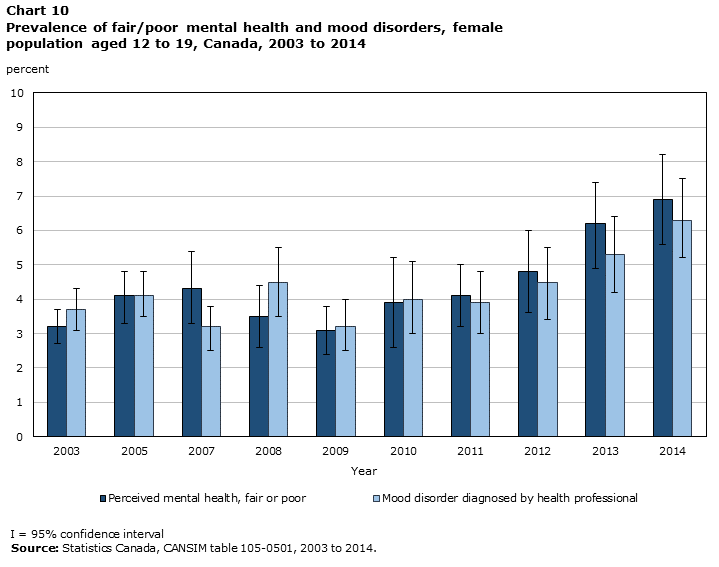
Chart 10 Prevalence of fair/poor mental health and mood disorders, female population aged 12 to 19, Canada, 2003 to 2014
Description for Chart 10
Data table for Chart 10Table summary
Percent
Error bars
negative
positive
2003
Perceived mental health, fair or poor
3.2
0.5
0.5
Mood disorder diagnosed by health professional
3.7
0.6
0.6
2005
Perceived mental health, fair or poor
4.1
0.8
0.7
Mood disorder diagnosed by health professional
4.1
0.6
0.7
2007
Perceived mental health, fair or poor
4.3
1.0
1.1
Mood disorder diagnosed by health professional
3.2
0.7
0.6
2008
Perceived mental health, fair or poor
3.5
0.9
0.9
Mood disorder diagnosed by health professional
4.5
1.0
1.0
2009
Perceived mental health, fair or poor
3.1
0.7
0.7
Mood disorder diagnosed by health professional
3.2
0.7
0.8
2010
Perceived mental health, fair or poor
3.9
1.3
1.3
Mood disorder diagnosed by health professional
4.0
1.0
1.1
2011
Perceived mental health, fair or poor
4.1
0.9
0.9
Mood disorder diagnosed by health professional
3.9
0.9
0.9
2012
Perceived mental health, fair or poor
4.8
1.2
1.2
Mood disorder diagnosed by health professional
4.5
1.1
1.0
2013
Perceived mental health, fair or poor
6.2
1.3
1.2
Mood disorder diagnosed by health professional
5.3
1.1
1.1
2014
Perceived mental health, fair or poor
6.9
1.3
1.3
Mood disorder diagnosed by health professional
6.3
1.1
1.2
Date modified:
2016-03-08
About this site
Government of Canada
Themes and topics
