
Chart 9 New cases of selected cancers as percentage of new cancer cases, by age group, female population aged 10 to 19, 1993 to 1997 and 2008 to 2012
Description for Chart 9
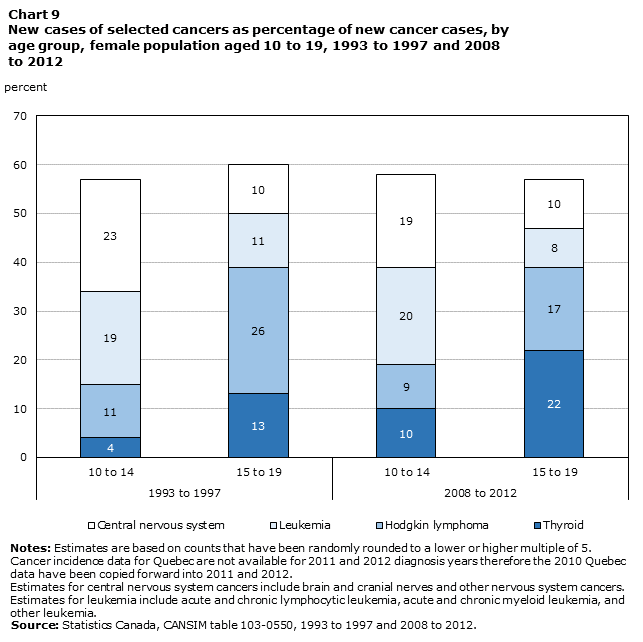
| Thyroid | Hodgkin lymphoma | Leukemia | Central nervous system | |
|---|---|---|---|---|
| 1993-1997, 10 to 14 years | 4 | 11 | 19 | 23 |
| 1993-1997, 15 to 19 years | 13 | 26 | 11 | 10 |
| 2008-2012, 10 to 14 years | 10 | 9 | 20 | 19 |
| 2008-2012, 15 to 19 years | 22 | 17 | 8 | 10 |
Notes:
Estimates are based on counts that have been randomly rounded to a lower or higher multiple of 5.Cancer incidence data for Quebec are not available for 2011 and 2012 diagnosis years therefore the 2010 Quebec data have been copied forward into 2011 and 2012.Estimates for central nervous system cancers include brain and cranial nerves and other nervous system cancers.Estimates for leukemia include acute and chronic lymphocytic leukemia, acute and chronic myeloid leukemia, and other leukemia.
Source:
Statistics Canada, CANSIM table 103-0550, 1993 to 1997 and 2008 to 2012.
- Date modified: