
Chart 2 Percentage of children aged 0 to 5 in food insecure household, by province/territory, Canada, 2011/2012
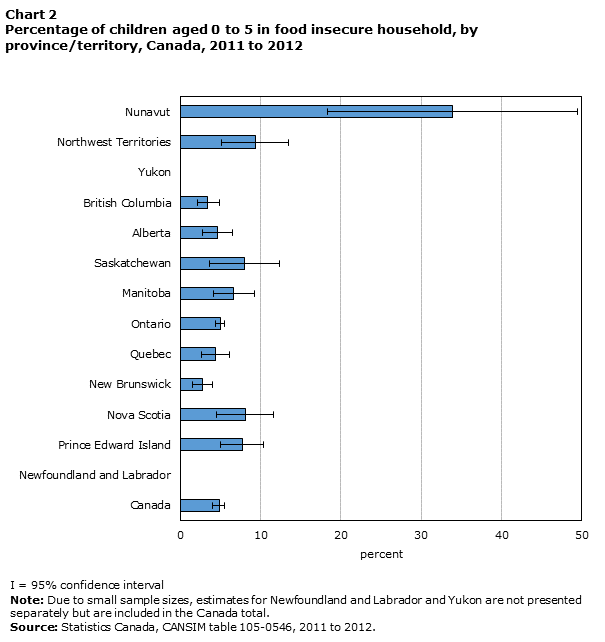
Description for Chart 2
| Percent | Error bars | ||
|---|---|---|---|
| negative | positive | ||
| Canada | 4.8 | 0.8 | 0.7 |
| Newfoundland and Labrador | Note F: too unreliable to be published | Note ...: not applicable | Note ...: not applicable |
| Prince Edward Island | 7.7 | 2.7 | 2.7 |
| Nova Scotia | 8.1 | 3.6 | 3.5 |
| New Brunswick | 2.7 | 1.2 | 1.3 |
| Quebec | 4.3 | 1.7 | 1.8 |
| Ontario | 5.0 | 0.6 | 0.5 |
| Manitoba | 6.6 | 2.5 | 2.6 |
| Saskatchewan | 8.0 | 4.4 | 4.4 |
| Alberta | 4.6 | 1.9 | 1.9 |
| British Columbia | 3.4 | 1.3 | 1.4 |
| Yukon | Note F: too unreliable to be published | Note ...: not applicable | Note ...: not applicable |
| Northwest Territories | 9.3 | 4.2 | 4.2 |
| Nunavut | 33.9 | 15.6 | 15.6 |
|
... not applicable F too unreliable to be published Note: Due to small sample sizes, estimates for Newfoundland and Labrador and Yukon are not presented separately but are included in the Canada total. Source: Statistics Canada, CANSIM table 105-0546, 2011-2012. |
|||
- Date modified: