
Just the Facts
Family and household characteristics of lesbian, gay and bisexual people in Canada

Archived Content
Information identified as archived is provided for reference, research or recordkeeping purposes. It is not subject to the Government of Canada Web Standards and has not been altered or updated since it was archived. Please "contact us" to request a format other than those available.
While couples and families share many similar challenges regardless of their characteristics, same-sex couples and families headed by lesbian, gay or bisexual (LGB) people face different circumstances compared with heterosexual couples and families. Data from pooled cycles of the Canadian Community Health Survey (CCHS; 2015 to 2016 and 2017 to 2018 reference periods) provide a statistical portrait of the family and household characteristics of LGB people aged 15 and older in Canada, with comparisons made with the heterosexual population.
According to Statistics Canada (2021),Note an estimated 900,000Note people living in Canada were lesbian, gay, or bisexual, representing 3.2%Note of the population aged 15 and older, averaged over the 2015 to 2018 period. Bisexual individuals (1.8%) made up a slightly larger proportion of the Canadian population than gay or lesbian individuals (1.5%). Women were more than twice as likely to indicate being bisexual (2.4%) than as lesbian or gayNote (1.1%), and men were more likely to be gay than bisexual (1.9% versus 1.2%).
LGB people were more likely to live in cities than rural communities—gay men in particular being the most likely to live in Canada’s largest census metropolitan areas
LGB individuals were more likely than their heterosexual counterparts to live in population centres than in rural communities.Note Gay and lesbian people were the most likely to live in large urban population centres (74.4%)—driven by a larger proportion of gay men (79.1%) than lesbian or gay women (66.5%)—compared with bisexual (68.7%) and heterosexual people (61.1%).
Almost half (46.5%) of the gay and lesbian population lived in the three largest census metropolitan areas in Canada (i.e., Toronto, Montréal, Vancouver), compared with 37.9% of the bisexual population and 35.4% of the non-LGB population. The differences between sexual orientation groups were driven primarily by gay (52.3%) and bisexual (42.2%) men, as a similar proportion of women who are gay or lesbian (36.7%) or bisexual (35.8%) lived in Toronto, Montréal or Vancouver. In comparison, 35.1% of heterosexual men and 35.7% of heterosexual women lived in these three cities.
One in 10 bisexual (10.6%) and gay and lesbian (10.1%) individuals resided in rural areas, compared with slightly under 1 in 5 (17.7%) of the heterosexual population. A similar proportion of heterosexual men (17.8%) and women (17.6%) lived in rural communities, as was the case for bisexual men (11.0%) and women (10.3%). However, gay men were less likely to live in rural areas (8.8%) than lesbian women were (12.2%).
LGB people were more likely to be living in common-law unions than heterosexual people, who were more likely to be married
Almost three in four (71.3%) heterosexual people and nearly half (46.8%) of LGB individuals aged 25 to 64 were married or living in a common-law union.Note Although same-sex marriage became legal across Canada in 2005, the prevalence of marriage was lower in the LGB population than in the heterosexual population in the 2015 to 2018 period.
Among those aged 25 to 64, over half (55.7%) of the heterosexual population was married, compared with almost one-quarter (23.0%) of bisexual and 17.1% of gay and lesbian people (Chart 1). In contrast, almost one-third (30.8%) of the gay and lesbian population and close to one-quarter (22.8%) of the bisexual population in this age group were in common-law relationships, compared with 15.5% of the heterosexual population. Bisexual (10.2%) and heterosexual (9.8%) individuals were also more like to have been divorced, separated or widowed than their gay and lesbian counterparts (6.9%). Gay and lesbian (45.3%) and bisexual (44.1%) people were twice as likely to be single (i.e., never married and not living in a common-law unionNote ) than the heterosexual population (18.9%).
Marriage has been less popular in Quebec than in most other provinces and territories for some time.Note In Quebec, the population aged 25 to 64 was the most likely to be living common-law than married across sexual orientation groups (heterosexual, gay or lesbian, and bisexual), compared with other regions.Note

Data table for Chart 1
| Percent | 95% confidence intervals | ||
|---|---|---|---|
| Lower | Upper | ||
| HeterosexualData table Note † | |||
| Married | 55.7 | 55.1 | 56.4 |
| Common-law | 15.5 | 15.2 | 15.9 |
| Divorced, separated, or widowed |
9.8 | 9.5 | 10.2 |
| Single (never married and not living common-law) |
18.9 | 18.4 | 19.3 |
| Lesbian or gay | |||
| Married | 17.1Note * | 14.7 | 19.8 |
| Common-law | 30.8Note * | 27.1 | 34.7 |
| Divorced, separated, or widowed |
6.9Note * | 5.5 | 8.6 |
| Single (never married and not living common-law) |
45.3Note * | 41.3 | 49.3 |
| Bisexual | |||
| Married | 23.0Note * | 20.1 | 26.2 |
| Common-law | 22.8Note * | 19.0 | 27.0 |
| Divorced, separated, or widowed | 10.2 | 8.3 | 12.4 |
| Single (never married and not living common law) | 44.1Note * | 40.1 | 48.2 |
Source: Statistics Canada, 2015 to 2018 Canadian Community Health Survey. |
|||
Lesbian or gay women were twice as likely to be married as gay men
While the proportion of lesbian or gay women in common-law unions (29.3%) was similar to that of gay men (31.6%), lesbian or gay women aged 25 to 64 were twice as likely to be married as gay men (25.3% versus 12.5%, Table 1). Almost half (50.2%) of gay men aged 25 to 64 were single (i.e. never married and not living common-law), compared with over one-third (36.4%) of lesbian or gay women in this age group. There were no large differences between men and women in the prevalence of marriage or common-law union for the heterosexual and bisexual populations.
| Sexual orientation | Marital status | Sex | |||||
|---|---|---|---|---|---|---|---|
| Male | Female | ||||||
| Percent | 95% confidence intervals | Percent | 95% confidence intervals | ||||
| Lower | Upper | Lower | Upper | ||||
| HeterosexualTable 1 Note † | Married | 56.1 | 55.3 | 56.9 | 55.4 | 54.6 | 56.1 |
| Common-law | 16.0 | 15.6 | 16.5 | 15.0Note ** | 14.6 | 15.5 | |
| Divorced, separated, or widowed | 7.4 | 7.0 | 7.8 | 12.3Note ** | 11.9 | 12.7 | |
| Single (never married and not living common law) | 20.5 | 19.9 | 21.1 | 17.3Note ** | 16.8 | 17.8 | |
| Lesbian or gay | Married | 12.5Note * | 9.9 | 15.7 | 25.3Note *** | 21.0 | 30.1 |
| Common-law | 31.6Note * | 26.6 | 37.0 | 29.3Note * | 24.4 | 34.8 | |
| Divorced, separated, or widowed | 5.7Note E: Use with caution | 4.1 | 7.8 | 9.0Note E: Use with caution | 6.6 | 12.1 | |
| Single (never married and not living common law) | 50.2Note * | 44.8 | 55.6 | 36.4Note *** | 31.6 | 41.5 | |
| Bisexual | Married | 22.5Note * | 17.6 | 28.2 | 23.3Note * | 19.9 | 27.1 |
| Common-law | 24.3Note E: Use with caution | 16.0 | 35.2 | 22.0Note * | 18.5 | 25.9 | |
| Divorced, separated, or widowed | 6.3Note E: Use with caution | 4.3 | 9.1 | 12.1Note ** | 9.6 | 15.1 | |
| Single (never married and not living common law) | 46.9Note * | 38.4 | 55.5 | 42.6Note * | 38.0 | 47.4 | |
E use with caution
Source: Statistics Canada, 2015 to 2018 Canadian Community Health Survey. |
|||||||
More than one-third of gay and lesbian older adults were single—substantially higher than among heterosexual and bisexual older adults
An estimated 75,400, or 1.5%, of the overall population aged 65 and older were lesbian, gay or bisexual. Among this population, a similar proportion were gay or lesbian (0.8%) and bisexual (0.7%). Given that the youngest in this age group were aged 55 when same-sex marriage was legalized in Canada in 2005, it is likely that their experiences reflect individual and wider societal barriers to same-sex union formation. Indeed, over one-third (36.7%) of gay and lesbian older adults were single (i.e., never married and not living common-law)—proportionately much higher than among heterosexual people (5.2%) and higher than among bisexual people of comparable age (19.9%E, Table 2). This differential was much larger than among adults aged 25 to 64 (Chart 1).
Gay men aged 65 and older were more likely to be single (44.8%) than lesbian or gay women in the same age group (22.3%E, Table 2). Older gay men were nine times more likely to be single (44.8%) than their heterosexual male counterparts (4.8%). Lesbian or gay women aged 65 and older were also more likely (22.3%E) to be single than heterosexual women of the same age group (5.5%).
| Sexual orientation | Marital status | Both sexes | Sex | |||||||
|---|---|---|---|---|---|---|---|---|---|---|
| Male | Female | |||||||||
| Percent | 95% confidence intervals | Percent | 95% confidence intervals | Percent | 95% confidence intervals | |||||
| Lower | Upper | Lower | Upper | Lower | Upper | |||||
| HeterosexualTable 2 Note † | Married | 59.6 | 58.8 | 60.4 | 71.3 | 70.3 | 72.2 | 49.9Note ** | 48.9 | 51.0 |
| Common-law | 5.1 | 4.8 | 5.4 | 6.5 | 6.0 | 7.0 | 4.0Note ** | 3.6 | 4.3 | |
| Divorced, separated, or widowed | 30.1 | 29.3 | 30.8 | 17.4 | 16.7 | 18.2 | 40.6Note ** | 39.6 | 41.6 | |
| Single (never married and not living common law) | 5.2 | 4.9 | 5.5 | 4.8 | 4.5 | 5.2 | 5.5 | 5.1 | 5.9 | |
| Lesbian or gay | Married | 16.5Note E: Use with caution Note * | 11.7 | 22.8 | 15.3Note E: Use with caution Note * | 9.3 | 24.1 | 18.6Note E: Use with caution Note * | 12.1 | 27.4 |
| Common-law | 24.1Note * | 18.3 | 30.9 | 18.7Note E: Use with caution Note * | 12.3 | 27.4 | 33.6Note E: Use with caution Note * | 23.7 | 45.1 | |
| Divorced, separated, or widowed | 22.8Note * | 18.2 | 28.1 | 21.2Note E: Use with caution Note * | 15.5 | 28.3 | 25.5Note E: Use with caution Note * | 17.9 | 34.9 | |
| Single (never married and not living common law) | 36.7Note * | 30.4 | 43.4 | 44.8Note * | 36.1 | 53.8 | 22.3Note E: Use with caution Note *** | 15.0 | 32.0 | |
| Bisexual | Married | 45.9Note * | 36.2 | 55.9 | 41.8Note * | 31.3 | 53.2 | 51.2Note E: Use with caution | 34.0 | 68.1 |
| Common-law | Note F: too unreliable to be published | F | Note F: too unreliable to be published | Note F: too unreliable to be published | F | Note F: too unreliable to be published | Note F: too unreliable to be published | Note F: too unreliable to be published | Note F: too unreliable to be published | |
| Divorced, separated, or widowed | 29.9 | 27.7 | 38.2 | 28.0Note E: Use with caution Note * | 19.9 | 37.8 | 32.3Note E: Use with caution | 20.7 | 46.5 | |
| Single (never married and not living common law) | 19.9Note E: Use with caution Note * | 13.2 | 28.8 | 24.8Note E: Use with caution Note * | 14.7 | 38.6 | 13.7Note E: Use with caution Note * | 7.5 | 23.5 | |
|
E use with caution F too unreliable to be published
Source: Statistics Canada, 2015 to 2018 Canadian Community Health Survey. |
||||||||||
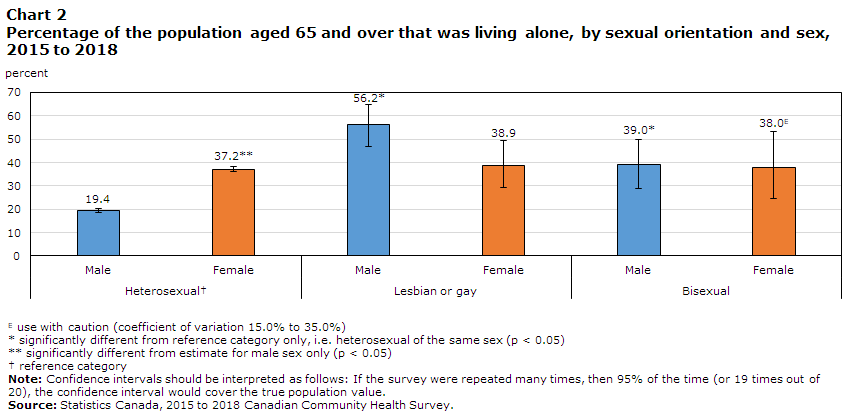
Gay men aged 65 and older were over twice as likely to live alone as their heterosexual counterparts
The 2015 to 2018 CCHS data showed that half (49.9%) of the gay and lesbian population aged 65 and older and 38.5% of bisexual older adults lived alone, compared with 29.1% of their heterosexual counterparts.Note This difference was primarily driven by gay men.
Over half (56.2%) of gay men aged 65 and older were living alone—a higher percentage and statistically different than 19.4% of heterosexual men, and 37.2% of heterosexual women of the same age group (Chart 2). No statistically significant differences were observed between the proportions of heterosexual women (37.2%), lesbian or gay women (38.9%), bisexual women (38.0%), or bisexual men (39.0%) aged 65 and older living alone.
The LGB population aged 65 and older may face unique barriers related to social isolation. Research suggests that the risk factors facing LGB seniors include not living as part of a couple, living alone, experiencing loneliness, and having few or no children.Note As such, policies and programs have called for a focus on addressing social isolation and the particular needs of the older LGB population.
LGB adults aged 25 to 64 were also more likely to live alone than their heterosexual counterparts. Individuals living alone comprised 29.9% of the gay and lesbian population and 22.3% of the bisexual population aged 25 to 64, compared with 13.6% of their heterosexual counterparts. Men aged 25 to 64 were somewhat more likely to live alone than women across all sexual orientation groups. However, this difference was more pronounced for gay men.
Data table for Chart 2
| Percent | 95% confidence intervals | ||
|---|---|---|---|
| Lower | Upper | ||
| HeterosexualData table Note † | |||
| Male | 19.4 | 18.5 | 20.4 |
| Female | 37.2Note ** | 36.1 | 38.3 |
| Lesbian or gay | |||
| Male | 56.2Note * | 46.9 | 65.0 |
| Female | 38.9 | 29.1 | 49.6 |
| Bisexual | |||
| Male | 39.0Note * | 28.9 | 50.0 |
| Female | 38.0Note E: Use with caution | 24.7 | 53.3 |
|
E use with caution (coefficient of variation 15.0% to 35.0%)
Note: Confidence intervals should be interpreted as follows: If the survey were repeated many times, then 95% of the time (or 19 times out of 20), the confidence interval would cover the true population value.
Source: Statistics Canada, 2015 to 2018 Canadian Community Health Survey. |
|||
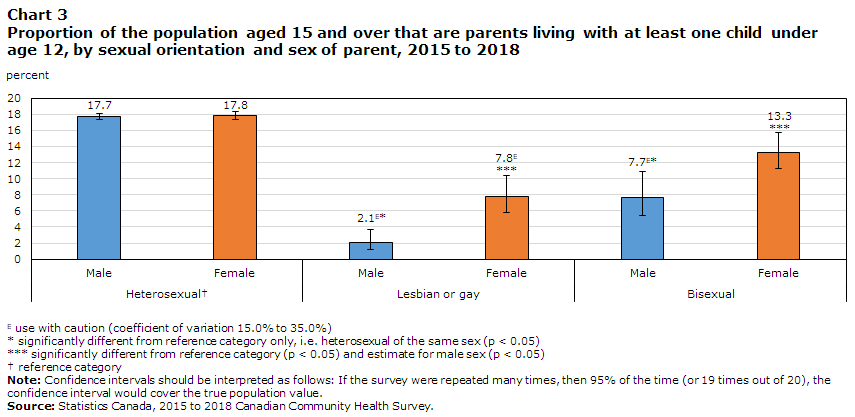
Bisexual individuals were more than twice as likely as gay and lesbian people to be parents living with young children
Bisexual individuals (13.4%) were twice as likely as gay and lesbian people (6.2%) to be parentsNote living with at least one child under the age of 18.Note In comparison, nearly one-quarter (23.6%) of the heterosexual population was made up of parents living with at least one child under the age of 18.
A similar pattern was seen for parents living with young children (i.e., with at least one child under the age of 12Note ). Bisexual people were more than twice as likely (11.5%) than gay and lesbian individuals (4.2%) to be parents living with young children, compared with 17.8% of their heterosexual counterparts. Within the LGB population, women were more likely to be parents living with young children than men (Chart 3). Bisexual women were the most likely of the LGB population to be parents living with young children, at 13.3%, compared with 7.7%E of bisexual men. Similarly, among lesbian and gay women, 7.8%E lived with young children, compared with 2.1%E of gay men. In comparison, a similar proportion of heterosexual women (17.8%) and of heterosexual men (17.7%) were parents living with young children.
Data table for Chart 3
| Percent | 95% confidence interval | ||
|---|---|---|---|
| Lower | Upper | ||
| HeterosexualData table Note † | |||
| Male | 17.7 | 17.3 | 18.1 |
| Female | 17.8 | 17.4 | 18.3 |
| Lesbian or gay | |||
| Male | 2.1Note E: Use with caution Note * | 1.2 | 3.7 |
| Female | 7.8Note E: Use with caution Note *** | 5.8 | 10.4 |
| Bisexual | |||
| Male | 7.7Note E: Use with caution Note * | 5.4 | 10.9 |
| Female | 13.3Note *** | 11.3 | 15.7 |
|
E use with caution (coefficient of variation 15.0% to 35.0%)
Note: Confidence intervals should be interpreted as follows: If the survey were repeated many times, then 95% of the time (or 19 times out of 20), the confidence interval would cover the true population value.
Source: Statistics Canada, 2015 to 2018 Canadian Community Health Survey. |
|||
Note to readers
The Canadian Community Health Survey (CCHS) is a cross-sectional survey that collects information related to health status, health care utilization and health determinants for the Canadian population. With a sample of 130,000 respondents every two years, it is a well-suited data source for research on smaller populations such as lesbian, gay and bisexual people living in Canada.
The CCHS covers the population 12 years of age and older living in all provinces and territories. Excluded from the sampling frame are individuals living on Indian Reserves and on Crown Lands, full-time members of the Canadian Forces, youth aged 12 to 17 living in foster care, and residents of certain remote regions. Institutional residents (e.g., health institutions, prisons, religious institutions, convents) are generally excluded from the sampling frame. However, some institutions, e.g., some residences for senior citizens, may have been considered in scope in the 2015 to 2018 period, depending on the level of care provided.
This article presents pooled data from the 2015 to 2016 and 2017 to 2018 cycles. The weights of the two two-year cycles were divided by two to represent the total average population over the four years. The CCHS sexual orientation variable contained three response category options: heterosexual (sexual relations with people of the opposite sex), homosexual, that is lesbian or gay (sexual relations with people of your own sex), and bisexual (sexual relations with people of both sexes). In the 2019 and subsequent cycles of the CCHS, the definitional text is omitted from these categories, and an additional response category is included for respondents to specify a sexual orientation beyond these three. The 2019 CCHS data was not included due to this change in reporting methodology and impacts on comparability for sexual orientation data.
For additional information about CCHS data quality and methodology
This study was funded by Women and Gender Equality Canada (WAGE).
- Date modified: