
Just the Facts
Online shopping in Canada, 2018
Note to readers
Do you have questions about this data release? You are invited to join our AMA (Ask Me Anything) event on Reddit on Tuesday, December 3, 2019 at 1:30 p.m. (ET), to discuss the adoption and use of digital technologies by Canadians and how the proliferation of digital technologies introduces new risks to Canadians who must take steps to protect their online privacy, security, and maintain their wellbeing.*Please note that a Reddit account is required to participate in the discussion.
As digital technologies become more and more prevalent, many Canadians turn to the Internet for shopping.
Recently released data from the Canadian Internet Use Survey (CIUS) provides a statistical portrait of the online shopping habits of Canadians over the age of 15 living in the provinces.
More than 8 in 10 Canadians shopped online in 2018
The total spending of Canadian online shoppers reached $57.4 billion in 2018, compared to $18.9 billion in 2012, with nearly 84% of Internet users buying goods or services online.
Who is shopping online?
Younger Internet users are more likely to make online purchases. In 2018, 95% of Internet users 25 to 34 years of age shopped online, while only 64% of Internet users 65 years of age or older did so (Table 1).
Internet users with a higher income were more likely to make purchases of goods and services online. A vast majority (94%) of those in the highest income quartile shopped online, whereas 70% of Internet users in the lowest income quartile did the same.
| Age Groups | % |
|---|---|
| 15 to 24 | 88.1 |
| 25 to 34 | 95.2 |
| 35 to 44 | 92.5 |
| 45 to 54 | 87.3 |
| 55 to 64 | 78.9 |
| 65 and over | 63.5 |
| Household income quartile Table 1 Note 1 Table 1 Note 2 | |
| Quartile 1 Lowest household income | 70.2 |
| Quartile 2 | 81.8 |
| Quartile 3 | 88.8 |
| Quartile 4 Highest household income | 93.5 |
|
|
The 2018 Canadian Internet Use Survey divides goods and services purchased over the Internet into four broad categories: 1) physical goods that were delivered or picked up; 2) digital goods or services; 3) peer-to-peer services; 4) other services ordered online. On average, Canadian online shoppers spent $2,554 to purchase these goods and services in 2018.
Types of online purchases: Digital goods and services
About 67% of online shoppers purchased digital goods and services. Shoppers who purchased digital goods and services spent on average $346 on them in 2018 (Table 2).
| Types of digital goods or services | Online shoppers (%) | Average expenditure ($) |
|---|---|---|
| At least one purchase of digital goods or services | 66.6 | 346 |
| Video downloads or streaming subscriptions | 35.4 | 126 |
| Music downloads or streaming subscriptions | 33.9 | 95 |
| Online gaming, gaming applications, game downloads or in-game purchases | 18.3 | 253 |
| Other applications, software or online subscriptions | 17.6 | 134 |
| E-books, audio books or podcast books | 17.1 | 83 |
| Online data-storage services | 16.0 | 59 |
| Other digital goods or services ordered over the Internet | 10.4 | 304 |
| Digital gift cards purchased online, for online redemption | 9.3 | 137 |
| Online newspapers or magazines | 7.3 | 85 |
| Video or audio podcasts, excluding podcast books | 5.0 | 22 |
| Online gambling | 2.1 | 385 |
| Note: Digital goods and services are digitally delivered and consumed, such as music or video downloads and online data-storage services. | ||
Types of online purchases: Physical goods
Of the broad categories measured by the CIUS, physical goods ordered over the Internet and delivered or picked up (87%) constituted the most frequent type of online purchase among online shoppers. Those who reported buying physical goods spent an average of $1,165 on the goods they purchased (Table 3).
| Types of physical goods | Online shoppers (%) | Average expenditureTable 3 Note 1 ($) |
|---|---|---|
| At least one purchase of physical goods | 86.6 | 1,165 |
| Clothing, jewellery or accessories | 57.6 | |
| Books or magazines | 29.4 | |
| Toys and games | 29.2 | |
| Consumer electronics | 27.2 | |
| Housewares | 24.6 | |
| Non-prescription health or beauty products | 18.3 | |
| Other physical goods ordered online | 17.7 | |
| Home improvement or gardening supplies | 14.3 | |
| Sports equipment | 13.1 | |
| Food or beverages not from restaurants | 12.6 | |
| Automotive products | 12.3 | |
| Gift cards | 9.8 | |
| Prescription drugs or products | 5.0 | |
| Non-prescription cannabis | 2.9 | |
|
||
Types of online purchases: Peer-to-peer services
One quarter of online shoppers (24%) used peer-to-peer ride services and 17% used peer-to-peer accommodation services. Of those who purchased peer-to-peer services, an average of $341 was spent on ride services and an average of $1,101 was spent on accommodation services (Table 4).
| Types of peer-to-peer services | Online shoppers (%) | Average expenditure ($) |
|---|---|---|
| Peer-to-peer ride servicesTable 4 Note 1 | 23.6 | 341 |
| Peer-to-peer accommodation servicesTable 4 Note 2 | 17.1 | 1,101 |
|
||
Types of online purchases: Other services ordered online
About 75% of online shoppers ordered some other type of service online not included in the categories above, such as travel arrangements or tickets for entertainment events. Those who purchased other services online spent an average of $1,399 online for these other services (Table 5).
| Types of services | Online shoppers (%) | Average expenditureTable 5 Note 1 ($) |
|---|---|---|
| At least one purchase of services | 74.7 | 1,399 |
| Travel arrangements | 50.3 | |
| Tickets for entertainment events | 45.6 | |
| Food or beverages delivered from restaurants | 31.9 | |
| Organized sports or fitness | 14.6 | |
| Photographic services | 8.4 | |
| Child care registration | 7.6 | |
| Other services ordered online | 5.5 | |
|
||
Purchase of physical goods online remains largely domestic
Of those who made online purchases in 2018, 37% said that they ordered goods or services online from businesses specifically because they were Canadian. Among online shoppers who purchased physical goods online, a large majority (86%) chose to purchase from Canadian online merchants (Chart 1).

Data table for Chart 1
| Percent | |
|---|---|
| Merchants in Canada | 86.1 |
| Merchants in the United States | 55.2 |
| Merchants in other countries | 31.0 |
| Merchants of unknown country of origin | 10.3 |
Methods of online payment
Different methods of payment were used by online shoppers to pay for the goods and services they ordered over the Internet. Among the most common were credit cards that were previously saved or entered at time of purchase (76%) and online payment services (39%), such as PayPal or Google Checkout. Other methods that online shoppers used to pay for goods or services were electronic bank transfers (22%), rewards points or redemption programs (16%) and a virtual wallet, such as Apple Pay or Masterpass (8%).
Problems encountered after completing an online order
More than half (55%) of online shoppers identified problems after completing an online order (Chart 2).
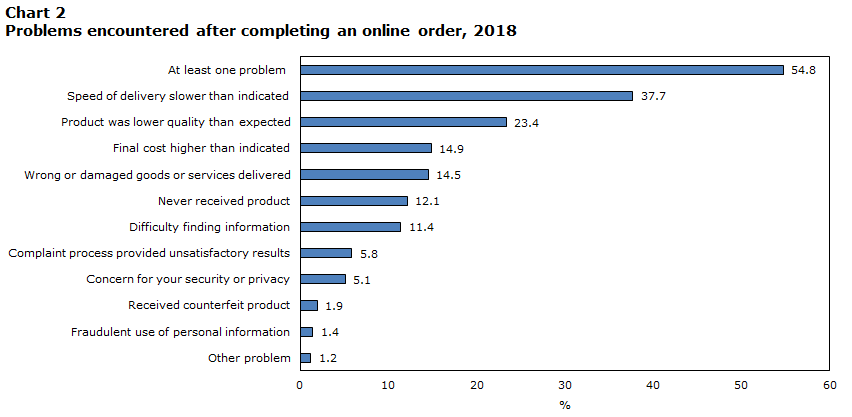
Data table for Chart 2
| Encountered a problem after completing an online order | Percent |
|---|---|
| At least one problem | 54.8 |
| Speed of delivery slower than indicated | 37.7 |
| Product was lower quality than expected | 23.4 |
| Final cost higher than indicated | 14.9 |
| Wrong or damaged goods or services delivered | 14.5 |
| Never received product | 12.1 |
| Difficulty finding information | 11.4 |
| Complaint process provided unsatisfactory results | 5.8 |
| Concern for your security or privacy | 5.1 |
| Received counterfeit product | 1.9 |
| Fraudulent use of personal information | 1.4 |
| Other problem | 1.2 |
Reasons for not shopping online
Among the 16% of Canadian Internet users that did not shop online in 2018, about half (47%) said they had no need or weren’t interested in ordering online and 22% identified a concern with security or privacy. Just over one fifth (21%) of those who reported not ordering goods or services online identified a lack of confidence, knowledge, skills or training with ordering online and 21% they wanted the opportunity to see, hold, or try on the product before purchasing it (Table 6).
| Reasons | % |
|---|---|
| No need or no interest | 47.0 |
| Security or privacy concerns | 22.3 |
| Lack of confidence, knowledge, skills or training | 20.7 |
| Wanted the opportunity to see, hold, or try on the product before purchasing | 21.3 |
| Other reason | 9.9 |
| Concerns about delivery or returns | 9.5 |
| Do not have a credit card for online transactions | 7.3 |
| Availability | 3.8 |
| Internet connection speed is too slow | 1.8 |
| Note: Data in Table 6 refers to individuals who did not use the Internet to order digital goods and services, physical goods or other services, during the past twelve months for personal or household use. | |
- Date modified: