
Just the Facts
Women’s employment in natural and applied sciences occupations in Canada, 1998 to 2018

Archived Content
Information identified as archived is provided for reference, research or recordkeeping purposes. It is not subject to the Government of Canada Web Standards and has not been altered or updated since it was archived. Please "contact us" to request a format other than those available.
March 8 is International Women's Day—a day to recognize women’s achievements and acknowledge the challenges they continue to face in the quest for gender equality. This year’s theme is #InnovateForChange, a call to action to remove the barriers facing women in science, technology, engineering, and math (STEM).
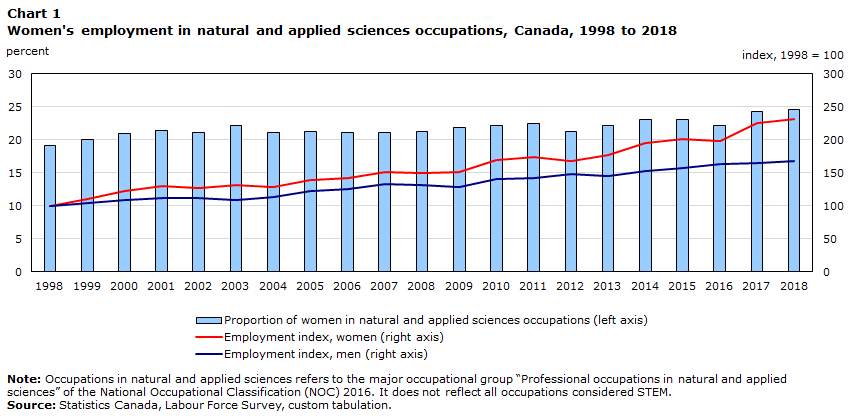
In Canada, the proportion of women among the professionals in natural and applied sciences occupations rose from 19.1% in 1998 to 24.6% in 2018, due to employment growing at a faster pace for women than for men in that major occupational group. Natural and applied sciences occupations include those in computer and information systems, engineering, architecture, as well as physical, life and actuarial sciences. For more information on women in science, see “Women in scientific occupations in Canada.”
Data table for Chart 1
| Proportion of women in natural and applied sciences occupations (left axis) | Employment index, women (right axis) | Employment index, men (right axis) | |
|---|---|---|---|
| percent | 1998 = 100 | ||
| 1998 | 19.1 | 100.00 | 100.00 |
| 1999 | 20.0 | 109.79 | 103.37 |
| 2000 | 21.0 | 121.78 | 108.11 |
| 2001 | 21.4 | 129.70 | 112.10 |
| 2002 | 21.1 | 126.51 | 111.66 |
| 2003 | 22.2 | 132.12 | 108.91 |
| 2004 | 21.1 | 127.61 | 112.62 |
| 2005 | 21.2 | 138.61 | 121.66 |
| 2006 | 21.1 | 141.58 | 124.77 |
| 2007 | 21.1 | 151.05 | 133.22 |
| 2008 | 21.2 | 150.28 | 131.43 |
| 2009 | 21.8 | 151.38 | 127.60 |
| 2010 | 22.1 | 168.98 | 140.11 |
| 2011 | 22.4 | 173.71 | 141.77 |
| 2012 | 21.2 | 168.43 | 147.45 |
| 2013 | 22.2 | 176.68 | 145.74 |
| 2014 | 23.1 | 195.16 | 153.33 |
| 2015 | 23.1 | 201.54 | 157.63 |
| 2016 | 22.2 | 197.36 | 162.63 |
| 2017 | 24.3 | 225.63 | 165.15 |
| 2018 | 24.6 | 232.01 | 167.19 |
|
Note: Occupations in natural and applied sciences refers to the major occupational group “Professional occupations in natural and applied sciences” of the National Occupational Classification (NOC) 2016. It does not reflect all occupations considered STEM. Source: Statistics Canada, Labour Force Survey, custom tabulation. |
|||
- Date modified: