
Just the Facts
Students, teachers and academic performance

Archived Content
Information identified as archived is provided for reference, research or recordkeeping purposes. It is not subject to the Government of Canada Web Standards and has not been altered or updated since it was archived. Please "contact us" to request a format other than those available.
The most recent count of elementary and secondary students in Canada put the total at just over 5 million students in 2015/2016. This continues a slight upward trend seen since 2011/2012, which mirrors the increase of the school-aged population.
For the same time period, there were 315,114 full-time educators employed in the public elementary-secondary system.
Over time, the age profile of these educators has been changing, reflecting the general aging of the labour force. The proportion of full-time educators who were less than 30 years old dropped from 13% in 2006/2007 to just over 8% in 2015/2016.

Data table for Chart 1
| Academic year | Percent |
|---|---|
| 2006/2007 | 13.3 |
| 2007/2008 | 12.8 |
| 2008/2009 | 12.2 |
| 2009/2010 | 11.3 |
| 2010/2011 | 10.5 |
| 2011/2012 | 9.8 |
| 2012/2013 | 9.4 |
| 2013/2014 | 9.1 |
| 2014/2015 | 8.9 |
| 2015/2016 | 8.6 |
| Source: Statistics Canada, Education Indicators in Canada: Report of the Pan-Canadian Education Indicators Program (81-582-X), Section C2, 37-10-0113-01. | |
The average score for student performance in reading, as measured by the Programme for International Student Assessment (PISA) was very similar in 2003 and 2015 both at the OECD average, and for Canadian students. However, for both the OECD and Canada, the average student score in math dropped between 2003 and 2015. In both reading and mathematics, the Canadian average was above the OECD average in both time periods.
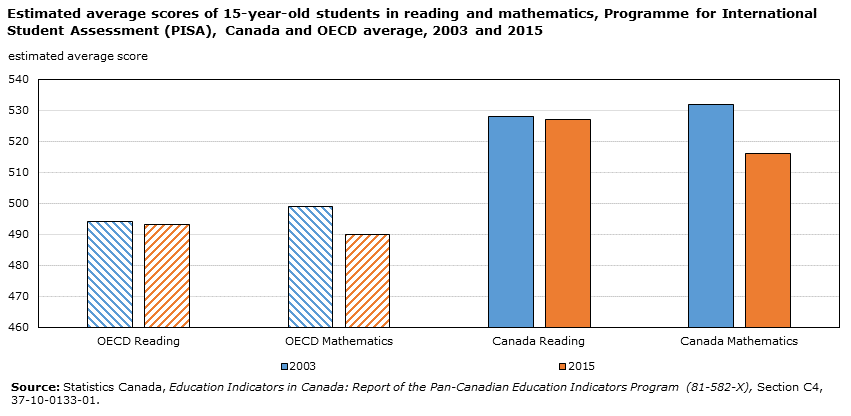
Data table for Chart 2
| 2003 | 2015 | |
|---|---|---|
| estimated average score |
||
| OECD Reading | 494 | 493 |
| OECD Mathematics | 499 | 490 |
| Canada Reading | 528 | 527 |
| Canada Mathematics | 532 | 516 |
| Source: Statistics Canada, Education Indicators in Canada: Report of the Pan-Canadian Education Indicators Program (81-582-X), Section C4, 37-10-0133-01. | ||
PISA results can also be presented as the distribution of student performance across levels of proficiency. These levels range from the lowest, level 1 to the highest, level 6. According to the OECD, level 2 can be considered a baseline of proficiency, at which students begin to demonstrate competencies that enable them to participate effectively and productively in life. In 2015, 69% of 15-year-old Canadian students exceeded this minimum proficiency level in science. This compares with the OECD average of 54%. Across the country, in all provinces, the majority of students exceeded the minimum proficiency level, with students in British Columbia, Alberta and Quebec having the highest proportion of these students.
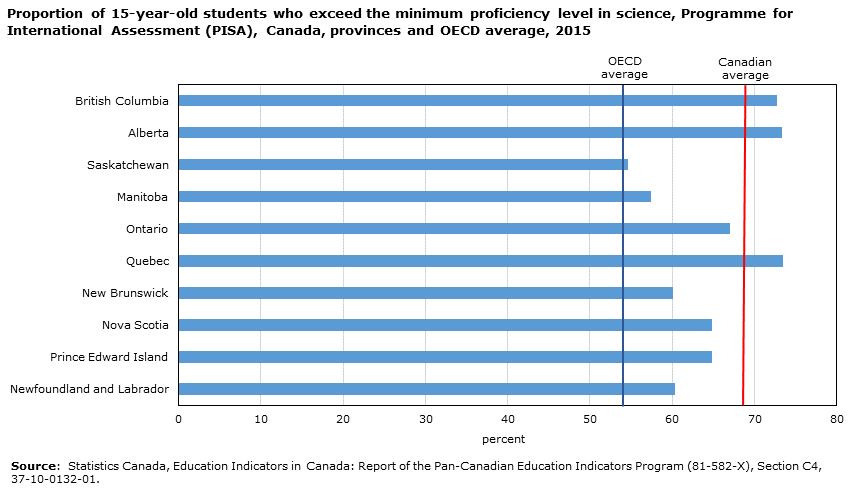
Data table for Chart 3
| Percent | |
|---|---|
| British Columbia | 72.7 |
| Alberta | 73.4 |
| Saskatchewan | 54.7 |
| Manitoba | 57.4 |
| Ontario | 67.0 |
| Quebec | 73.5 |
| New Brunswick | 60.1 |
| Nova Scotia | 64.9 |
| Prince Edward Island | 64.8 |
| Newfoundland and Labrador | 60.3 |
| Organisation for Economic Co-operation and Development (OECD) - average | 54.0 |
| Canada | 68.8 |
| Source: Statistics Canada, Education Indicators in Canada: Report of the Pan-Canadian Education Indicators Program (81-582-X), Section C4, 37-10-0132-01. | |
- Date modified: