
Juristat Bulletin—Quick Fact
Firearms and violent crime in Canada, 2021

Archived Content
Information identified as archived is provided for reference, research or recordkeeping purposes. It is not subject to the Government of Canada Web Standards and has not been altered or updated since it was archived. Please "contact us" to request a format other than those available.
by Adam Cotter
Highlights
- There were 8,047 victims of violent crime where a firearm was present in 2021, accounting for 2.6% of all victims of violent crime.
- Compared to 2020, firearm-related violent crime decreased 5% in 2021, from a rate of 29.0 victims per 100,000 population to 27.4 per 100,000.Over the same period, the rate of violent crime overall increased by 4%.
- The decline in firearm-related violent crime was driven by a decrease in urban areas, specifically in the Toronto census metropolitan area, where the rate was 22% lower in 2021 than in 2020.
- The rate of firearm-related violent crime was considerably higher in the rural Northern regions of Canada (107.1 victims per 100,000 population) than in the rural South (26.7) and urban areas (24.8). This is consistent with trends in violent crime in general.
- In 2021, the rate of firearm-related violent crime in the rural North was at its highest point since comparable data became available in 2009.
- Following a period of decline in the early 2010s, firearm-related violent crime has generally been increasing. The rate of firearm-related violent crime in 2021 was 25% higher than it was ten years earlier, in 2012.
- As has consistently been the case, handguns were the type of firearm most commonly present in firearm-related violent crime in 2021. This was especially the case in urban areas, while rifles or shotguns were more commonly present in firearm-related violent crime in rural areas.
- Physical assault, robbery, and the firearm-specific Criminal Code violations of discharging a firearm with intent, pointing a firearm, or using a firearm in the commission of an offence accounted for 80% of all firearm-related violent crime in 2021.
- Though firearms were present in a small proportion of all violent crimes, incidents where a firearm was present more commonly involved multiple victims and resulted in major injury or death compared to incidents where another type of weapon or no weapon was present.
- In 2021, there were 297 victims of homicide in Canada where shooting was the primary cause of death, a rate of 0.78 per 100,000 population. This marked the highest rate since 1992.
- Shooting was the most common cause of death among homicide victims for the sixth consecutive year, accounting for 40% of homicides in 2021. The majority (57%) of shooting homicides were committed using a handgun.
Violent crime involving firearms accounts for a small proportion of all crime that is brought to the attention of police in Canada. However, firearm-related violent crime remains a topic of concern at the federal, provincial or territorial, municipal, and individual levels, as a variety of legislative changes, funding, and programs have been proposed or introduced in recent years in an attempt to reduce and prevent this type of crime (see Allen, 2022; Public Safety Canada, 2022; Royal Canadian Mounted Police, 2022).
Using data from the Uniform Crime Reporting (UCR) Survey and the Homicide Survey, this Juristat article looks at the most recent trends in firearm-related violent crime. In the context of this analysis, a firearm-related violent crime is one where a firearm was present during the commission of the offence and police deemed that the firearm was relevant to the crime. It is important to note that in this analysis, UCR data for the province of Quebec is excluded due to data quality concerns with the weapon variable; specifically, a large proportion of incidents where the most serious weapon present was reported as unknown.Note
Recently, the Canadian Centre for Justice and Community Safety Statistics (CCJCSS) at Statistics Canada, the Canadian Association of Chiefs of Police, and police services across the country have collaborated to improve the UCR Survey, particularly as it pertains to improving data on and knowledge of firearms and crime in Canada. Changes to the UCR Survey include a standardized definition of a shooting, a crime gun, and the introduction of new variables to better capture key information on firearms (see Text box 2; Allen, 2022). Future analysis on the topic of firearms and violent crime can include this information, as police services continue to update their records management systems to incorporate these changes.
This article was produced with funding support from Public Safety Canada.
Firearm-related violent crime declined in 2021, while overall violent crime increased
Most police-reported violent crime in 2021 did not involve the presence of a weapon. Overall, about one-quarter (23%) of all victims of violent crime experienced an incident where a weapon—such as a firearm, knife, blunt instrument, or any other type of weapon—was present during the commission of the offence. Specifically, 2.6% of all victims of police-reported violent crime were victims in an incident with a firearm present (Table 1). Firearms were the fourth most common type of weapon present among victims of violent crime in 2021, after knives (5.9%), burning liquid or caustic agents (2.9%), and clubs or blunt instruments (2.7%).Note
There were 8,047 victims of violent crime where a firearm was present in 2021, a rate of 27.4 victims per 100,000 population. This marked 417 fewer victims of firearm-related violent crime from 2020, and a corresponding 5% decline in the rate (from 29.0 per 100,000) (Table 2). In contrast, violent crime overall was up 4% in 2021 (Chart 1).
Chart 1 start

Data table for Chart 1
| Year | Violent crime | Firearm-related violent crime |
|---|---|---|
| rate per 100,000 population | ||
| 2009 | 1,262 | 28.6 |
| 2010 | 1,246 | 23.2 |
| 2011 | 1,148 | 21.9 |
| 2012 | 1,093 | 21.9 |
| 2013 | 994 | 19.2 |
| 2014 | 937 | 21.0 |
| 2015 | 956 | 25.0 |
| 2016 | 955 | 26.1 |
| 2017 | 983 | 27.7 |
| 2018 | 1,015 | 27.0 |
| 2019 | 1,105 | 28.7 |
| 2020 | 1,076 | 29.0 |
| 2021 | 1,115 | 27.4 |
|
Note: Excludes Quebec due to a large proportion of cases where the most serious weapon present was reported as unknown. Source: Statistics Canada, Canadian Centre for Justice and Community Safety Statistics, Uniform Crime Reporting Survey (Trend Database). |
||
Chart 1 end
Despite some year-over-year fluctuations, firearm-related violent crime and total violent crime have generally been increasing following a period of decline in the early 2010s; firearm-related violent crime reached its lowest point in 2013, while 2014 marked the low point for violent crime in general.
Notwithstanding these general similarities, in recent years there have been some differing trends. Compared to five years prior, in 2017, the firearm-related violent crime rate in 2021 was similar (-1%), while total violent crime was up 13%. In contrast, compared to a decade before, violent crime was 2% higher in 2021, while the rate of firearm-related violent crime was 25% higher (21.9 in 2012 versus 27.4 in 2021).
Firearm-related violent crime down in urban areas and the rural South, but up in the rural North
A national portrait of firearm-related violent crime provides some important information, but it is essential to examine lower levels of geography as the context of firearm-related crime can be quite different in various parts of the country. One key piece of information to consider is the urban or rural and Northern or Southern context, both overall and within individual provinces and territories. Indeed, based on police-reported data, there are some wide regional variations in the prevalence and change over time of firearm-related violent crime, particularly when looking at urban areas compared to the rural North and rural South.
For the purposes of police-reported data, rural police services are those where the majority of the population served lives outside of a census metropolitan area (CMA) or census agglomeration (CA);Note rural North includes rural police services in the Territories and Provincial North while rural South includes rural police services in the southern regions of the provinces. Urban police services are those where the majority of the population lives within a CMA or CA.Note
Specifically, in 2021, the rate of firearm-related violent crime was 107.1 victims per 100,000 population in the rural North, approximately four times higher than the rates in the rural South (26.7) and in urban areas (24.8). At the same time, the rate of total violent crime recorded in the rural North was 4,609 victims per 100,000 population—almost four times higher than the rural South (1,206) and nearly five times higher than urban Canada (983) (Table 1; Table 2).
Compared to the previous year, both urban areas and the rural South recorded decreases in their rates of firearm-related violent crime (-8% and -11%, respectively) (Chart 2). The rural North, in contrast, saw an increase of 158 victims of firearm-related violent crime, resulting in a 22% increase in rate and reaching its highest point since comparable data became available in 2009. Most of this increase was driven by a greater number of victims of firearm-related violent crime in rural Northern Alberta (+58), Manitoba (+38), and Nunavut (+34).
Chart 2 start

Data table for Chart 2
| Year | Urban | Rural South | Rural North |
|---|---|---|---|
| rate per 100,000 population | |||
| 2009 | 29.5 | 17.3 | 53.4 |
| 2010 | 22.9 | 16.9 | 56.4 |
| 2011 | 21.3 | 18.1 | 53.8 |
| 2012 | 21.1 | 19.4 | 53.2 |
| 2013 | 18.7 | 15.1 | 50.6 |
| 2014 | 20.5 | 16.8 | 53.2 |
| 2015 | 24.4 | 19.5 | 64.1 |
| 2016 | 25.1 | 20.5 | 75.5 |
| 2017 | 26.8 | 22.1 | 74.9 |
| 2018 | 26.2 | 20.8 | 74.7 |
| 2019 | 27.4 | 24.9 | 80.7 |
| 2020 | 26.9 | 30.1 | 88.0 |
| 2021 | 24.8 | 26.7 | 107.1 |
|
Note: Excludes Quebec due to a large proportion of cases where the most serious weapon present was reported as unknown. Rural North includes all rural police services in the Territories or in the Provincial North. Provincial North encompasses the northern regions of Newfoundland and Labrador, Ontario, Manitoba, Saskatchewan, Alberta and British Columbia (North and South - Variant of SGC 2016). Rural South refers to rural police services in the southern regions of these provinces as well as Prince Edward Island, Nova Scotia and New Brunswick. Source: Statistics Canada, Canadian Centre for Justice and Community Safety Statistics, Uniform Crime Reporting Survey (Trend Database). |
|||
Chart 2 end
Compared to a decade ago, firearm-related violent crime in 2021 was higher in each of these three geographic regions. However, the magnitude of the increases was quite different, with the rate of firearm-related violent crime having increased 18% in urban areas, 38% in the rural South, and 101% in the rural North since 2012.
More recently, compared to five years prior in 2017, the rate of firearm-related violent crime decreased in urban areas (-7%), while increasing in both the rural South (+21%) and rural North (+43%).
Firearm-related violent crime rates highest in the Territories and Prairie provinces
Similar to violent crime in general (Moreau, 2022) and consistent with previous trends in firearm-related violent crime (Allen, 2022), the highest rates of firearm-related violent crime were recorded in the Territories and the Prairie provinces in 2021 (Table 1; Table 2). Nunavut (172.6 victims per 100,000 population) and the Northwest Territories (160.4) had the highest rates, followed by Saskatchewan (82.5) and Manitoba (57.8). In contrast, the lowest rates were found in British Columbia (18.1), Newfoundland and Labrador (15.0), and Prince Edward Island (7.3).
While there were fluctuations across the country, Ontario was the main driver of the overall decline in firearm-related violent crime between 2020 and 2021. There were 522 fewer victims of firearm-related violent crime in Ontario in 2021, while in the rest of the provinces and territories combined, there was an increase of 105 victims.
After Ontario (-522 victims and a 15% decrease in rate), the next largest decreases were recorded in Alberta (-47 victims, -3% in rate), British Columbia (-32 victims, -4% in rate), and Nova Scotia (-20 victims, -10% in rate).Note
In both Alberta and British Columbia, the decreases at the provincial level were the result of substantial declines in the rural Southern regions. In the rural South of Alberta, there was a 36% decrease in rate and 100 fewer victims of firearm-related violent crime; in British Columbia’s rural South, the rate was 39% lower due to 47 fewer victims.
These declines in the number of victims between 2020 and 2021 were somewhat offset by increases in Manitoba (+96 victims and a 14% increase in rate), Saskatchewan (+73 victims, +8% in rate), and Nunavut (+34 victims, +99% in rate).
Start of text box 1
Text box 1
Counting incidents rather than victims as a measure of
firearm-related violent crime
In this article, as with most measures of violent crime, analysis is based on a count of victims. In other words, numbers and rates presented reflect the number of victims in incidents where a firearm was present. Under this approach, for incidents with multiple victims, each victim is counted individually as a separate “firearm-related crime”.
However, some violent violations in the Uniform Crime Reporting Survey do not necessarily require police to provide information about the victim or victims. In the case of firearm-specific violent offences a victim record can be provided, but is not always required as some incidents (e.g., shootings) may not have a victim. For that reason, an alternative way to examine trends in firearm-related violent crime is to look at the number of incidents, rather than victims.
In 2021, police reported 8,265 violent incidents where a firearm was present. This marked the first time since comparable data became available in 2009 that there were more incidents of firearm-related violent crime than there were victims (8,047). These 8,047 victims were involved in 6,157 separate incidents, as about one-quarter (26%, or 2,108 incidents) of firearm-related incidents reported by police did not include victim information. The proportion of firearm-related incidents for which victim information was not provided has increased in recent years. It was 18% in 2009, 20% or 21% each year from 2010 to 2017, 22% in 2018, 24% in 2019, and 26% in 2020 and 2021.
The majority (60%) of these firearm-related incidents which did not have victim information were the three firearm-specific Criminal Code offences: discharging a firearm (36%), pointing a firearm (18%), and using a firearm in the commission of an offence (6%). Uttering threats (22%) and robbery (15%) accounted for most of the remaining incidents.Note
The incident count approach or the victim-based approach yield similar results. For instance, in 2021, similar to the rate of victims, the highest rates of firearm-related incidents were found in Nunavut (178 incidents per 100,000 population), the Northwest Territories (167), Saskatchewan (92), Yukon (65), and Manitoba (53). An incident count also shows that handguns were most commonly involved in firearm-related violent crime (51%). Finally, overall trends in both measures are similar as well, with both the victim-based measure and the incident measure having shown a general increase since reaching a low point in 2013 (Chart 3).
Chart 3 start

Data table for Chart 3
| Year | Victims of firearm-related violent crime | Incidents of firearm-related violent crime |
|---|---|---|
| rate per 100,000 population | ||
| 2009 | 28.6 | 24.2 |
| 2010 | 23.2 | 20.5 |
| 2011 | 21.9 | 19.6 |
| 2012 | 21.9 | 19.5 |
| 2013 | 19.2 | 17.3 |
| 2014 | 21.0 | 19.3 |
| 2015 | 25.0 | 23.0 |
| 2016 | 26.1 | 23.9 |
| 2017 | 27.7 | 25.3 |
| 2018 | 27.0 | 25.7 |
| 2019 | 28.7 | 27.9 |
| 2020 | 29.0 | 28.8 |
| 2021 | 27.4 | 28.2 |
|
Note: Excludes Quebec due to a large proportion of cases where the most serious weapon present was reported as unknown. Source: Statistics Canada, Canadian Centre for Justice and Community Safety Statistics, Uniform Crime Reporting Survey (Trend Database). |
||
Chart 3 end
End of text box 1
Decline in firearm-related crime driven by decrease in Toronto
As noted, the decline in firearm-related violent crime was driven by urban areas—more specifically, by declines in Canada’s largest CMA, Toronto.Note Compared to the previous year, there were 405 fewer victims of violent crime in incidents involving firearms in Toronto, resulting in a 22% decrease in rate (from 31.4 in 2020 to 24.5 in 2021) (Table 3). Despite having the highest number of victims by a considerable margin due to its size, Toronto’s firearm-related violent crime rate ranked thirteenth among CMAs in 2021.
The highest rates among CMAs were recorded in the Prairie provinces. More specifically, Regina (68.5), Winnipeg (56.9), and Saskatoon (46.7) had the highest firearm-related violent crime rates among CMAs in 2021. For each of these CMAs, these rates represented increases compared to 2020 (+12%, +8%, and +8%, respectively).
Aside from Toronto, trends varied slightly in Canada’s other largest CMAs in 2021.Note In Alberta, for instance, Calgary (+7% to 37.1 per 100,000) and Edmonton (-9% to 26.5) trended in opposite directions. However, Vancouver (-8% to 15.4) and OttawaNote (-5% to 15.9) both recorded declines.
Some CMAs recorded considerable changes in 2021. For instance, the rate in Thunder Bay more than doubled (from 10.3 to 26.5) due to an increase in the number of victims (from 13 in 2020 to 33 in 2021). The opposite was seen in Brantford, where the 2021 rate of 26.3 was less than half of the 2020 rate (56.2), due to 43 fewer victims. As a result, Brantford moved from the second-highest firearm-related violent crime rate among CMAs in 2020, behind only Regina, to the eleventh-highest in 2021.
Northern regions have highest rates of firearm-related violent crime in all provinces
Across the provinces,Note the highest rates of firearm-related violent crime were seen in their rural Northern areas (Table 1; Table 2). Rural Northern Saskatchewan, with 2 fewer victims than 2020, had a very slight year-over-year decline in rate, but recorded the highest rate in the country (467 per 100,000) for the seventh consecutive year.
While this pattern was also seen in Ontario, the difference was smaller than that observed in other provinces. The rate of firearm-related violent crime in Ontario’s rural North was 26.9 per 100,000, compared with 21.2 in urban Ontario and 11.9 in rural Southern Ontario.
Though rates of firearm-related violent crime were higher in the Northern regions of the country, this is likely largely a reflection of crime in general, which is highest in the North (Allen & Perreault, 2015; Perreault, 2019). Proportionately speaking, firearms were present in a similar percentage of incidents across the country, in urban areas (2.6%), the rural South (2.4%), and the rural North (2.5%).
Many of the areas in Canada with the highest rates of firearm-related violent crime had relatively lower proportions of violent crime involving firearms. For instance, in the Territories, there was a firearm present during the commission of the offence for under 2% of victims of violent crime in 2021 (1.5%, 1.7%, and 1.8% in the Yukon, the Northwest Territories, and Nunavut, respectively). Likewise, despite the high rate of firearm-related violent crime in rural Northern Manitoba, 1.9% of victims experienced an incident where a firearm was present.
Rural Northern Saskatchewan, which as noted had the highest rate of firearm-related violent crime in the country, had a proportion higher than the national average of 2.6%, with 3.5% of victims of violent crime involved in a firearm-related incident. However, that proportion was lower than what was reported in both the rural South (4%) and urban (5%) areas of Saskatchewan.
Start of text box 2
Text box 2
Data gaps related to firearms
There are limitations in the information collected by the Uniform Crime Reporting (UCR) Survey when it comes to firearms used in crime. For instance, there is little information currently collected about the characteristics of these firearms, such as its origin, if it was stolen, details about the exact type of gun, who owned it (e.g., accused, victim, or someone else), how it was stored, or whether the owner was licensed. This information is sometimes not recorded by police services, recorded inconsistently or, in some cases, simply not available.
Consequently, following consultation with key stakeholders, a number of revisions to the UCR Survey were made beginning in 2021. It may take a few years for these changes to be fully implemented by police services in a way that allows the reporting of this information to the UCR.
These changes include:
- collecting information on the number of firearms recovered, seized, or stolen in a criminal incident;
- improving measures related to “shootings” by developing a standard definition to be used by police services and adding a variable to the UCR Survey to identify whether a firearm was discharged in an incident; and
- developing a standard definition for a “crime gun” to be used by police services to identify a) firearms (as defined under the Criminal Code) that are used or suspected to be used in the commission of a criminal offence, regardless of whether the firearm was possessed legally; or b) a firearm that has an obliterated, altered, or removed serial number.
In addition to working to improve data collection for information directly related to firearms, going forward, Statistics Canada is also committed to working with the policing community and key organizations to enable police to report statistics on Indigenous and racialized groups in police-reported crime statistics for victims and accused persons, including those involved in firearm-related incidents (Statistics Canada, 2020).
End of text box 2
Violent crime involving handguns, rifles or shotguns, or other firearms all declined in 2021
As has consistently been the case, just over half (54%) of firearm-related violent crime in 2021 involved handguns. Though remaining the most common type of firearm present, the handgun-related violent crime rate (14.8 victims per 100,000 population) in 2021 was 6% lower than the previous year, and at its lowest point since 2014, when it was at 12.8 (Chart 4; Table 4).
Chart 4 start
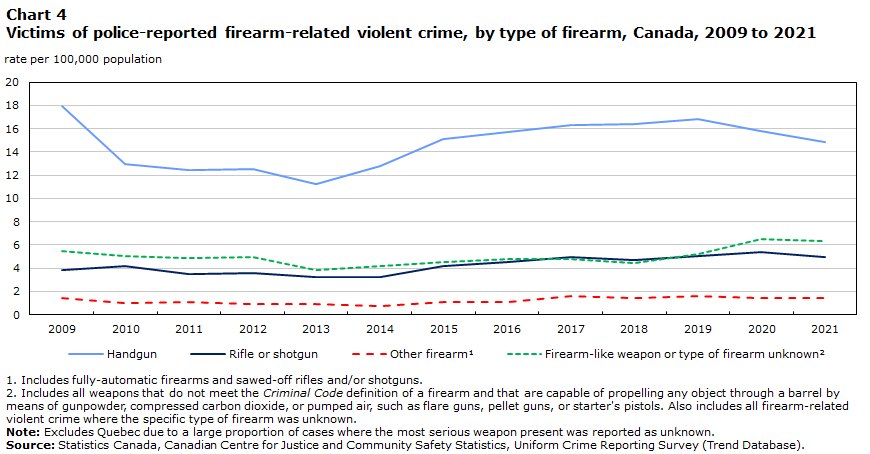
Data table for Chart 4
| Year | Handgun | Rifle or shotgun | Other firearmData table for chart 4 Note 1 | Firearm-like weapon or type of firearm unknownData table for chart 4 Note 2 |
|---|---|---|---|---|
| rate per 100,000 population | ||||
| 2009 | 18.0 | 3.8 | 1.4 | 5.4 |
| 2010 | 13.0 | 4.2 | 1.0 | 5.1 |
| 2011 | 12.5 | 3.5 | 1.1 | 4.9 |
| 2012 | 12.5 | 3.6 | 0.9 | 4.9 |
| 2013 | 11.2 | 3.2 | 0.9 | 3.9 |
| 2014 | 12.8 | 3.3 | 0.8 | 4.2 |
| 2015 | 15.1 | 4.2 | 1.1 | 4.6 |
| 2016 | 15.7 | 4.5 | 1.1 | 4.8 |
| 2017 | 16.3 | 4.9 | 1.6 | 4.8 |
| 2018 | 16.4 | 4.7 | 1.4 | 4.4 |
| 2019 | 16.8 | 5.0 | 1.6 | 5.2 |
| 2020 | 15.7 | 5.4 | 1.5 | 6.5 |
| 2021 | 14.8 | 4.9 | 1.4 | 6.3 |
Source: Statistics Canada, Canadian Centre for Justice and Community Safety Statistics, Uniform Crime Reporting Survey (Trend Database). |
||||
Chart 4 end
Firearm-related violent crime involving a rifle or shotgun also declined in 2021, with 115 fewer victims representing an 8% decrease in rate (from 5.4 per 100,000 in 2020 to 4.9 in 2021). Similar to previous years, just under one in five (18%) victims of firearm-related violent crime in 2021 were in an incident where a rifle or shotgun was present.
The other categories of firearm captured by the UCR also recorded year-over-year declines, though to a lesser extent than handguns and rifles or shotguns. There were 15 fewer victims in incidents involving a sawed-off rifle or shotgun or a fully-automatic firearm. The decline in this category was fully attributable to sawed-off rifles and shotguns, as the number of victims in incidents involving a fully automatic firearm was stable (43 in 2020 and 43 in 2021). Fully automatic firearms account for a relatively small number of victims of police-reported firearm-related violent crime in a given year in Canada, ranging from a low of 39 victims in 2014 to a high of 67 in 2017. There were also 38 fewer victims in incidents involving a firearm-like weapon or an unknown type of firearm.Note
Handguns most common in urban areas, while rifles or shotguns more often present in rural areas
In terms of the geographic distribution of firearms present in violent crime, once again the data in 2021 was consistent with past trends. Handguns accounted for nearly two-thirds (63%) of firearms present in firearm-related violent crime in urban areas, well above the proportions in the rural South (26%) and rural North (20%) (Chart 5). In rural areas, a rifle or shotgun was most common, representing the firearm present for about four in ten firearm-related violent crimes—both in the South (38%) and the North (40%).
Chart 5 start

Data table for Chart 5
| Geography | Handgun | Rifle or shotgun | Other firearmData table for chart 5 Note 2 | Firearm-like weapon or unknown type of firearmData table for chart 5 Note 3 |
|---|---|---|---|---|
| percent | ||||
| Total | 54.0 | 18.0 | 5.1 | 23.0 |
| Urban | 63.2 | 11.6 | 4.6 | 20.6 |
| Rural South | 26.1 | 38.3 | 6.3 | 29.3 |
| Rural North | 20.1 | 40.4 | 7.2 | 32.4 |
| Toronto CMA | 86.3 | 1.4 | 0.8 | 11.6 |
| Vancouver CMA | 71.5 | 6.1 | 3.0 | 19.4 |
| Calgary CMA | 68.0 | 11.2 | 1.7 | 19.0 |
| Edmonton CMA | 57.9 | 15.5 | 9.6 | 17.0 |
| Ottawa CMAData table for chart 5 Note 1 | 73.0 | 5.1 | 1.1 | 20.8 |
| Winnipeg CMA | 52.6 | 17.7 | 8.0 | 21.7 |
| Regina CMA | 18.2 | 21.0 | 17.7 | 43.1 |
| Saskatoon CMA | 36.9 | 19.4 | 14.4 | 29.4 |
Source: Statistics Canada, Canadian Centre for Justice and Community Safety Statistics, Uniform Crime Reporting Survey (Trend Database). |
||||
Chart 5 end
While handguns were most commonly present in urban areas in general, there were still variations across the country. For example, in Toronto, almost nine in ten (86%) victims of firearm-related violent crime in 2021 were victims of an incident where a handgun was present. In Regina, the CMA with the highest rate of firearm-related violent crime in 2021, more than four in ten (43%) victims of firearm-related violent crime were involved in an incident where a firearm-like weapon or unknown type of firearm was present.
Start of text box 3
Text box 3
Organized crime, street gangs, and firearm-related violent
crime
The Uniform Crime Reporting Survey started collecting information from police on organized crime and street gang activity in 2016.Note Note
Looking at the subset of police services where this information was reported,Note in 2021, 6% of victims of firearm-related violent crime were victims of an incident that was confirmed or suspected to be linked to organized crime or street gang activity. This is in contrast to 0.6% of victims of a violent crime involving another type of weapon, and 0.2% of victims of violent crime where no weapon was present.
Stated otherwise, unlike violent crime in general, where a large majority of incidents did not involve a weapon and firearms were present for 2.6% of victims overall, the proportions were much different when it came to organized crime or street gangs. Of victims of violent crime where the incident was confirmed or suspected to be related to organized crime or street gang activity, 36% involved no weapon, 35% involved a firearm, and 29% involved another type of weapon.
Like firearm-related violent crime in general, handguns were most commonly present among victims of firearm-related crime that was also linked to organized crime or street gang activity (56%). This was followed by rifles or shotguns (19%) and firearm-like weapons or unknown types of firearm (18%).
End of text box 3
Overall downward trend in firearm-related violent crime largely the result of fewer robberies
In 2021, physical assault, robbery, and Criminal Code firearms offences comprised the majority (80%) of victims of firearm-related violent crime, with all other violent offences combined accounting for the remainder. The decline in the number of victims of firearm-related violent crime in 2021 was, in large part, due to 373 fewer victims of robbery involving a firearm, a 16% decrease in rate (Table 5). Robbery with a firearm present accounted for 16% of all victims of robbery in Canada in 2021.Note
The decline in firearm-related robberies also mirrors a decline in robberies overall in recent years (Moreau, 2022), a shift that may be related to pandemic-related measures and restrictions such as people being at home more often and changing models for many retail businesses.
Other declines were observed in the number of victims of uttering threats with a firearm present (-64 victims, -9% in rate) and in the category of homicide, other violations causing death, and attempted murder (-26 victims, -5% in rate). Of note, a firearm was present in 45% of these offences in 2021, higher than any other violent offence category with the exception of firearm-specific violations.
There are three violent Criminal Code offences which, by definition, involve firearms, and as a whole these offences declined in 2021 (-54 victims). In particular, discharging a firearm with intent (-63 victims) and pointing a firearm (-15 victims) decreased. In contrast, there was an increase (+24 victims) in the use of a firearm in the commission of an offence.
Notably, there was an increase in the number of victims of firearm-related physical assault in 2021, from 2,379 victims to 2,474 (+95). Most of the increase was seen in major assaults (levels 2 and 3).
Start of text box 4
Text box 4
Other offences involving firearms in Canada
Not all crime involving firearms is classified as violent. There are a number of other offences, including break and enter to steal a firearm, and a range of administrative weapons offences, including unsafe storage, for which police report information to the Uniform Crime Reporting (UCR) Survey. For more information on detailed violation-based statistics, the following tables can be consulted: 35-10-0001-01, 35-10-0002-01, 35-10-0026-01, 35-10-0061-01 to 35-10-0064-01, 35-10-0066-01, 35-10-0067-01 and 35-10-0177-01 to 35-10-0191-01.
In addition, another measure of firearm-related crime in Canada is the number of incidents in which a stolen firearm was reported to police. In the UCR Survey, police can identify up to five different types of property stolen in an incident, including four separate categories for firearms: restricted weapons, rifles, shotguns, and other firearms. In 2021, there were 2,184 incidents where at least one firearm was among the property stolen.Note This represented a 17% decline in the number of incidents compared to 2020 (2,618). In fact, 2020 and 2021 represented the lowest number of incidents where a firearm was stolen since comparable data became available in 2009. The COVID-19 pandemic and accompanying restrictions may have been a driver of this decline in these years, as with many other types of crime, particularly related to property crime (Moreau, 2022). That said, incidents where firearms were stolen have been on a downward trend since 2015, when they peaked at 4,141 incidents.
In 2021, rifles were the type of firearm most commonly reported stolen (1,235 incidents of at least one rifle being stolen), followed by shotguns (574), other firearms (491), and restricted firearms (309).Note Rifles have been the most common type of firearm reported as stolen each year since 2009, when trend data became available.
End of text box 4
Multiple-victim incidents more common when a firearm is present
Though firearm-related violent crime accounts for a small minority of violent crime in general, firearms are overrepresented both in incidents of violent crime where there are multiple victims, and violent crimes which result in major injury or death.
In 2021, one in five (21%) victims of firearm-related violent crime were involved in an incident with two (15%) or three or more (6%) victims. Violent incidents with another type of weapon (where 11% involved two victims and 3% involved three or more) or where no weapon was present (where 7% involved two victims and 1% involved three or more) less commonly involved multiple victims.
The proportion of multiple-victim incidents was similar for incidents involving a handgun (16% had two victims, 6% three or more) and a rifle or shotgun (15% had two victims, 7% three or more).
In addition to the presence of a weapon, the weapon causing injury is also captured by the UCR Survey, in incidents in which the victim sustains physical injury as a result. In 2021, four in ten (41%) victims of violent crime were physically injured in the incident, with the vast majority (93%) of these injuries classified as minor. The remaining injuries that resulted from violent crime were major (6%) or caused the death of the victim (0.6%).
Of all victims of violent crime who sustained injuries in 2021, a firearm was the weapon causing injury for 1.7%, or more than 2,000 victims. When a firearm caused an injury in a violent crime in 2021, it was most commonly a minor injury (56%), followed by a major injury (31%) or death (13%). When any other weapon or physical force was the cause of an injury, the corresponding proportions were 94%, 6%, and 0.3%.
Victims and persons accused of firearm-related violent crime
The majority of victims of firearm-related violent crime in 2021 were men, consistent with previous trends. Of all victims where both age and genderNote was known to police, 59% were adult men, 29% were adult women, 8% were boys, and 4% were girls.Note
Half (49%) of victims of firearm-related violent crime in 2021 were victimized by a stranger, a proportion that was twice as high as that for victims of violent crime in general (25%). There were 803 victims of firearm-related intimate partner violence in 2021, accounting for 10% of all victims of firearm-related violent crime. More than four in five (84%) victims of firearm-related intimate partner violence were women and girls.
For six in ten (58%) victims of firearm-related violent crime in 2021, the incident was solved; that is, an accused person was identified and the incident was cleared via the laying or recommendation of charges (53%) or cleared otherwise (5%), which includes the victim requesting that no further action be taken or departmental discretion, for example. The remaining (42%) incidents were not cleared, most commonly due to insufficient evidence to proceed (21%) or because the investigation was still open (16%).
There were over 5,600 persons accused in an incident of violent crime where a firearm was present in 2021.Note The large majority (87%) were men and boys. Among accused persons where both age and gender were known to police, there were 769 youth (aged 12 to 17) accused of a firearm-related violent crime in 2021; nine in ten (89%) of these youth accused were boys and the remainder (11%) were girls. Incidents with a youth accused most commonly involved handguns (54%) or firearm-like weapons or unknown types of firearm (35%).
For more detail on recent trends in characteristics of victims and persons accused of firearm-related violent crime, see Allen, 2022.
Firearm-related homicide in Canada, 2021
In contrast to the downward trend in firearm-related violent crime overall, homicides involving a firearm increased in 2021: police in CanadaNote reported 297 homicides where the cause of death was shooting, up from 278 in 2020. This represented a rate of 0.78 victims per 100,000 population, a 6% increase from the previous year (0.73 per 100,000). At the same time, the overall number of homicides increased as well, from 759 in 2020 to 788 in 2021, resulting in a 3% increase in rate.
The 297 victims of shooting homicides was the highest number recorded since the inception of the Homicide Survey in 1961, surpassing the previous high of 292 victims in 1975. That said, the population has grown considerably over this time, and the rate of firearm homicide in 2021 was 38% lower than at its peak (1.26 per 100,000 population in 1975) (Chart 6). Though the 2021 rate remained lower than the peak of firearm-related homicide, it was the highest rate recorded in Canada since 1992, when shootings caused the death of 247 victims, a rate of 0.87 per 100,000 population.
Chart 6 start

Data table for Chart 6
| Year | Shooting | Stabbing | Beating | All other methods |
|---|---|---|---|---|
| rate per 100,000 population | ||||
| 1971 | 0.87 | 0.31 | 0.42 | 0.32 |
| 1972 | 0.90 | 0.35 | 0.41 | 0.48 |
| 1973 | 0.97 | 0.41 | 0.46 | 0.28 |
| 1974 | 1.24 | 0.41 | 0.57 | 0.36 |
| 1975 | 1.26 | 0.54 | 0.70 | 0.50 |
| 1976 | 1.10 | 0.58 | 0.63 | 0.53 |
| 1977 | 1.10 | 0.63 | 0.64 | 0.62 |
| 1978 | 1.04 | 0.61 | 0.63 | 0.45 |
| 1979 | 0.86 | 0.67 | 0.55 | 0.51 |
| 1980 | 0.79 | 0.56 | 0.48 | 0.54 |
| 1981 | 0.80 | 0.71 | 0.62 | 0.44 |
| 1982 | 0.99 | 0.72 | 0.49 | 0.43 |
| 1983 | 0.89 | 0.68 | 0.60 | 0.50 |
| 1984 | 0.89 | 0.74 | 0.46 | 0.50 |
| 1985 | 0.86 | 0.88 | 0.47 | 0.50 |
| 1986 | 0.67 | 0.63 | 0.48 | 0.37 |
| 1987 | 0.76 | 0.70 | 0.51 | 0.43 |
| 1988 | 0.63 | 0.63 | 0.52 | 0.35 |
| 1989 | 0.79 | 0.62 | 0.47 | 0.48 |
| 1990 | 0.70 | 0.77 | 0.47 | 0.40 |
| 1991 | 0.97 | 0.80 | 0.51 | 0.40 |
| 1992 | 0.87 | 0.74 | 0.53 | 0.42 |
| 1993 | 0.68 | 0.67 | 0.40 | 0.42 |
| 1994 | 0.68 | 0.53 | 0.37 | 0.46 |
| 1995 | 0.59 | 0.62 | 0.41 | 0.35 |
| 1996 | 0.72 | 0.66 | 0.44 | 0.28 |
| 1997 | 0.65 | 0.56 | 0.38 | 0.35 |
| 1998 | 0.50 | 0.62 | 0.41 | 0.30 |
| 1999 | 0.55 | 0.47 | 0.41 | 0.32 |
| 2000 | 0.60 | 0.49 | 0.42 | 0.25 |
| 2001 | 0.55 | 0.55 | 0.39 | 0.26 |
| 2002 | 0.49 | 0.58 | 0.40 | 0.32 |
| 2003 | 0.52 | 0.45 | 0.39 | 0.33 |
| 2004 | 0.54 | 0.64 | 0.43 | 0.30 |
| 2005 | 0.69 | 0.61 | 0.44 | 0.26 |
| 2006 | 0.59 | 0.64 | 0.37 | 0.23 |
| 2007 | 0.57 | 0.57 | 0.36 | 0.23 |
| 2008 | 0.60 | 0.61 | 0.37 | 0.23 |
| 2009 | 0.54 | 0.62 | 0.35 | 0.26 |
| 2010 | 0.52 | 0.49 | 0.34 | 0.26 |
| 2011 | 0.46 | 0.61 | 0.38 | 0.28 |
| 2012 | 0.49 | 0.47 | 0.33 | 0.24 |
| 2013 | 0.38 | 0.56 | 0.29 | 0.19 |
| 2014 | 0.44 | 0.53 | 0.29 | 0.18 |
| 2015 | 0.50 | 0.60 | 0.38 | 0.17 |
| 2016 | 0.62 | 0.48 | 0.32 | 0.22 |
| 2017 | 0.73 | 0.56 | 0.30 | 0.19 |
| 2018 | 0.68 | 0.49 | 0.33 | 0.22 |
| 2019 | 0.70 | 0.57 | 0.27 | 0.24 |
| 2020 | 0.73 | 0.62 | 0.35 | 0.20 |
| 2021 | 0.78 | 0.63 | 0.34 | 0.20 |
| Source: Statistics Canada, Canadian Centre for Justice and Community Safety Statistics, Homicide Survey. | ||||
Chart 6 end
These 297 shooting homicides represented 40% of all homicidesNote in Canada in 2021, making shooting the leading cause of death among victims of homicide, followed by stabbing (32%), beating (17%), and all other methods (10%). These proportions have been fairly consistent since 2016, as shooting has been the most common cause of death each year for the past six years. Prior to that, between 1985 and 2015, shooting and stabbing alternated as the most common cause of death in homicides in Canada.
As has been the case each year since 1995, handguns (57%) were the most common type of firearm used in shooting homicides in Canada in 2021, followed by rifles or shotguns (26%). The 169 victims of homicide via handgun represented the highest number of victims ever recorded by the Homicide Survey, and the rate of 0.44 per 100,000 population was at its highest point since peaking in 1991 (0.48) and 1992 (0.45) (Chart 7).
Chart 7 start
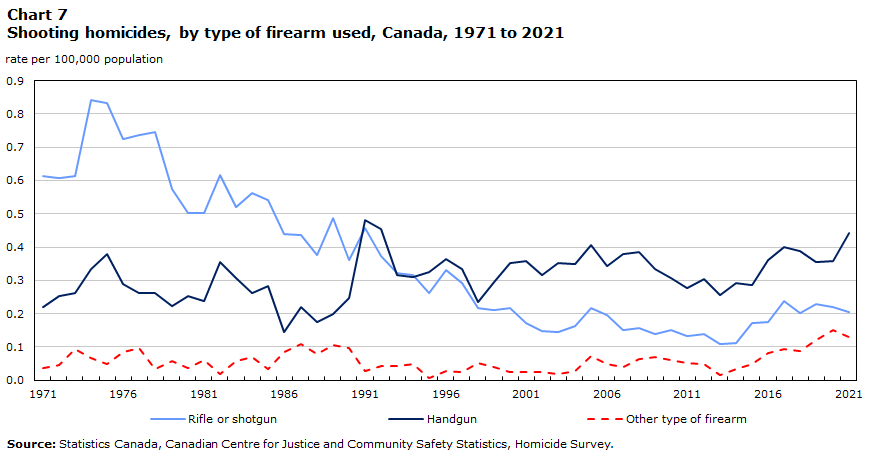
Data table for Chart 7
| Year | Rifle or shotgun | Handgun | Other type of firearm |
|---|---|---|---|
| rate per 100,000 population | |||
| 1971 | 0.61 | 0.22 | 0.04 |
| 1972 | 0.61 | 0.25 | 0.05 |
| 1973 | 0.61 | 0.26 | 0.09 |
| 1974 | 0.84 | 0.33 | 0.07 |
| 1975 | 0.83 | 0.38 | 0.05 |
| 1976 | 0.72 | 0.29 | 0.09 |
| 1977 | 0.74 | 0.26 | 0.10 |
| 1978 | 0.75 | 0.26 | 0.03 |
| 1979 | 0.57 | 0.22 | 0.06 |
| 1980 | 0.50 | 0.25 | 0.04 |
| 1981 | 0.50 | 0.24 | 0.06 |
| 1982 | 0.62 | 0.35 | 0.02 |
| 1983 | 0.52 | 0.31 | 0.06 |
| 1984 | 0.56 | 0.26 | 0.07 |
| 1985 | 0.54 | 0.28 | 0.03 |
| 1986 | 0.44 | 0.15 | 0.08 |
| 1987 | 0.43 | 0.22 | 0.11 |
| 1988 | 0.38 | 0.18 | 0.08 |
| 1989 | 0.49 | 0.20 | 0.11 |
| 1990 | 0.36 | 0.25 | 0.10 |
| 1991 | 0.46 | 0.48 | 0.03 |
| 1992 | 0.37 | 0.45 | 0.04 |
| 1993 | 0.32 | 0.32 | 0.04 |
| 1994 | 0.32 | 0.31 | 0.05 |
| 1995 | 0.26 | 0.32 | 0.01 |
| 1996 | 0.33 | 0.36 | 0.03 |
| 1997 | 0.29 | 0.33 | 0.02 |
| 1998 | 0.22 | 0.24 | 0.05 |
| 1999 | 0.21 | 0.30 | 0.04 |
| 2000 | 0.22 | 0.35 | 0.03 |
| 2001 | 0.17 | 0.36 | 0.03 |
| 2002 | 0.15 | 0.32 | 0.03 |
| 2003 | 0.15 | 0.35 | 0.02 |
| 2004 | 0.16 | 0.35 | 0.03 |
| 2005 | 0.22 | 0.41 | 0.07 |
| 2006 | 0.20 | 0.34 | 0.05 |
| 2007 | 0.15 | 0.38 | 0.04 |
| 2008 | 0.16 | 0.39 | 0.06 |
| 2009 | 0.14 | 0.33 | 0.07 |
| 2010 | 0.15 | 0.31 | 0.06 |
| 2011 | 0.13 | 0.28 | 0.05 |
| 2012 | 0.14 | 0.31 | 0.05 |
| 2013 | 0.11 | 0.26 | 0.02 |
| 2014 | 0.11 | 0.29 | 0.03 |
| 2015 | 0.17 | 0.29 | 0.05 |
| 2016 | 0.17 | 0.36 | 0.08 |
| 2017 | 0.24 | 0.40 | 0.09 |
| 2018 | 0.20 | 0.39 | 0.09 |
| 2019 | 0.23 | 0.35 | 0.12 |
| 2020 | 0.22 | 0.36 | 0.15 |
| 2021 | 0.20 | 0.44 | 0.13 |
| Source: Statistics Canada, Canadian Centre for Justice and Community Safety Statistics, Homicide Survey. | |||
Chart 7 end
In total, 84% of shooting homicides in 2021 were in urban areas, which is similar to the proportion of the population living in urban areas (85%). The remaining shooting homicides took place in the rural South (11%) or rural North (5%). As with firearm-related violent crime in general, the rate of firearm homicide was highest in the rural North (1.52 victims per 100,000 population). This rate was well above that recorded in urban areas (0.76) and the rural South (0.69).
Nearly all (160 victims, or 95%) victims of handgun homicides in 2021 were in urban areas. Homicides committed with a rifle or shotgun were dispersed differently throughout the country, with 56% in urban areas, 28% in the rural South, and 15% in the rural North.Note
Close to half (46%) of all shooting homicides in 2021 were confirmed or suspected to be related to gang activity according to police, compared to 7% of homicides committed via any other method.Note This differed depending on the type of firearm involved: 53% of homicides involving handguns were gang-related (89 of 169), as were 29% of homicides involving rifles or shotguns (23 of 78) and 50% of homicides involving another type of firearm or an unknown type of firearm (25 of 50).
In other words, the large majority (82%) of gang-related homicides were shootings, two-thirds (65%) of which were committed with a handgun.
For more information on homicide in Canada in 2021, see David & Jaffray, 2022.
Start of text box 5
Text box 5
Firearm-related deaths in Canada, 2020
Violent crime—that is, homicide and other violations causing death—is not the leading cause of firearm-related death in Canada. According to the most recent data available from the Vital Statistics Death Database,Note there were 714 deaths caused by a discharge of a firearm in 2020 in Canada, down from 836 in 2019.
Similar to previous years, the majority (71%) of these deaths were the result of intentional self-harm. Homicide or assault was the next most common cause of firearm-related death (24%), with the remainder classified as accidental (3%) or the result of legal intervention (2%).
For more information, see Table 13-10-0156-01 Deaths, by cause, Chapter XX: External causes of morbidity and mortality (V01 to Y89)
End of text box 5
Summary
In 2021, there were 8,047 victims of firearm-related violent crime, which represented 2.6% of all victims of police-reported violent crime. This was a rate of 27.4 victims per 100,000 population, 5% lower than the rate in 2020.
Most of this decline was due to there being fewer victims of firearm-related crime in urban areas, specifically the Toronto census metropolitan area. The decline was also driven by fewer incidents of robbery, and fewer victims of handgun-related violent crime. That said, violent crime involving rifles or shotguns, other types of firearms, and firearm-like weapons also decreased in 2021.
As with violent crime in general, rates of firearm-related violent crime were highest in the rural North. Not only did the prevalence of firearm-related violent crime differ by geography, so too did several characteristics. For instance, while handguns were present in the majority of firearm-related violent crimes, this was particularly the case in urban areas; rifles or shotguns were the most common firearm present in rural areas.
Though they represented a small proportion of all violent crimes reported to police, incidents involving firearms were more likely to involve multiple victims and result in major injury or death than incidents involving other types of weapons or physical force alone.
Shooting homicides increased in 2021, and they represented the most common cause of death among homicide victims in Canada for the sixth consecutive year. The majority of shooting homicides involved handguns. As with violent crime more generally, handguns were more commonly involved in urban shootings, while rifles or shotguns were more often used in shooting homicides in rural areas.
Detailed data tables
Data sources and concepts
Uniform Crime Reporting Survey
The Uniform Crime Reporting (UCR) Survey was established in 1962 with the co-operation and assistance of the Canadian Association of Chiefs of Police. The survey is a compilation of police-reported crimes that have been reported to federal, provincial/territorial and municipal police services in Canada.
One incident can involve multiple offences. Counts of victims presented in this article are based upon the most serious violation against the victim. The most serious violation is determined by police according to standardized classification rules in the UCR which consider, for instance, whether or not the offence is violent as well as the maximum penalty imposed by the Criminal Code.
Incident-based Uniform Crime Reporting Survey, Trend Database
The Incident-based Uniform Crime Reporting (UCR2) Survey Trend Database is a microdata survey that captures detailed information on crimes reported to and substantiated by police, including the characteristics of victims, accused persons and incidents. Coverage from the UCR2 between 2009 and 2021 is estimated at 99% of the population of Canada and includes only those police services who have consistently responded to the survey in order to allow for comparisons over time.
Quebec is excluded from the analysis of UCR data in this study due to a large proportion of incidents where the most serious weapon present was reported as unknown. As a result, the analysis of data from the UCR in this article represents 77.4% of the total Canadian population in 2021.
Excludes data for the Saint John Police Service (SJPS). The Canadian Centre for Justice and Community Safety Statistics, in communication with the SJPS, made the decision to remove SJPS data from the 2016, 2017, 2018 and 2019 research files due to concerns with data quality in these years. As a result, SJPS data has also been removed from the microdata trend file which includes only those police services who have consistently reported data each year from 2009 to 2021.
Homicide Survey
The Homicide Survey collects police-reported data on the characteristics of all homicide incidents, victims and accused persons in Canada. The Homicide Survey began collecting information on all homicides in 1961.
Whenever a homicide becomes known to police, the investigating police service completes the survey questionnaires, which are then sent to Statistics Canada. There are cases where homicides become known to police months or years after they occurred. These incidents are counted in the year in which they become known to police. Information on persons accused of homicide are only available for solved incidents (i.e., where at least one accused has been identified). Accused characteristics are updated as homicide cases are solved and new information is submitted to the Homicide Survey.
Information collected through the victim and incident questionnaires are also updated accordingly as a result of a case being solved.
The Homicide Survey recently underwent a redesign to improve data quality and enhance relevance. Changes were made to existing questions and additional questions have been added for the 2019 reporting period.
Urban and rural regions
Rural police services are those where the majority of the population served lives outside of a census metropolitan area (CMA) or census agglomeration (CA). Urban police services are those where the majority of the population lives within a CMA or CA. A CMA or a CA is formed by one or more adjacent municipalities centered on a population centre (known as the core). A CMA requires a total population of at least 100,000 of which 50,000 or more must live in the core. A CA must have a core population of at least 10,000. To be included in the CMA or CA, other adjacent municipalities must have a high degree of integration with the core, as measured by commuting flows derived from previous census place of work data, where 50% or more of the population commutes into the core. It should be noted that information was not available for all police services to determine whether they were rural or urban.
Rural North and rural South: Rural North includes all rural police services in the Territories or in the Provincial North. Provincial North encompasses the northern regions of Newfoundland and Labrador, Quebec, Ontario, Manitoba, Saskatchewan, Alberta and British Columbia (North and South - Variant of SGC 2016). Rural South refers to rural police services in the southern regions of these provinces as well as Prince Edward Island, Nova Scotia and New Brunswick. As Quebec is excluded from the analysis of UCR data in this report due to a large proportion of incidents where the most serious weapon present was reported as unknown, analysis of firearm-related violent crime in the North and South excludes the northern and southern regions of Quebec.
Types of firearm
For the purposes of the UCR and the Homicide Survey, a firearm is any barrelled weapon from which any shot, bullet, or other missile can be discharged and is capable of causing serious bodily injury or death to a person. Different types of firearms are distinguished as such by the two surveys (presented in descending order of seriousness according to the hierarchy for determining most serious weapon):
- Fully automatic firearm: Any firearm that allows continuous and rapid firing of bullets with one pull of the trigger.
- Sawed-off rifle or shotgun: Any rifle or shotgun with a barrel length which has been altered to less than 457 millimetres, or with an overall weapon length of less than 660 millimetres.
- Handgun: Any firearm designed to be held and fired by the action of one hand.
- Rifle or shotgun: Any long-barrelled firearm with a barrel length greater than or equal to 457 millimetres, or with an overall length of 660 millimetres or more.
- Firearm-like weapon: Any weapon capable of propelling any object through a barrel by means of gunpowder, compressed carbon dioxide, pumped air, or any other means. Includes, for example, flare guns or pellet guns. For UCR data, this category also includes all unknown types of firearms.
References
Allen, M. (2022). Trends in firearm-related violent crime in Canada, 2009 to 2020. Juristat. Statistics Canada Catalogue no. 85-002-X.
Allen, M. & Perreault, S. (2015). Police-reported crime in Canada’s Provincial North and Territories, 2013. Juristat. Statistics Canada Catalogue no. 85-002-X.
David, J.D. & Jaffray, B. (2022). Homicide in Canada, 2021. Juristat. Statistics Canada Catalogue no. 85-002-X.
Moreau, G. (2022). Police-reported crime statistics in Canada, 2021. Juristat. Statistics Canada Catalogue no. 85-002-X.
Perreault, S. (2019). Police-reported crime in rural and urban areas in the Canadian provinces, 2017. Juristat. Statistics Canada Catalogue no. 85-002-X.
Public Safety Canada. (2022). Firearms. https://www.publicsafety.gc.ca/cnt/cntrng-crm/frrms/index-en.aspx.
Royal Canadian Mounted Police. (2022). 2020 Commissioner of Firearms Report. https://www.rcmp-grc.gc.ca/en/2020-commissioner-firearms-report
Statistics Canada. (2020). Collection of data on Indigenous and ethno-cultural groups in Canada’s official police-reported crime statistics: A joint statement by Statistics Canada and the Canadian Association of Chiefs of Police. https://www.statcan.gc.ca/en/about/smr09/smr09_106.
- Date modified: