Juristat Bulletin—Quick Fact
Illicit drug overdose deaths, 2011 to 2016, British Columbia and Surrey
Archived Content
Information identified as archived is provided for reference, research or recordkeeping purposes. It is not subject to the Government of Canada Web Standards and has not been altered or updated since it was archived. Please "contact us" to request a format other than those available.
Overview
In 2016, British Columbia’s provincial health officer declared a public health emergency in response to a rise in illicit drug overdoses and related deaths. Between 2011 and 2016 there were 2,362 confirmed illicit drug overdose deaths in British Columbia and 332 in Surrey alone.
Statistics Canada, in partnership with the BC Coroners Service, City of Surrey, Surrey Fire Service, Surrey RCMP Detachment, Fraser Health Authority, BC Stats, BC Centre for Disease Control, BC Ministry of Health and Public Safety Canada, is undertaking a project to assess the socio-economic determinants of the drug overdose crisis by leveraging and integrating various administrative databases. The first focus of analysis involves the integration of illicit drug overdose deaths with employment and social assistance data, health and hospitalization records, and criminal justice system contacts.

Data table for Chart 1
| Year of death | British Columbia | Surrey |
|---|---|---|
| number | ||
| 2011 | 293 | 42 |
| 2012 | 268 | 44 |
| 2013 | 326 | 35 |
| 2014 | 360 | 44 |
| 2015 | 476 | 72 |
| 2016 | 639 | 95 |
|
Note: Numbers are based on those illicit drug overdose deaths that were integrated with Statistics Canada administrative data holdings. Source: BC Coroners Service Data, 2011 to 2016. |
||

Data table for Chart 2
| British Columbia | Surrey | |
|---|---|---|
| Under 18 | 1% | 0% |
| 18 to 24 | 12% | 12% |
| 25 to 34 | 25% | 27% |
| 35 to 44 | 25% | 24% |
| 45 to 54 | 23% | 24% |
| 55 to 64 | 13% | 11% |
| 65 and older | 1% | 1% |
| Source: BC Coroners Service Data, 2011 to 2016. | ||

Data table for Chart 2a
| British Columbia | Surrey | |
|---|---|---|
| Female | 23% | 19% |
| Male | 77% | 81% |
| Source: BC Coroners Service Data, 2011 to 2016. | ||
Hospitalizations And Emergency Department Visits
Approximately one-quarter of decedents were hospitalized in the 12 months prior to death. The majority of those who were hospitalized were hospitalized only once during that year.

Data table for Chart 3
| British Columbia | |
|---|---|
| Not hospitalized | 74% |
| Hospitalized | 26% |
| Hospitalized once | 15% |
| Hospitalized twice | 6% |
| Hospitalized 3 or more times | 6% |
| Source: BC Coroners Service Data, 2011 to 2016; Discharge Abstract Database, 2009/2010 to 2016/2017. | |

Data table for Chart 4
| Surrey | |
|---|---|
| Not hospitalized | 77% |
| Hospitalized | 23% |
| Hospitalized once | 13% |
| Hospitalized twice | 6% |
| Hospitalized 3 or more times | 4% |
| Source: BC Coroners Service Data, 2011 to 2016; Discharge Abstract Database, 2009/2010 to 2016/2017. | |

Data table for Chart 5
| British Columbia | Surrey | |
|---|---|---|
| Substance use related disorders | 23% | 21% |
| Mental health conditions, excl. substance use disorders | 19% | 14% |
| Injuries & poisonings, excl. opioid-poisonings | 16% | 16% |
| Opioid-poisonings | 17% | 22% |
| Source: BC Coroners Service Data, 2011 to 2016; Discharge Abstract Database, 2009/2010 to 2016/2017. | ||
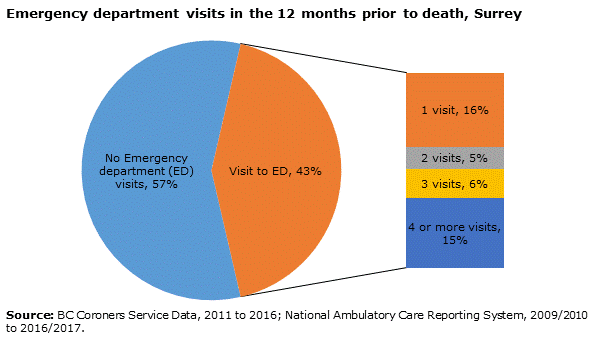
Approximately 40% of decedents visited the emergency department in the 12 months prior to death. Multiple visits to an emergency department were not uncommon.

Data table for Chart 6
| British Columbia | |
|---|---|
| No Emergency department (ED) visits | 59% |
| Visit to Emergency department | 41% |
| 1 ED visit | 14% |
| 2 ED visits | 8% |
| 3 ED visits | 5% |
| 4 or more ED visits | 15% |
| Source: BC Coroners Service Data, 2011 to 2016; National Ambulatory Care Reporting System, 2009/2010 to 2016/2017. | |
Data table for Chart 7
| Surrey | |
|---|---|
| No Emergency department (ED) visits | 57% |
| Visit to Emergency department | 43% |
| 1 ED visit | 16% |
| 2 ED visits | 5% |
| 3 ED visits | 6% |
| 4 or more ED visits | 15% |
| Source: BC Coroners Service Data, 2011 to 2016; National Ambulatory Care Reporting System, 2009/2010 to 2016/2017. | |
Employment And Social Assistance
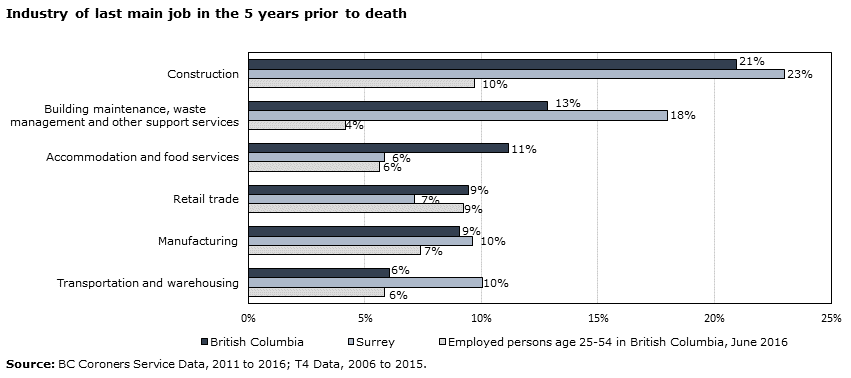
Approximately 3 in 10 decedents had no earnings in the 5 years prior to their fatal overdose. A similar proportion were employed in each of the 5 years preceding their overdose death, many of them in the construction industry.

Data table for Chart 8
| Number of years with earnings over $500 | British Columbia | Surrey |
|---|---|---|
| 0 | 34% | 28% |
| 1 | 11% | 14% |
| 2 | 9% | 11% |
| 3 | 9% | 7% |
| 4 | 11% | 13% |
| 5 | 26% | 28% |
| Source: BC Coroners Service Data, 2011 to 2016; T4 Data, 2006 to 2015. | ||
Data table for Chart 9
| British Columbia | Surrey | Employed persons age 25-54 in British Columbia, June 2016 | |
|---|---|---|---|
| Construction | 21% | 23% | 10% |
| Building maintenance, waste management and other support services | 13% | 18% | 4% |
| Accommodation and food services | 11% | 6% | 6% |
| Retail trade | 9% | 7% | 9% |
| Manufacturing | 9% | 10% | 7% |
| Transportation and warehousing | 6% | 10% | 6% |
| Source: BC Coroners Service Data, 2011 to 2016; T4 Data, 2006 to 2015. | |||
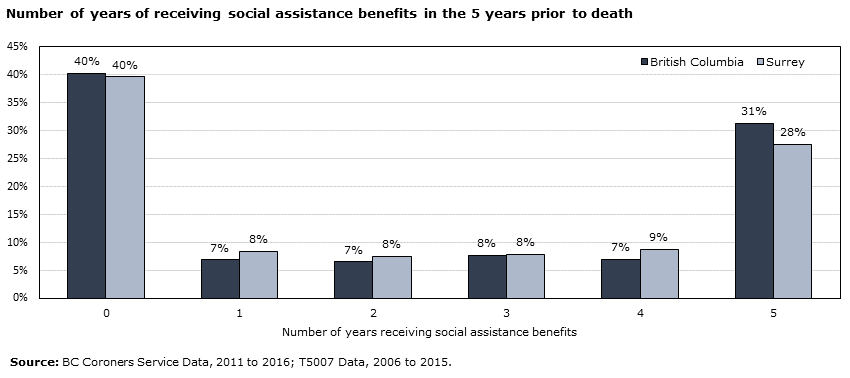
While 40% of decedents did not receive any social assistance in the 5 years prior to death, 31% of decedents in British Columbia and 28% in Surrey received social assistance benefits every year.
Data table for Chart 10
| Number of years receiving social assistance benefits | British Columbia | Surrey |
|---|---|---|
| 0 | 40% | 40% |
| 1 | 7% | 8% |
| 2 | 7% | 8% |
| 3 | 8% | 8% |
| 4 | 7% | 9% |
| 5 | 31% | 28% |
| Source: BC Coroners Service Data, 2011 to 2016; T5007 Data, 2006 to 2015. | ||
Contact With Police
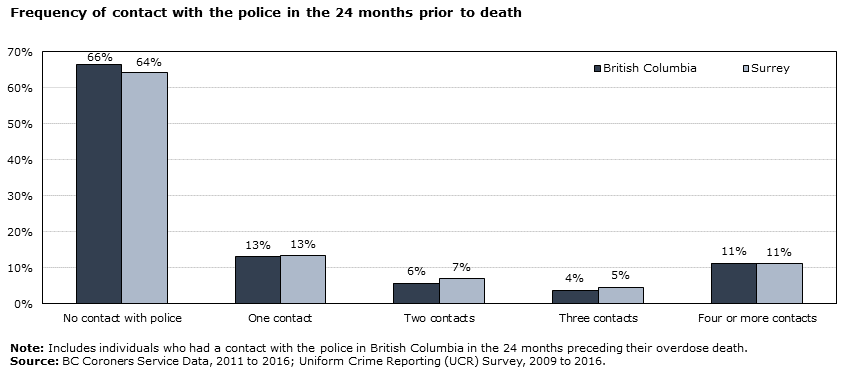
While the majority of decedents did not have a contact with police, 34% of decedents in British Columbia (and 36% of decedents in Surrey) were an accused in a criminal incident in the 24 months preceding their fatal overdose. Further, 11% of individuals who fatally overdosed in British Columbia and Surrey had four or more contacts with the police in the 24 months preceding their death.
Data table for Chart 11
| British Columbia | Surrey | |
|---|---|---|
| No contact with police | 66% | 64% |
| One contact | 13% | 13% |
| Two contacts | 6% | 7% |
| Three contacts | 4% | 5% |
| Four or more contacts | 11% | 11% |
|
Note: Includes individuals who had a contact with the police in British Columbia in the 24 months preceding their overdose death. Source: BC Coroners Service Data, 2011 to 2016; Uniform Crime Reporting (UCR) Survey, 2009 to 2016. |
||
Decedents were disproportionally involved in incidents of shoplifting and administration of justice offences, including fail to comply with order and breach of probation.
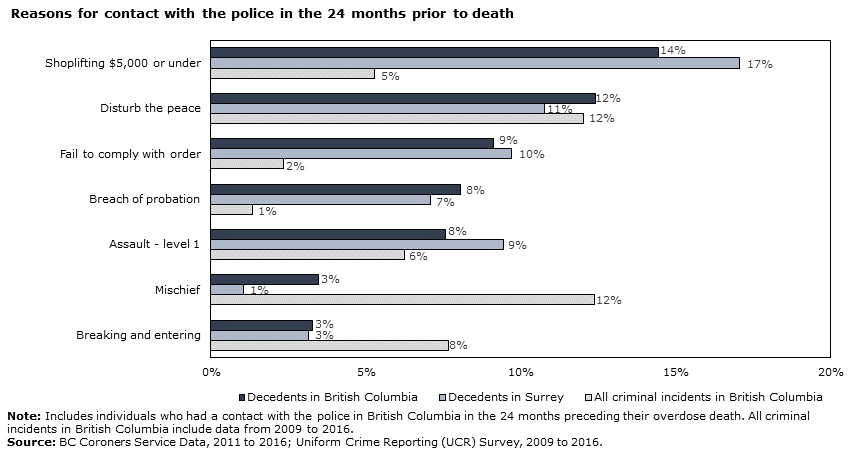
Data table for Chart 12
| Decedents in British Columbia | Decedents in Surrey | All criminal incidents in British Columbia | |
|---|---|---|---|
| Shoplifting $5,000 or under | 14% | 17% | 5% |
| Disturb the peace | 12% | 11% | 12% |
| Fail to comply with order | 9% | 10% | 2% |
| Breach of probation | 8% | 7% | 1% |
| Assault - level 1 | 8% | 9% | 6% |
| Mischief | 3% | 1% | 12% |
| Breaking and entering | 3% | 3% | 8% |
|
Note: Includes individuals who had a contact with the police in British Columbia in the 24 months preceding their overdose death. All criminal incidents in British Columbia include data from 2009 to 2016. Source: BC Coroners Service Data, 2011 to 2016; Uniform Crime Reporting (UCR) Survey, 2009 to 2016. |
|||
Of those decedents that had a contact with police, approximately one-third in British Columbia (33%) and one-quarter in Surrey (24%) had a formal contact with police in the 3 months prior to their fatal overdose.
| Time period prior to fatal overdose | British Columbia | Surrey |
|---|---|---|
| 1 month prior to fatal overdose | 16% | 10% |
| 3 months prior to fatal overdose | 33% | 24% |
| 6 months prior to fatal overdose | 52% | 47% |
| 12 months prior to fatal overdose | 74% | 75% |
| 18 months prior to fatal overdose | 89% | 89% |
| 24 months prior to fatal overdose | 100% | 100% |
|
Note: Includes individuals who had a contact with the police in British Columbia in the 24 months preceding their overdose death. Source: BC Coroners Service Data, 2011 to 2016; Uniform Crime Reporting (UCR) Survey, 2009 to 2016. |
||
- Date modified:
