
Police-reported crime in rural and urban areas in the Canadian provinces, 2021
by Samuel Perreault
Highlights
- In 2021, police services serving a mostly rural population served 15% of the population in the provinces, but reported 24% of violent crimes, 18% of property crimes, 30% of Criminal Code traffic offences and 23% of other Criminal Code violations.
- The Crime Severity Index (CSI), which measures the volume and the seriousness of crimes, was 33% higher in rural areas (91.9) than in urban areas (69.3). The gap was even greater for the Violent CSI. In 2021, the Violent CSI was 124.1 in rural areas and 85.2 in urban areas.
- The gap between rural and urban Violent CSIs has widened over the past decade. In 2011, the rural Violent CSI (84.8) and the urban Violent CSI (84.9) were virtually the same. The gap has especially widened during the COVID-19 pandemic as the Violent CSI increased in rural areas but not in urban areas.
- Shoplifting and robbery, crimes that are generally more frequent in urban areas than in rural areas, have declined significantly since the onset of the COVID-19 pandemic. Conversely, crimes in private residences—which are typically more common in rural areas—have increased since the onset of the COVID‑19 pandemic. In addition, intimate partner violence has increased more in rural areas than in urban areas.
- In 2021, the CSI was higher in rural areas than in urban areas in all provinces. The only exceptions were Prince Edward Island and British Columbia, where the rural CSI was slightly lower than that recorded in urban areas.
- The highest rural CSIs in 2021, as well as the largest differences from urban areas, were recorded in Saskatchewan (187.0 in rural areas versus 127.8 in urban areas), Alberta (144.5 versus 92.4) and Manitoba (152.8 versus 116.2).
- The higher crime rate in rural areas (7,033 incidents per 100,000 population) than in urban areas (4,919) was because a small number of police services recorded very high crime rates. Conversely, more than one-third (34%) of the rural population lived in a community where the crime rate was below 3,000 incidents per 100,000 population in 2021, compared with one-quarter (25%) of the urban population.
- Higher crime rates in rural areas were mainly observed in the northern parts of the provinces. In the south, the rural crime rate was lower than or similar to the urban rate in most provinces. Only rural areas in southern Alberta and, to a lesser extent, Saskatchewan and Nova Scotia had significantly higher crime rates than their urban counterparts.
- The higher crime rate in rural areas was mainly because of the high number of assaults, mischief and incidents related to disturbing the peace. These common offences were reported approximately two to three times more often by police services serving a predominantly rural population.
- From 2011 to 2021, rural police services reported a total of 1,400 homicides, which translates to an average annual rate of 2.22 homicides per 100,000 population. By comparison, urban police departments reported 5,471 homicides during this period, which represents a rate of 1.64 homicides per 100,000 population. However, during the same period, the rate of attempted murder was lower in rural areas (1.7 per 100,000 population) than in urban areas (2.1).
- Violent firearm-related offences sexual offences against children, uttering threats, criminal harassment, and indecent or harassing communications, were among the other violent crimes especially overrepresented in rural areas in 2021. In contrast, higher rates of attempted murder, robbery, extortion, and offences related to human trafficking or commodification of sexual activity have been recorded in urban areas.
For many, including those in the media and in academic research, the general perception of crime is that it is an urban issue. Conversely, rural areas are seen as an escape from the city, places that are quiet and free from social problems (Allen Bouffard & Muftic, 2006; Donnermeyer et al., 2013; Weisheit et al., 1994). Many Canadians share this perception that crime is lower in rural areas than in urban areas: compared with their counterparts in urban areas, residents of rural areas are, overall, more likely to be satisfied with their personal safety and to believe that crime in their neighbourhood is lower than elsewhere in Canada (Perreault, 2017).
Yet recent studies and police-reported statistics challenge the perception that crime is concentrated in large cities (Allen & Perreault, 2015; Donnermeyer et al., 2013; Perreault, 2019), and rural crime is becoming a focus for public safety policies. For example, Saskatchewan has improved methods of addressing rural crime, such as expanding the Saskatchewan Crime Watch Advisory Network to include central and northern Saskatchewan (Government of Saskatchewan, 2019). Additionally, Manitoba has funded the Royal Canadian Mounted Police Crime Reduction Enforcement Support Teams to expand this program across the province (Government of Manitoba, 2020).
This Juristat article analyzes these issues using police-reported data from the Uniform Crime Reporting (UCR) Survey, in addition to self-reported data from the General Social Survey (GSS) on Canadians’ Safety (Victimization). While crime is also an important issue in the territories, this article focuses on crime in rural areas in the provinces. Overall, crime rates in the territories are well above the national average (Moreau, 2022), and most territorial communities are rural. Therefore, including territories in the following analyses would disproportionally impact overall rural crime rates. As such, separate analyses would result in a more accurate depiction of crime for both areas.
Start of text box 1
Text box 1
Definitions
Census metropolitan area (CMA) and census agglomeration (CA): A CMA or a CA is formed by one or more adjacent municipalities centred on a population centre (known as the core). A CMA must have a total population of at least 100,000, of which 50,000 or more must live in the core. A CA must have a core population of at least 10,000. To be included in the CMA or CA, adjacent municipalities must have a high degree of integration with the core, as measured by commuting flows derived from census data. A CMA or CA can be served by more than one police service.
Rural and urban: Rural police services serve a territory where most of the population lives outside a CMA or CA. While small towns that do not qualify as CAs are included in this category, the term “rural area” will be used for brevity. Urban police services serve an area where most of the population lives within a CMA or CA. Police services are classified as rural or urban based on the majority of the population they serve, rather than on the place of residence of each Canadian. Consequently, urban residents can be served by a police service classified as rural, and vice versa. In the interest of conciseness, the terms “rural” (or “rural area”) and “urban” (or “urban area”) are used to designate areas or populations based on the classification of the police services that serve them. The definitions of rural and urban in this report may differ from those used in other Statistics Canada reports.
Provincial North: The Provincial North comprises the northern regions of British Columbia, Alberta, Saskatchewan, Manitoba, Ontario, Quebec, and Newfoundland and Labrador, according to the definition agreed on by the Northern Development Ministers Forum and used by the Conference Board of Canada’s Centre for the North. These northern boundaries generally reflect provincial administrative regions. For more information, see Statistics Canada (2022a) and Allen & Perreault (2015).
Criminal incident: Criminal incidents include all Criminal Code and other federal statute offences reported by police services. Incidents are categorized by the most serious violation in the incident.
Crime rate: The crime rate is the sum of all Criminal Code incidents reported by the police divided by the population. The crime rate excludes Criminal Code traffic violations and other federal statute violations, such as drug offences.
Crime Severity Index (CSI): The CSI takes into account the volume and the relative severity of crime. To calculate the police-reported CSI, each violation is assigned a weight. CSI weights are based on the violation’s incarceration rate and the average length of the prison sentence handed down by criminal courts. The more serious the average sentence, the higher the weight assigned to the offence, meaning that the more serious offences have a greater impact on the index. Unlike the traditional crime rate, all offences, including Criminal Code traffic violations and other federal statute violations, such as drug offences, are included in the CSI. To calculate the CSI, the weighted offences are summed then divided by the population. Like other indexes (e.g., Consumer Price Index), to allow for ease of comparison, the CSI is then standardized to a base year of “100” (for the CSI, the base year is 2006). All CSI values are relative to the Canada-level CSI for 2006. CSI values are available back to 1998.Note
End of text box 1
The crime rate and Crime Severity Index are higher in rural areas
The Canadian population is largely urban. In 2021, more than four in five (85%) provincial residents were served by a police service covering a predominantly urban areaNote (see Text box 1). Urban police services also reported the majority of criminal offences. In 2021, they reported over 1.7 million Criminal Code and other federal statute violations, such as drug-related offences and offences under the Immigration and Refugee Protection Act and the Customs Act. By comparison, rural police services reported just over 465,000 offences (Table 1).
However, when considering population size, people living in rural areas are more likely to be impacted by crime. In 2021, rural police services served about 15% of the population in Canada’s 10 provinces, but they reported 21% of all Criminal Code and other federal statute offences. Specifically, they reported 24% of violent crimes, 18% of property crimes, 30% of Criminal Code traffic offences, 23% of other Criminal Code offences, 18% of drug offences and 34% of other federal statute offences.
In Canada, two official measures of crime are typically used: the crime rate and the Crime Severity Index (CSI). The crime rate measures the volume of crime (all Criminal Code violations, except traffic and other federal statute violations) relative to the population size, whereas the CSI measures the volume and severity of crime and includes all Criminal Code and other federal statute violations.
In 2021, rural police services reported 412,931 Criminal Code violations (excluding traffic and other federal statute violations), representing a rate of 7,033 incidentsNote per 100,000 population. This rate was 43% higher than what was reported by urban police services (4,919 incidents per 100,000 population) (Table 1). The gap was even wider when all federal statute violations, including traffic offences, were considered. The resulting rural crime rate was 48% higher than the urban rate (7,927 incidents per 100,000 population compared with 5,363 incidents per 100,000 population).
However, the difference between rural and urban areas was slightly smaller when comparing CSIs—that is, when crime severity was also considered. In 2021, the urban CSI was 69.3. In rural areas, it was 91.9, or 33% higher than in urban areas. The fact that a smaller gap existed between urban and rural CSIs than between their traditional crime rates may suggest that less serious crimes contribute more to the crime rate in rural areas than in urban areas.
In 10 years, crime rates increased in rural areas and decreased in urban areas
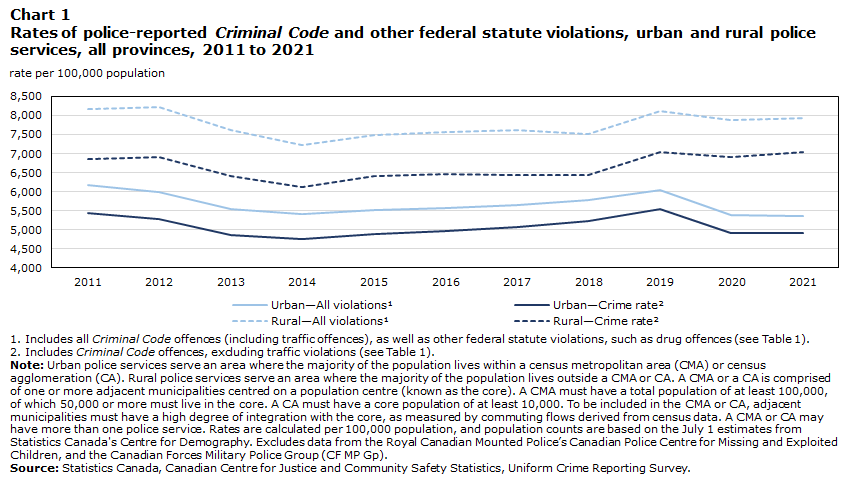
The gap between rural and urban crime rates has widened over the past decade. In 2011, rural police services reported 6,855 incidents per 100,000 population, 26% higher than in urban areas (5,440). In 2021, the rural crime rate was 43% higher than the urban rate (7,033 incidents per 100,000 population versus 4,919) (Table 2, Chart 1).
Chart 1 start
Data table for Chart 1
| Year | Urban—All violationsData table for Chart 1 Note 1 | Rural—All violationsData table for Chart 1 Note 1 | Urban—Crime rateData table for Chart 1 Note 2 | Rural—Crime rateData table for Chart 1 Note 2 |
|---|---|---|---|---|
| rate per 100,000 population | ||||
| 2011 | 6,185 | 8,176 | 5,440 | 6,855 |
| 2012 | 5,988 | 8,217 | 5,265 | 6,906 |
| 2013 | 5,539 | 7,620 | 4,854 | 6,408 |
| 2014 | 5,404 | 7,212 | 4,750 | 6,107 |
| 2015 | 5,521 | 7,487 | 4,895 | 6,408 |
| 2016 | 5,580 | 7,557 | 4,969 | 6,468 |
| 2017 | 5,652 | 7,606 | 5,065 | 6,448 |
| 2018 | 5,786 | 7,507 | 5,233 | 6,430 |
| 2019 | 6,049 | 8,109 | 5,531 | 7,029 |
| 2020 | 5,371 | 7,887 | 4,902 | 6,897 |
| 2021 | 5,363 | 7,927 | 4,919 | 7,033 |
|
Source: Statistics Canada, Canadian Centre for Justice and Community Safety Statistics, Uniform Crime Reporting Survey. |
||||
Chart 1 end
Overall, rural and urban crime rates followed a relatively similar pattern from 2011 to 2019. In rural and urban areas, the crime rate started on a downward trend at the beginning of the decade and reached a low in 2014. It then rose until 2019.
In 2020, the COVID-19 pandemic had a major impact on crime in Canada (Moreau, 2021). However, these impacts were quite different in rural and urban areas. While the crime rate dropped by 11% in urban areas, the decrease was only 2% in rural areas. In 2021, the gap widened further: while the urban crime rate remained relatively stable, the rural crime rate rebounded, rising back to its pre-pandemic level.
Because of lockdowns, business closures and telework becoming the norm for many Canadians, property crime offences declined sharply in Canada with the onset of COVID-19. For example, the decrease in the number of shoplifting incidents and thefts of $5,000 or under contributed significantly to the drop in the crime rate and the CSI in 2020 (Moreau, 2021). However, those crimes are much more common in urban areas than in rural areas.Note
Overall, violent crimes declined much more modestly from 2019 to 2020. Still, robberies showed a sharp decline during this period (-19% in urban areas and -9% in rural areas). However, robbery is also more common in urban areas than in rural areas.Note Hence, the COVID-19 pandemic seems to have mainly impacted crimes that contribute more to the urban crime rate than to the rural crime rate.
Other factors that can partly explain why the pandemic could have had different impacts in rural and urban areas include the fact that crimes committed in a private residence have risen since the start of the pandemic, while they have dropped in other locations, such as stores, restaurants and bars, and even on public transit. However, compared with urban areas, a larger proportion of rural crimes occur in a private residence.
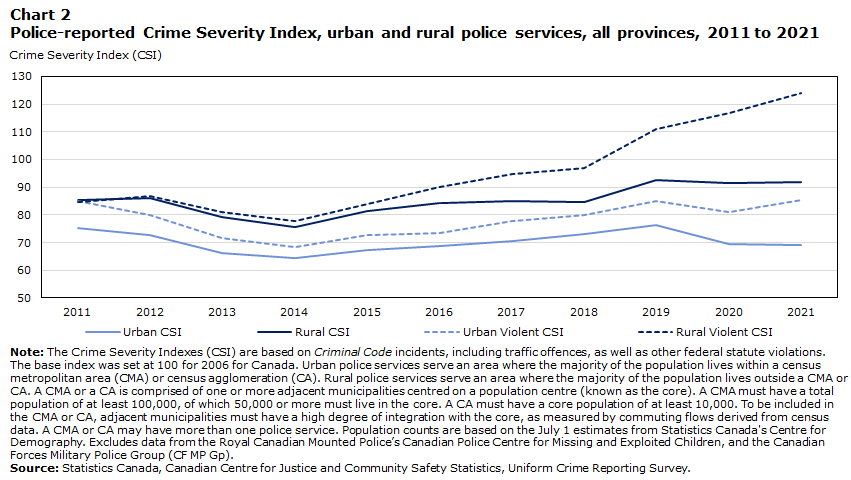
Compared with 2011, the Crime Severity Index increased in rural areas, but decreased in urban areas
The gap between the rural CSI and urban CSI has also widened over the past decade. As with the crime rate, the CSI in rural areas was higher in 2021 than in 2011, while the opposite was seen in urban areas. Specifically, the rural CSI rose from 85.5 in 2011 to 91.9 in 2021, a 7% increase. In urban areas, the CSI fell 8% during that period, from 75.2 to 69.3 (Chart 2).
Chart 2 start
Data table for Chart 2
| 2011 | 2012 | 2013 | 2014 | 2015 | 2016 | 2017 | 2018 | 2019 | 2020 | 2021 | |
|---|---|---|---|---|---|---|---|---|---|---|---|
| Crime Severity Index (CSI) | |||||||||||
| Urban CSI | 75.2 | 72.6 | 66.1 | 64.4 | 67.5 | 68.9 | 70.5 | 73.1 | 76.4 | 69.6 | 69.3 |
| Rural CSI | 85.5 | 86.0 | 79.2 | 75.7 | 81.5 | 84.2 | 85.1 | 84.8 | 92.6 | 91.4 | 91.9 |
| Urban Violent CSI | 84.9 | 80.1 | 71.8 | 68.4 | 72.8 | 73.4 | 77.6 | 79.9 | 85.1 | 81.1 | 85.2 |
| Rural Violent CSI | 84.8 | 86.7 | 80.9 | 77.8 | 83.8 | 89.9 | 94.8 | 96.8 | 111.0 | 116.9 | 124.1 |
|
Note: The Crime Severity Indexes (CSI) are based on Criminal Code incidents, including traffic offences, as well as other federal statute violations. The base index was set at 100 for 2006 for Canada. Urban police services serve an area where the majority of the population lives within a census metropolitan area (CMA) or census agglomeration (CA). Rural police services serve an area where the majority of the population lives outside a CMA or CA. A CMA or a CA is comprised of one or more adjacent municipalities centred on a population centre (known as the core). A CMA must have a total population of at least 100,000, of which 50,000 or more must live in the core. A CA must have a core population of at least 10,000. To be included in the CMA or CA, adjacent municipalities must have a high degree of integration with the core, as measured by commuting flows derived from census data. A CMA or CA may have more than one police service. Population counts are based on the July 1 estimates from Statistics Canada's Centre for Demography. Excludes data from the Royal Canadian Mounted Police’s Canadian Police Centre for Missing and Exploited Children, and the Canadian Forces Military Police Group (CF MP Gp). Source: Statistics Canada, Canadian Centre for Justice and Community Safety Statistics, Uniform Crime Reporting Survey. |
|||||||||||
Chart 2 end
Overall, the CSI followed a path similar to that of the crime rate, with a dip in 2014 followed by an increase until the onset of the COVID-19 pandemic, when the gap between the rural and the urban CSI widened further.
The biggest urban–rural differences are observed in violent crimes, traffic violations and other federal statutes
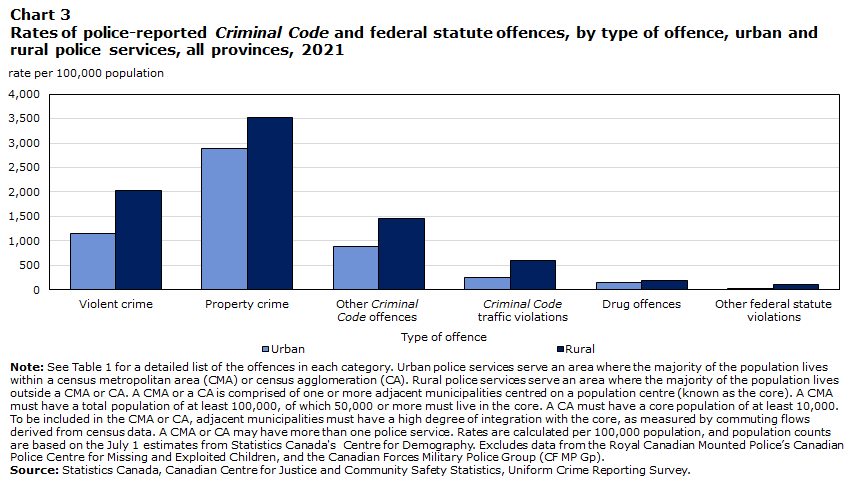
Urban and rural areas differ in many respects, including the nature of the crimes that occur there. Not only is crime in rural areas higher overall, but there are also differences in the types of crimes committed. For example, in 2021, the violent crime rate in rural areas was 76% higher than that in urban areas (Table 3, Chart 3), although the difference in the Violent CSI was smaller (85.2 in urban areas and 124.1 in rural areas, a difference of 46%).
Chart 3 start
Data table for Chart 3
| Type of offence | Urban | Rural |
|---|---|---|
| rate per 100,000 population | ||
| Violent crime | 1,159 | 2,040 |
| Property crime | 2,882 | 3,524 |
| Other Criminal Code offences | 879 | 1,468 |
| Criminal Code traffic violations | 252 | 597 |
| Drug offences | 155 | 191 |
| Other federal statute violations | 37 | 105 |
|
Note: See Table 1 for a detailed list of the offences in each category. Urban police services serve an area where the majority of the population lives within a census metropolitan area (CMA) or census agglomeration (CA). Rural police services serve an area where the majority of the population lives outside a CMA or CA. A CMA or a CA is comprised of one or more adjacent municipalities centred on a population centre (known as the core). A CMA must have a total population of at least 100,000, of which 50,000 or more must live in the core. A CA must have a core population of at least 10,000. To be included in the CMA or CA, adjacent municipalities must have a high degree of integration with the core, as measured by commuting flows derived from census data. A CMA or CA may have more than one police service. Rates are calculated per 100,000 population, and population counts are based on the July 1 estimates from Statistics Canada's Centre for Demography. Excludes data from the Royal Canadian Mounted Police’s Canadian Police Centre for Missing and Exploited Children, and the Canadian Forces Military Police Group (CF MP Gp). Source: Statistics Canada, Canadian Centre for Justice and Community Safety Statistics, Uniform Crime Reporting Survey. |
||
Chart 3 end
The rate for other Criminal Code offences—which include offences against the administration of justice, disturbing the peace and non-violent weapons offences—was 67% higher in rural areas (1,468 incidents per 100,000 population) than in urban areas (879) (Table 3, Chart 3).
However, the biggest differences were with respect to Criminal Code traffic offences and federal statute offences. The rate of traffic offences in rural areas (597 incidents per 100,000 population) was more than double the rate in urban areas (252), while the rate of federal statute offencesNote was nearly three times higher than the one in urban areas (105 incidents versus 37 incidents per 100,000 population).
In rural and urban areas, property offences represented the main category of crime, encompassing 54% of offences in urban areas and 44% in rural areas. This crime category also had the smallest difference between rates in urban and rural areas. The rate for all property offences in rural areas (3,524 incidents per 100,000 population) was 22% higher than the rate recorded by urban police services (2,882 incidents per 100,000 population).
This difference also grew with the COVID-19 pandemic, which led to a notable decrease in property crimes in urban areas. In 2019, before the pandemic, the property crime rate in rural areas was only 5% higher than the urban rate.
Among the crime categories, violent crime had the largest increase in 10 years
From 2011 to 2021, the rate for all Criminal Code and other federal statute offences decreased by 13% in urban areas and by 3% in rural areas. Decreases were also observed in most of the crime and offence categories during that period.
In rural and urban areas, sharp declines were recorded in the drug offence category—a trend that began even before the legislative changes regarding cannabis—and in other federal statute offences (Table 3).
Criminal Code traffic offences also declined considerably in urban areas (-31%), while they fell 13% in rural areas. During that time, the property crime rate decreased 17% in urban areas and 5% in rural areas.
However, two crime categories showed an upward trend from 2011 to 2021. The category “other Criminal Code offences,” which includes offences against the administration of justice, disturbing the peace and child pornography, rose 2% in rural areas and remained stable in urban areas. That said, the violent crime category saw the biggest increase, especially in rural areas. From 2011 to 2021, the violent crime rate in rural areas was up 19%. The increase in the Violent CSI in rural areas was even more pronounced during this period, up 46% (Chart 2). This indicates that not only did the volume of crime increase, so did the average severity of violent crime.
In urban areas, violent crime also increased from 2011 to 2021, with the rate up 4%. In contrast, the Violent CSI in 2021 was comparable with the 2011 index.
The Prairie provinces record the highest rural Crime Severity Indexes
In a previous study on rural crime (Perreault, 2019), it had been noted that the higher crime rates and CSIs in rural areas were essentially observed in the Prairie provinces (i.e., Manitoba, Saskatchewan and Alberta), while in all other provinces, the rural CSI was either lower or very similar to the urban CSI.
Chart 4 start

Data table for Chart 4
| N.L. | P.E.I. | N.S. | N.B. | Que. | Ont. | Man. | Sask. | Alta. | B.C. | All provinces | |
|---|---|---|---|---|---|---|---|---|---|---|---|
| Crime Severity Index (CSI) | |||||||||||
| Urban | 68.7 | 57.6 | 69.8 | 85.0 | 53.4 | 55.8 | 116.2 | 127.8 | 92.4 | 93.1 | 69.3 |
| Rural | 84.3 | 55.7 | 75.2 | 94.7 | 58.8 | 60.4 | 152.8 | 187.0 | 144.5 | 90.6 | 91.9 |
| percent change from 2011 to 2021 | |||||||||||
| Urban | -19 | -22 | -17 | 28 | -28 | -9 | 10 | -4 | 12 | -4 | -8 |
| Rural | 34 | -2 | 7 | 44 | -15 | -3 | 9 | 13 | 34 | -8 | 7 |
|
Note: The Crime Severity Indexes are based on Criminal Code incidents, including traffic offences, as well as other federal statute violations. The base index was set at 100 for 2006 for Canada. Urban police services serve an area where the majority of the population lives within a census metropolitan area (CMA) or census agglomeration (CA). Rural police services serve an area where the majority of the population lives outside a CMA or CA. A CMA or a CA is comprised of one or more adjacent municipalities centred on a population centre (known as the core). A CMA must have a total population of at least 100,000, of which 50,000 or more must live in the core. A CA must have a core population of at least 10,000. To be included in the CMA or CA, adjacent municipalities must have a high degree of integration with the core, as measured by commuting flows derived from census data. A CMA or CA may have more than one police service. Population counts are based on the July 1 estimates from Statistics Canada's Centre for Demography. Excludes data from the Royal Canadian Mounted Police’s Canadian Police Centre for Missing and Exploited Children, and the Canadian Forces Military Police Group (CF MP Gp). Source: Statistics Canada, Canadian Centre for Justice and Community Safety Statistics, Uniform Crime Reporting Survey. |
|||||||||||
Chart 4 end
In 2021, the situation was quite different, with the CSI being higher in rural areas than in urban areas in all provinces, except Prince Edward Island and British Columbia. Saskatchewan (187.0) had the highest rural CSI among the provinces in 2021, followed by Manitoba (152.8) and Alberta (144.5). In contrast, Prince Edward Island (55.7), Quebec (58.8) and Ontario (60.4) had the lowest rural CSIs (Table 4, Chart 4).
Start of text box 2
Text box 2
Self-reported victimization rates are lower in rural areas than in urban areas
In Canada, official crime statistics are mainly gathered through two separate but complementary surveys. On the one hand, there are police‑reported data collected through the Uniform Crime Reporting (UCR) Survey, an annual census of all Criminal Code offences and other federal statute violations that come to the attention of the police. On the other hand, every five years, Statistics Canada conducts the General Social Survey (GSS) on Canadians’ Safety (Victimization) to collect information on the victimization experiences of a sample of Canadians aged 15 years and older. The data from the self-reported victimization surveys include crimes reported to the police and those not reported. However, they are gathered for a limited set of offences.Note
Although conducted before the COVID-19 pandemic, the 2019 GSS provides the most recent victimization data, which show that, overall, provincial residents living in rural areas were less likely than their urban counterparts to have been victims of a crime in the 12 months preceding the survey. In 2019, nearly one in seven rural residents in the provinces (14%) reported having been a victim of at least one crime measured by the GSS in the 12 months preceding the survey. Among urban residents of the provinces, this proportion was one in five (20%). This difference was also statistically significant in half of the provinces, namely Newfoundland and Labrador, Prince Edward Island, Quebec, Ontario, and Manitoba. In the other provinces, the victimization rate in rural areas was relatively similar to the rate recorded in urban areas (Chart 5).
Chart 5 start

Data table for Chart 5
| Province | UrbanData table for Chart 5 Note † | Rural | ||||
|---|---|---|---|---|---|---|
| percent | 95% confidence interval | percent | 95% confidence interval | |||
| from | to | from | to | |||
| N.L. | 16 | 12 | 20 | 7Note * | 4 | 11 |
| P.E.I. | 19 | 14 | 26 | 7Note * | 3 | 12 |
| N.S. | 13 | 10 | 16 | 16 | 10 | 24 |
| N.B. | 13 | 10 | 17 | 14 | 9 | 21 |
| Que. | 16 | 14 | 19 | 9Note * | 6 | 13 |
| Ont. | 18 | 16 | 19 | 10Note * | 7 | 13 |
| Man. | 30 | 26 | 34 | 16Note * | 12 | 22 |
| Sask. | 25 | 22 | 29 | 21 | 16 | 29 |
| Alta. | 29 | 26 | 33 | 25 | 20 | 30 |
| B.C. | 25 | 22 | 28 | 23 | 15 | 33 |
| All provinces | 20 | 19 | 21 | 14Note * | 13 | 16 |
Source: Statistics Canada, General Social Survey on Canadians' Safety (Victimization). |
||||||
Chart 5 end
Overall, the characteristics associated with higher victimization rates were the same in rural areas as in urban areas. For example, in rural and urban areas, single people, young adults and people experiencing economic hardship were more likely to have been victims of a violent crime in the 12 months preceding the survey. However, while in urban areas women (5.3%) were more likely than men (3.4%) to have been victims of at least one violent crime in the 12 months preceding the survey, men and women in rural areas reported having been victims in the same proportion (4.0%) (Table 5).
It should be noted that certain crimes are not included in the self‑reported victimization data. These include criminal harassment or indecent communications; non-consensual distribution of intimate images; and crimes without a direct victim, such as disturbing the peace, offences against the administration of justice or non‑violent weapons offences. Likewise, crimes targeting a business, a public asset or a victim younger than 15 years are not measured by the GSS. As such, differences in the scope and methodology of the surveys may partly explain why the trends derived from the data on self‑reported victimization do not completely reflect the police‑reported data.
End of text box 2
Rural areas are more heterogeneous in terms of crime than urban areas
There are a multitude of rural realities in Canada. Some communities have a primarily agriculture-oriented economy, while others have an economy centred on natural resources or tourism. Some communities are experiencing an economic or population decline, while others are faced with the effects of a rapid economic or population boom. Some communities are particularly remote, while others are relatively close to large population centres and have access to a broader range of services. Lastly, some Indigenous communities—which are generally in rural rather than in urban areas—are also faced with socioeconomic issues arising from historical and ongoing repercussions of colonialism that implemented exploitation, land expropriation and forced assimilation.
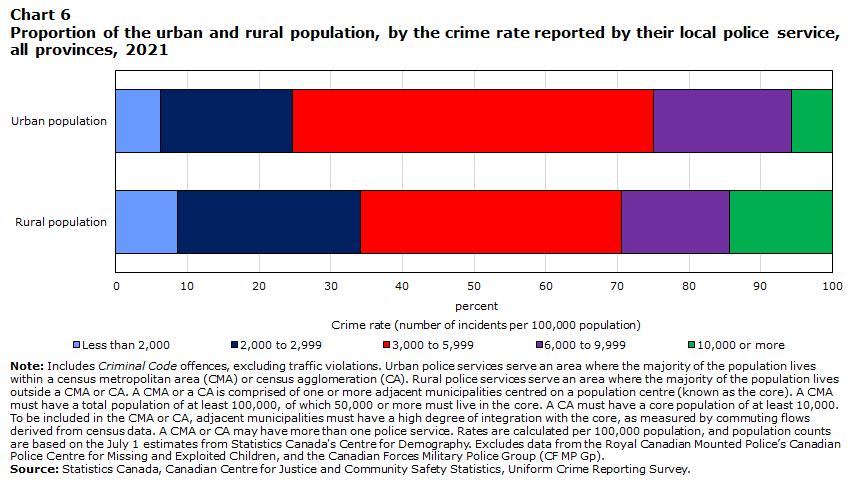
This rural heterogeneity is also seen in the crime rates. Compared with the urban population, a larger proportion of the rural population lives in a community where the crime rate is either among the lowest or the highest.
While the crime rates overall are higher in rural areas than in urban areas, not all rural residents live in an area where the crime rate is high. In fact, rural residents are more likely than urban residents to live in a communityNote with a relatively low crime rate. More precisely, 9% of the rural populationNote lives in an area where the 2021 crime rate was less than 2,000 incidents per 100,000 population, compared with 6% of the urban population. Similarly, 26% of the rural population lives in an area with a crime rate between 2,000 and 2,999 incidents per 100,000 population, compared with 18% of the urban population (Chart 6).
Chart 6 start
Data table for Chart 6
| Crime rate (number of incidents per 100,000 population) | |||||
|---|---|---|---|---|---|
| Less than 2,000 | 2,000 to 2,999 | 3,000 to 5,999 | 6,000 to 9,999 | 10,000 or more | |
| percent | |||||
| Rural population | 9 | 26 | 36 | 15 | 14 |
| Urban population | 6 | 18 | 50 | 19 | 6 |
|
Note: Includes Criminal Code offences, excluding traffic violations. Urban police services serve an area where the majority of the population lives within a census metropolitan area (CMA) or census agglomeration (CA). Rural police services serve an area where the majority of the population lives outside a CMA or CA. A CMA or a CA is comprised of one or more adjacent municipalities centred on a population centre (known as the core). A CMA must have a total population of at least 100,000, of which 50,000 or more must live in the core. A CA must have a core population of at least 10,000. To be included in the CMA or CA, adjacent municipalities must have a high degree of integration with the core, as measured by commuting flows derived from census data. A CMA or CA may have more than one police service. Rates are calculated per 100,000 population, and population counts are based on the July 1 estimates from Statistics Canada's Centre for Demography. Excludes data from the Royal Canadian Mounted Police’s Canadian Police Centre for Missing and Exploited Children, and the Canadian Forces Military Police Group (CF MP Gp). Source: Statistics Canada, Canadian Centre for Justice and Community Safety Statistics, Uniform Crime Reporting Survey. |
|||||
Chart 6 end
Nevertheless, it is also observed that a larger share of the rural population than the urban population lives in a community where the crime rate is very high. For example, 14% of the rural population lives in a community with a crime rate of 10,000 or more incidents per 100,000 population. Therefore, it is mainly because of these rural communities where the crime rate is very high that the crime rate for all rural areas is higher than the urban crime rate.
Crime rates are higher in the Provincial North
Previous studies have highlighted the generally higher crime rates in the northern regions of the provinces (Allen & Perreault, 2015; Perreault, 2019).
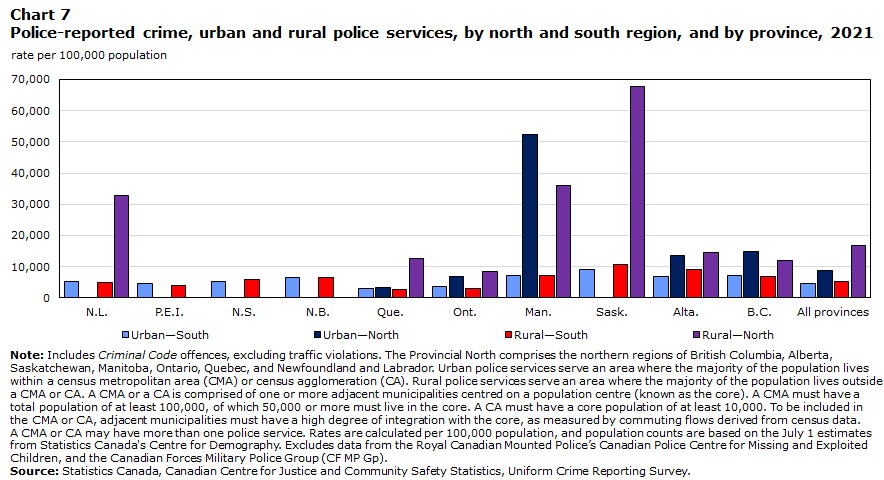
Overall, the crime rate in the Provincial North was about two and a half times the rate observed in the south. However, 16% of the rural population in Canada’s provinces live in the northern regions of the provinces, compared with 4% of the urban population (see definitions in Text box 1).
The difference between the rural and urban crime rates largely stems from the differences between the southern and more northern regions of the provinces. In the southern part of the provinces, the gap between the rural crime rate (5,205 incidents per 100,000 population) and the urban crime rate (4,762 incidents per 100,000 population) is relatively small (Chart 7).
Chart 7 start
Data table for Chart 7
| Province | Urban—South | Urban—North | Rural—South | Rural—North |
|---|---|---|---|---|
| rate per 100,000 population | ||||
| N.L. | 5,268 | Note ...: not applicable | 4,898 | 32,840 |
| P.E.I. | 4,756 | Note ...: not applicable | 3,996 | Note ...: not applicable |
| N.S. | 5,239 | Note ...: not applicable | 5,961 | Note ...: not applicable |
| N.B. | 6,453 | Note ...: not applicable | 6,492 | Note ...: not applicable |
| Que. | 3,136 | 3,333 | 2,798 | 12,737 |
| Ont. | 3,703 | 6,961 | 3,046 | 8,422 |
| Man. | 7,185 | 52,386 | 7,147 | 36,062 |
| Sask. | 9,272 | Note ...: not applicable | 10,587 | 67,866 |
| Alta. | 6,854 | 13,585 | 9,095 | 14,669 |
| B.C. | 7,067 | 14,748 | 6,747 | 11,856 |
| All provinces | 4,762 | 8,872 | 5,205 | 16,929 |
|
... not applicable Note: Includes Criminal Code offences, excluding traffic violations. The Provincial North comprises the northern regions of British Columbia, Alberta, Saskatchewan, Manitoba, Ontario, Quebec, and Newfoundland and Labrador. Urban police services serve an area where the majority of the population lives within a census metropolitan area (CMA) or census agglomeration (CA). Rural police services serve an area where the majority of the population lives outside a CMA or CA. A CMA or a CA is comprised of one or more adjacent municipalities centred on a population centre (known as the core). A CMA must have a total population of at least 100,000, of which 50,000 or more must live in the core. A CA must have a core population of at least 10,000. To be included in the CMA or CA, adjacent municipalities must have a high degree of integration with the core, as measured by commuting flows derived from census data. A CMA or CA may have more than one police service. Rates are calculated per 100,000 population, and population counts are based on the July 1 estimates from Statistics Canada's Centre for Demography. Excludes data from the Royal Canadian Mounted Police’s Canadian Police Centre for Missing and Exploited Children, and the Canadian Forces Military Police Group (CF MP Gp). Source: Statistics Canada, Canadian Centre for Justice and Community Safety Statistics, Uniform Crime Reporting Survey. |
||||
Chart 7 end
In the Provincial North, crime rates are generally much higher in rural and urban areas. For example, the urban crime rate in northern Canada was almost twice as high as in the south (8,872 incidents versus 4,762 incidents per 100,000 population, respectively). The difference was even more pronounced in rural areas, where the crime rate reached 16,929 incidents per 100,000 population in 2021, roughly three times the rate of southern rural areas and about double that of urban areas in the north.
Moreover, the gap between the north and the south has widened over the last decade. From 2011 to 2021, the crime rate increased by 18% in rural areas and by 1% in urban areas of the Provincial North. During the same period, the rate fell 4% in rural areas and 10% in urban areas in the south.
Rural crime rates are particularly high in northern Saskatchewan, Manitoba, and Newfoundland and Labrador
In 2021, rural crime rates in northern regionsNote were especially high in Saskatchewan (67,886 incidents per 100,000 population), Manitoba (36,062), and Newfoundland and Labrador (32,840). Although they were lower than in the provinces above, the rates in the northern rural areas of Alberta (14,699), Quebec (12,737) and British Columbia (11,856) were higher than 10,000 incidents per 100,000 population.
Among the provinces with rural and urban areas in their northern regions, the rural crime rate was higher than the urban rate in Quebec, Ontario and Alberta, while the opposite was observed in Manitoba and British Columbia.
From 2011 to 2021, the crime rate in southern urban areas decreased in several provinces, except New Brunswick (+17%), Alberta (+8%) and Manitoba (+5%). In southern rural areas, declines were observed in Prince Edward Island (-11%), Quebec (-27%), Ontario (-17%), Manitoba (-8%) and British Columbia (-11%). In contrast, rural areas in southern Newfoundland and Labrador (+12%), New Brunswick (+34%), Saskatchewan (+12%), and Alberta (+5%) saw the crime rate increase, while the rate remained stable in rural Nova Scotia.
In the Provincial North, the crime rate from 2011 to 2021 increased in all areas and regions, except in urban areas in northern Quebec (-24%) and Alberta (-9%) and rural areas in northern British Columbia (-8%). The largest rate increases during this period were seen in rural areas of northern Newfoundland and Labrador (+60%) and northern Manitoba (+31%).Note
Start of text box 3
Text box 3
Rural crime in the territories
Overall, crime in the territories is relatively high compared to what is recorded in the provinces (Moreau, 2022). The territories’ population represents about 0.3% of the Canadian population, but 2.7% of police-reported Criminal Code offences (excluding traffic offences) were recorded there in 2021.
There are two census agglomerations (CAs or urban areas as defined in this report) in the territories that meet the definition of urban area used in this article. These are Whitehorse and Yellowknife, the capitals of Yukon and the Northwest Territories, respectively. Although the population of Iqaluit (just over 8,000) does not meet the threshold required to be a CA (10,000 or more), the capital of Nunavut remains the largest population centre and the main service centre in the territory. As such, for this analysis, the three capitals will be compared with other communities in the territories.
Like what has been observed in urban and rural areas in the provinces, overall, crime is lower in the territorial capitals than in the other communities in the territories. The Crime Severity Index (CSI) for the three capitals was 239.6 in 2021, compared to a CSI of 428.9 for all other communities combined (Chart 8).
Chart 8 start

Data table for Chart 8
| Capital | Non-capital | ||||
|---|---|---|---|---|---|
| Crime Severity Index (CSI) | percent change from 2011 to 2021 | Crime Severity Index (CSI) | percent change from 2011 to 2021 | ||
| Yukon | CSI | 169.7 | 40 | 433.1 | 42 |
| Violent CSI | 179.6 | 56 | 718.8 | 60 | |
| Northwest Territories | CSI | 242.1 | 12 | 547.2 | 21 |
| Violent CSI | 277.6 | 67 | 676.7 | 41 | |
| Nunavut | CSI | 538.2 | 15 | 343.5 | 25 |
| Violent CSI | 546.8 | -16 | 609.0 | 35 | |
| All territories | CSI | 239.6 | 21 | 428.9 | 22 |
| Violent CSI | 258.2 | 28 | 646.8 | 40 | |
|
Note: The Crime Severity Indexes are based on Criminal Code incidents, including traffic offences, as well as other federal statute violations. The base index was set at 100 for 2006 for Canada. Capitals include the census agglomerations (CA) of Whitehorse and Yellowknife, and the Iqaluit census subdivision. A CA must have a core population of at least 10,000. To be included in the CA, adjacent municipalities must have a high degree of integration with the core, as measured by commuting flows derived from census data. A CA may have more than one police service. Population counts are based on the July 1 estimates from Statistics Canada's Centre for Demography. Excludes data from the Royal Canadian Mounted Police’s Canadian Police Centre for Missing and Exploited Children, and the Canadian Forces Military Police Group (CF MP Gp). Source: Statistics Canada, Canadian Centre for Justice and Community Safety Statistics, Uniform Crime Reporting Survey. |
|||||
Chart 8 end
As with higher crime in rural areas in the provinces, higher crime in communities outside the territorial capitals was primarily because of high rates of violent crime. The Violent CSI was more than double outside the capitals (646.8) than within them (258.2). The Violent CSI has also increased by 40% since 2011 in communities outside the capitals, compared with a 28% increase in the capitals. From 2011 to 2021, police reported 71 homicides (an average annual rate of 10.98 homicides per 100,000 population) and 58 attempted murders (8.97) outside the capitals, compared with 41 homicides (6.05) and 26 attempted murders (3.84) within them.
Mischief was the crime most frequently reported by police services in the territories in 2021, both inside and outside the capitals. Like in the provinces, where the rate of mischief was almost three times higher in rural than in urban areas, the rate of mischief was much higher outside the capitals (23,912 incidents per 100,000 population) than in them (13,469). On the other hand, several property crimes showed lower rates outside capital cities in 2021. This was the case for most theft offences (theft under $5,000, theft of $5,000 and over, shoplifting, possession of stolen goods) and fraud. Disturbing the peace offences were also slightly less often reported by police outside the capitals (7,814) than in them (8,755).
End of text box 3
Violent crime
Overall, the rate of police-reported violent crimes was higher in rural areas than in urban areas. However, hidden behind this picture were considerable differences: certain violent crimes were much more likely to occur in rural areas, while others were far more frequent in urban areas.
The homicide rate is higher in rural areas, but there are more attempted murders in urban areas
Homicide is a relatively rare crime in Canada. However, it is the most serious crime and one that carries the most severe sanctions, making it the crime with the highest weight in calculating the CSI. Compared with most other crimes, homicides are more likely to be brought to the attention of the police. Therefore, homicide data are unlikely to vary based on the rate of reporting these incidents to the police or policing practices, and, as a result, reliable comparisons between the various regions of Canada are possible, despite providing only a partial picture of overall violent crime.
From 2011 to 2021, rural police services reported 1,400 homicides, for an average annual rate of 2.22 homicides per 100,000 population. During the same period, approximately four times more homicides were committed in urban areas (5,471). When the population size is accounted for, this represents a rate of 1.64 homicides per 100,000 population, or 26% lower than the rate in rural areas.Note
The rural homicide rate was particularly high in the Provincial North, where the average rate from 2011 to 2021 was 5.75 homicides per 100,000 population, more than twice the average rate recorded in urban areas in the Provincial North (2.37). In the south, the opposite was observed: the average homicide rate from 2011 to 2021 was slightly lower in rural areas (1.54) than in urban areas (1.61).
In urban and rural areas, and in the south and the north, the homicide rate posted an overall upward trend from 2011 to 2021. However, the increase was slightly bigger in the Provincial North. Compared with the 2011 rates, the homicide rate in the Provincial North was 73% higher in urban areas and 49% higher in rural areas (Chart 9).
Chart 9 start

Data table for Chart 9
| Year | Urban—South | Urban—North | Rural—South | Rural—North |
|---|---|---|---|---|
| rate per 100,000 population | ||||
| 2011 | 1.66 | 1.92 | 1.81 | 3.88 |
| 2012 | 1.44 | 2.16 | 1.49 | 4.56 |
| 2013 | 1.37 | 1.15 | 1.09 | 5.69 |
| 2014 | 1.34 | 2.38 | 1.29 | 4.80 |
| 2015 | 1.54 | 2.46 | 1.55 | 6.31 |
| 2016 | 1.65 | 2.31 | 1.26 | 4.35 |
| 2017 | 1.65 | 2.30 | 1.52 | 6.86 |
| 2018 | 1.59 | 3.02 | 1.45 | 6.54 |
| 2019 | 1.64 | 2.36 | 1.65 | 7.52 |
| 2020 | 1.81 | 2.67 | 1.94 | 6.97 |
| 2021 | 1.91 | 3.32 | 1.92 | 5.79 |
|
Note: There may be a small number of homicides in a given year's total that occurred in previous years. Homicides are counted according to the year in which they are reported to Statistics Canada. The Provincial North comprises the northern regions of British Columbia, Alberta, Saskatchewan, Manitoba, Ontario, Quebec, and Newfoundland and Labrador. Urban police services serve an area where the majority of the population lives within a census metropolitan area (CMA) or census agglomeration (CA). Rural police services serve an area where the majority of the population lives outside a CMA or CA. A CMA or a CA is comprised of one or more adjacent municipalities centred on a population centre (known as the core). A CMA must have a total population of at least 100,000, of which 50,000 or more must live in the core. A CA must have a core population of at least 10,000. To be included in the CMA or CA, adjacent municipalities must have a high degree of integration with the core, as measured by commuting flows derived from census data. A CMA or CA may have more than one police service. Rates are calculated per 100,000 population, and population counts are based on the July 1 estimates from Statistics Canada's Centre for Demography. Source: Statistics Canada, Canadian Centre for Justice and Community Safety Statistics, Homicide Survey. |
||||
Chart 9 end
Among the provinces, homicide rates—urban and rural—tended to be higher in Western Canada than in the Atlantic provinces, Quebec and Ontario. In Atlantic Canada, the average homicide rate from 2011 to 2021 was lower than the urban rates in all provinces except New Brunswick. The highest average annual homicide rate recorded in rural areas was in Manitoba (4.99 homicides per 100,000 population), followed by Saskatchewan (4.62) (Chart 10).
Chart 10 start
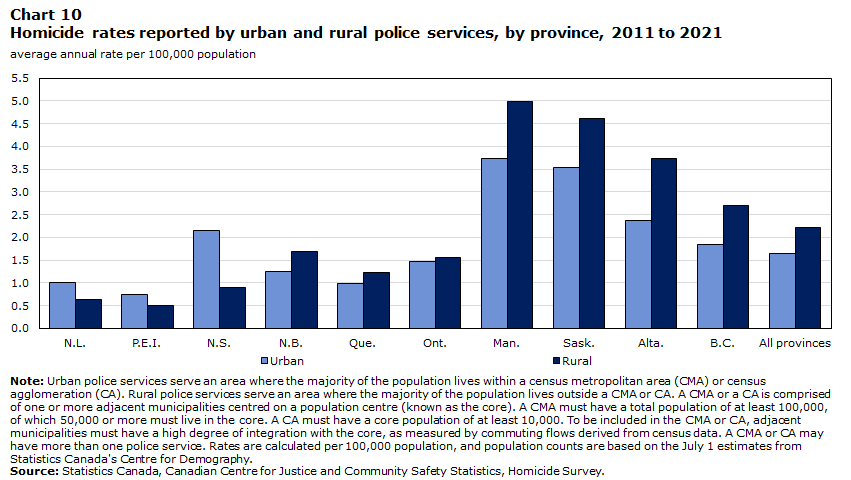
Data table for Chart 10
| Province | Urban | Rural |
|---|---|---|
| average annual rate per 100,000 population | ||
| N.L. | 1.01 | 0.64 |
| P.E.I. | 0.75 | 0.50 |
| N.S. | 2.16 | 0.90 |
| N.B. | 1.26 | 1.68 |
| Que. | 0.98 | 1.22 |
| Ont. | 1.47 | 1.55 |
| Man. | 3.73 | 4.99 |
| Sask. | 3.54 | 4.62 |
| Alta. | 2.37 | 3.74 |
| B.C. | 1.84 | 2.70 |
| All provinces | 1.64 | 2.22 |
|
Note: Urban police services serve an area where the majority of the population lives within a census metropolitan area (CMA) or census agglomeration (CA). Rural police services serve an area where the majority of the population lives outside a CMA or CA. A CMA or a CA is comprised of one or more adjacent municipalities centred on a population centre (known as the core). A CMA must have a total population of at least 100,000, of which 50,000 or more must live in the core. A CA must have a core population of at least 10,000. To be included in the CMA or CA, adjacent municipalities must have a high degree of integration with the core, as measured by commuting flows derived from census data. A CMA or CA may have more than one police service. Rates are calculated per 100,000 population, and population counts are based on the July 1 estimates from Statistics Canada's Centre for Demography. Source: Statistics Canada, Canadian Centre for Justice and Community Safety Statistics, Homicide Survey. |
||
Chart 10 end
Although a proportionally higher number of homicides were committed in rural areas than in urban areas, the number of attempted murders was lower. From 2011 to 2021, a rate of 1.7 attempted murders per 100,000 population was recorded in rural areas, compared with 2.1 in urban areas.
When both homicides and attempted murders are considered, the rates in urban and rural areas are similar (e.g., 3.95 homicides or attempted murders per 100,000 population in urban areas in 2021, compared with 4.12 in rural areas).
Physical assaults are roughly twice as common in rural areas than in urban areas
In both urban and rural areas, physical assaults—more specifically, common assaults (level 1)—were the violent crimes most often reported by police (Chart 11). However, the rates of physical assault in 2021 were roughly twice as high in rural areas than in urban areas. This applied to level 1, 2 and 3 assaults and assault against a peace officer (Table 1).
Chart 11 start

Data table for Chart 11
| Type of offence | Urban | Rural |
|---|---|---|
| rate per 100,000 population | ||
| Assault (level 1) | 409 | 786 |
| Uttering threats | 197 | 373 |
| Assault (level 2)–weapon or bodily harm | 165 | 276 |
| Sexual assault (level 1) | 79 | 122 |
| Criminal harassment | 63 | 109 |
| Indecent or harassing communications | 61 | 122 |
| Robbery | 54 | 17 |
|
Note: Urban police services serve an area where the majority of the population lives within a census metropolitan area (CMA) or census agglomeration (CA). Rural police services serve an area where the majority of the population lives outside a CMA or CA. A CMA or a CA is comprised of one or more adjacent municipalities centred on a population centre (known as the core). A CMA must have a total population of at least 100,000, of which 50,000 or more must live in the core. A CA must have a core population of at least 10,000. To be included in the CMA or CA, adjacent municipalities must have a high degree of integration with the core, as measured by commuting flows derived from census data. A CMA or CA may have more than one police service. Rates are calculated per 100,000 population, and population counts are based on the July 1 estimates from Statistics Canada's Centre for Demography. Excludes data from the Royal Canadian Mounted Police’s Canadian Police Centre for Missing and Exploited Children, and the Canadian Forces Military Police Group (CF MP Gp). Source: Statistics Canada, Canadian Centre for Justice and Community Safety Statistics, Uniform Crime Reporting Survey. |
||
Chart 11 end
Moreover, from 2011 to 2021, decreases in the rates were recorded for most categories of physical assault in urban areas. Conversely, increases were recorded in all categories of physical assault in rural areas. Since 2011, the rate of common assaults (level 1)—the most frequent type of physical assaults—has decreased 6% in urban areas (from 437 incidents per 100,000 population in 2011 to 409 in 2021) but increased 2% in rural areas (from 768 incidents per 100,000 population in 2011 to 786 in 2021). The pattern was similar, but even more pronounced, for aggravated assault (level 3). The rate for aggravated assault dropped by 4% in urban areas (from 8.7 incidents per 100,000 population in 2011 to 8.4 in 2021), while it increased 14% in rural areas (from 17 incidents per 100,000 population in 2011 to 19 in 2021) (Table 1).
Among the provinces, the highest physical assault rates were recorded in rural areas of Manitoba and Saskatchewan, while the lowest rates were observed in the Atlantic provinces (especially in Prince Edward Island) and in Ontario (Table 6).
Uttering threats was the violent crime second most frequently reported by police after physical assault, both in urban and rural areas. As with physical assault, rates of uttering threats were notably higher in rural areas than in urban areas. In 2021, police reported 373 incidents of uttering threats per 100,000 population in rural areas, compared with 197 in urban areas. Since 2011, the rate of incidents of uttering threats has increased in urban (+8%) and rural (+15%) areas.
Start of text box 4
Text box 4
Intimate partner violence in rural and urban areas
Victims of intimate partner violence (IPV) in rural areas face difficult challenges. Examples include lower access to victim services and shelters, fear of exclusion from a tight-knit community, and challenges around anonymity and confidentiality (Moffit et al., 2020). Additionally, of the few resources that exist in rural areas, very few specifically cater to the needs of victims of IPV (Zorn et al., 2017).
According to police-reported data in 2021, slightly more than one-quarter (29%) of people aged 12 and older who were victims of a violent crime had been assaulted by an intimate partner.Note This proportion was slightly higher in rural areas (32%) than in urban areas (28%). The difference in the rates is more pronounced. In 2021, the rate of police-reported violent crimes perpetrated by an intimate partner in rural areas was nearly twice the rate in urban areas (Chart 12).
Chart 12 start

Data table for Chart 12
| Year | Urban | Rural |
|---|---|---|
| rate per 100,000 population aged 12 and older | ||
| 2011 | 295 | 469 |
| 2012 | 280 | 474 |
| 2013 | 265 | 443 |
| 2014 | 258 | 426 |
| 2015 | 264 | 439 |
| 2016 | 263 | 456 |
| 2017 | 268 | 461 |
| 2018 | 275 | 464 |
| 2019 | 289 | 507 |
| 2020 | 289 | 543 |
| 2021 | 296 | 545 |
|
Note: Includes victims aged 15 years and older who were victimized by current and former legally married spouses and common-law partners. Also includes victims aged 12 years and older of all current and former boyfriends and girlfriends and other intimate relationships (i.e., persons with whom the victim had a sexual relationship but to which none of the other relationship categories apply). Victims include those aged 12 to 110 years. Victims aged older than 110 years are excluded from analyses because of possible instances of miscoding of unknown age within this age category. Excludes victims where the age was unknown or where the accused-victim relationship was unknown. Excludes a small number of victims in Quebec whose ages were unknown but were miscoded as 0. Based on the Incident-based Uniform Crime Reporting Survey, Trend Database, which, as of 2009, includes data for 99% of the population in Canada. Urban police services serve an area where the majority of the population lives within a census metropolitan area (CMA) or census agglomeration (CA). Rural police services serve an area where the majority of the population lives outside a CMA or CA. A CMA or a CA is comprised of one or more adjacent municipalities centred on a population centre (known as the core). A CMA must have a total population of at least 100,000, of which 50,000 or more must live in the core. A CA must have a core population of at least 10,000. To be included in the CMA or CA, adjacent municipalities must have a high degree of integration with the core, as measured by commuting flows derived from census data. A CMA or CA may have more than one police service. Rates are calculated per 100,000 population, and population counts are based on the July 1 estimates from Statistics Canada's Centre for Demography. Excludes data from the Royal Canadian Mounted Police’s Canadian Police Centre for Missing and Exploited Children, and the Canadian Forces Military Police Group (CF MP Gp). Source: Statistics Canada, Canadian Centre for Justice and Community Safety Statistics, Incident-based Uniform Crime Reporting Survey, Trend Database. |
||
Chart 12 end
Because of the COVID-19 pandemic, concerns have been raised by various sources about a potential resurgence of IPV. Some of the many factors that can contribute to an increase in IPV are greater isolation, increased stress or psychological distress, substance use, more limited access to assistance or support from social networks, and financial difficulties (Laforest & Poitras, 2021; Moffitt et al., 2020; Nelson et al., 2022; Sanchez et al., 2020; Statistics Canada, 2022b).
According to police-reported data, IPV rose a bit more in rural areas, where the rate increased 8% from 2019 to 2021, than in urban areas, where the rate rose by 2% during the same period. However, the upward trend in rural areas started before the pandemic, making it difficult to determine how much of the increase observed from 2019 to 2021 is attributable to it (Chart 12).
End of text box 4
Sexual assault rates increase in urban and rural areas
Over the past several years, there has been a great deal of discussion about sexual assault. For example, starting in 2017, campaigns such as #MeToo and #EtMaintenant have had high visibility on social and traditional media and have increased awareness among the population about the prevalence of sexual assault. Also, on January 1, 2018, Statistics Canada, in partnership with police services, changed the definition of “founded” criminal incidents to include incidents for which there is no credible evidence to confirm that the incident did not take place and those founded on third-party reports. Given this new definition, police may have started to classify more incidents as founded, which would then be included in the statistics presented in this article (Canadian Centre for Justice Statistics, 2018; Greenland & Cotter, 2018; Moreau, 2020).
These events likely contributed to the increase in the rate of sexual assaults reported by police in urban and rural areas in recent years (Chart 13). From 2011 to 2017, sexual assault rates were relatively stable, if not on a slow decline. Since then, in urban and rural areas, the rate of police-reported sexual assault has almost doubled, despite a temporary dip at the start of the COVID-19 pandemic.
Chart 13 start

Data table for Chart 13
| Year | Urban | Rural |
|---|---|---|
| rate per 100,000 population | ||
| 2011 | 58 | 86 |
| 2012 | 57 | 85 |
| 2013 | 55 | 82 |
| 2014 | 53 | 79 |
| 2015 | 54 | 80 |
| 2016 | 55 | 82 |
| 2017 | 64 | 84 |
| 2018 | 73 | 96 |
| 2019 | 76 | 107 |
| 2020 | 69 | 105 |
| 2021 | 81 | 125 |
|
Note: Urban police services serve an area where the majority of the population lives within a census metropolitan area (CMA) or census agglomeration (CA). Rural police services serve an area where the majority of the population lives outside a CMA or CA. A CMA or a CA is comprised of one or more adjacent municipalities centred on a population centre (known as the core). A CMA must have a total population of at least 100,000, of which 50,000 or more must live in the core. A CA must have a core population of at least 10,000. To be included in the CMA or CA, adjacent municipalities must have a high degree of integration with the core, as measured by commuting flows derived from census data. A CMA or CA may have more than one police service. Population counts are based on the July 1 estimates from Statistics Canada's Centre for Demography. Excludes data from the Royal Canadian Mounted Police’s Canadian Police Centre for Missing and Exploited Children, and the Canadian Forces Military Police Group (CF MP Gp). Source: Statistics Canada, Canadian Centre for Justice and Community Safety Statistics, Uniform Crime Reporting Survey. |
||
Chart 13 end
Among the provinces, in 2021, police-reported rates of sexual assault in rural areas were highest in Manitoba (170 incidents per 100,000 population) and Saskatchewan (156). Police services in New Brunswick (98) and Nova Scotia (99) recorded the lowest rural sexual assault rates (Table 6). In urban areas, the highest rates of sexual assault were also noted in Manitoba (106) and Saskatchewan (104), but the lowest rates were recorded in Ontario (71) and Prince Edward Island (78) (Table 7).
Criminal harassment and indecent or harassing communications are on the rise in both rural and urban areas
Criminal harassment and indecent or harassing communications are two offences that share some similarities. For example, most victims of these crimes, about three-quarters, are women. Like sexual assault—another crime where most of the victims are women—criminal harassment and indecent or harassing communications have increased to a larger extent than violent crime overall.
The rates of police-reported criminal harassment and indecent or harassing communications in rural areas were 41% and 30% higher, respectively, than the 2011 rates. In urban areas, the increase was smaller (5% for criminal harassment and 21% for indecent or harassing communications), but still higher than the average increase for all violent crimes (4%).
As with most other violent crimes, in 2021, the rate of police-reported criminal harassment in rural areas (109 incidents per 100,000 population) was notably higher than the urban rate (63). The same was true for indecent or harassing communications, with a rural rate of 122 incidents per 100,000 population, compared with 61 in urban areas.
Among the provinces, New Brunswick (192 incidents per 100,000 population) and Nova Scotia (146) had the highest rates of criminal harassment in rural areas. As for indecent or harassing communications, Prince Edward Island (277) and British Columbia (251) saw the highest rates in rural areas in 2021.
Robbery, an urban crime
Among the most common violent crimes, robbery has the highest severity—determined based on the sentences handed down by the courts. For example, the weight of robbery in the CSI calculation is almost 18 times higher than the weight assigned to common assaults. More serious violent crimes—including homicide, kidnapping, level 3 assault or assault against a peace officer, level 3 sexual assault, discharging a firearm, or certain sexual offences against children—are all less frequent than robbery.
Robberies are relatively rare in rural areas compared with the incidence in urban areas, despite a 47% decrease in these urban crimes from 2011 to 2021. The rate of urban robbery in 2021 (54 per 100,000 population) was about three times higher than the rural rate (17), which has remained relatively stable since 2011 (+2%) (Table 1). In rural areas, many offences, including some more serious ones, such as level 3 assault or assault against a peace officer, are more common than robberies, which account for less than 1% of violent crime.
Those who perpetrate robberies usually target strangers. This was the case for about four in five robberies in which an accused person was identified in 2021. Robberies are most often perpetrated in the street or another public area or in a commercial building. However, since there are usually fewer strangers in rural areas, crimes involving a stranger are far less common than in urban areas. In addition, crimes in rural areas are most often perpetrated in a private dwelling, rather than in a public or commercial setting. These characteristics may account in part for the lower incidence of robberies in rural areas.
In addition to robberies and attempted murder (discussed earlier), commodification of sexual activity and human trafficking offences are also more prevalent in urban areas than in rural areas. These offences were reported more than twice as often by urban police services than by rural police services. Extortion is also slightly more likely to occur in urban areas, where the rate recorded in 2021 was 10%Note higher than in rural areas. Although these crimes are not the most common violent crimes, they have seen relatively large increases over the past decade (Table 1).
Firearm-related offences are overrepresented in rural areas
In addition to physical assaults, uttering threats and sexual assaults, other less frequent violent crimes had much higher rates in rural areas than in urban areas. More specifically, the rate of violent firearms offences, such as discharge of a firearm or pointing a firearm, was almost three times higher in rural areas than in urban areas in 2021 (25 incidents per 100,000 population compared with 8.9) (Table 1). Since 2011, the rate for this type of offence has more than doubled in rural and urban areas.
Among violent crimes, the violent firearm-related offences category has some of the largest differences between the provinces. For example, rates in rural areas reached at least 55 incidents per 100,000 population in every province in the Prairies. At the other end, rural Prince Edward Island recorded none of these crimes, and the rate in rural Ontario was 5.9 incidents per 100,000 population.
Although the rate of violent firearm-related offences was higher in rural areas than in urban areas overall, the contrary was noted in some provinces where rates for these offences were higher in urban areas than in rural areas. Specifically, the rate of violent offences involving firearms was higher in urban areas than rural areas in all the Atlantic provinces except New Brunswick, as well as in Ontario (Table 6, Table 7).
It is important to note that this crime category represents only a small proportion of the crimes that involved a firearm, namely incidents where it was the most serious offence. For example, many incidents classified as robbery or assault may have involved a weapon. According to a previous study, firearm-related violent crimes represented 2.8% of all police-reported crime victims in 2020 (Allen, 2022). This study also noted that the rate of firearm-related crimes was higher in rural areas than in urban areas although these crimes represented a smaller proportion of all crimes in rural areas than in urban areas.
Higher rate of police-reported sexual offences against children in rural areas than urban areas
Sexual violations against children—for example, sexual exploitation, sexual touching, invitation to sexual touching or luring a child—comprise another group of crimes for which the rate recorded in rural areas in 2021 was much higher than in urban areas. In 2021, the combined rate for these offences in rural areas was more than twice the urban rate (62 incidents per 100,000 population versus 26). In rural (+220%) and urban (+184%) areas, the rate for these offences had roughly tripled since 2011 (Table 1).
Moreover, although some variation between provinces was seen in the rate of sexual violations against children in rural areas, the rate for all rural areas in each province remained higher than in all urban areas (26 incidents per 100,000 population). The lowest rate in rural areas in 2021 was observed in Ontario (40 incidents per 100,000 population), and the highest was recorded in Manitoba (96) (Table 6).
Property crime
Both in rural areas and urban areas, property crimes were the main type of offence reported by police. This crime category has also been at the centre of many discussions on rural crime and is an important element of authorities’ strategy against rural crime (Seiden, 2017). However, the difference between rural and urban property crime rates was smaller than in other crime categories, despite a larger decrease observed recently in urban areas after public health restrictions related to the COVID-19 pandemic were implemented.
Overall, in 2021, the rate of police-reported property crimes in rural areas (3,524 incidents per 100,000 population) was 22% higher than the rate in urban areas (2,882). However, like violent crimes, there were notable differences between urban and rural areas in terms of the nature of the property crimes that occurred there.
The most common crime in rural areas is mischief
Mischief is, by far, the crime most often reported by police in rural areas. In 2021, nearly 93,000 incidents of mischief were reported by rural police services, representing 45% of all rural police-reported property crime that year. By comparison, just under 36,000 thefts of $5,000 or under—the second most common property crime in rural areas—were reported by police in rural areas in 2021.
Mischief is also a relatively common crime in urban areas. In 2021, nearly 189,000 police-reported incidents of mischief made it the second most common offence. However, relatively speaking, mischief was nearly three times more common in rural areas than in urban areas, with rates of 1,581 incidents per 100,000 population in rural areas, compared with 586 incidents per 100,000 population in urban areas (Chart 14).
Chart 14 start
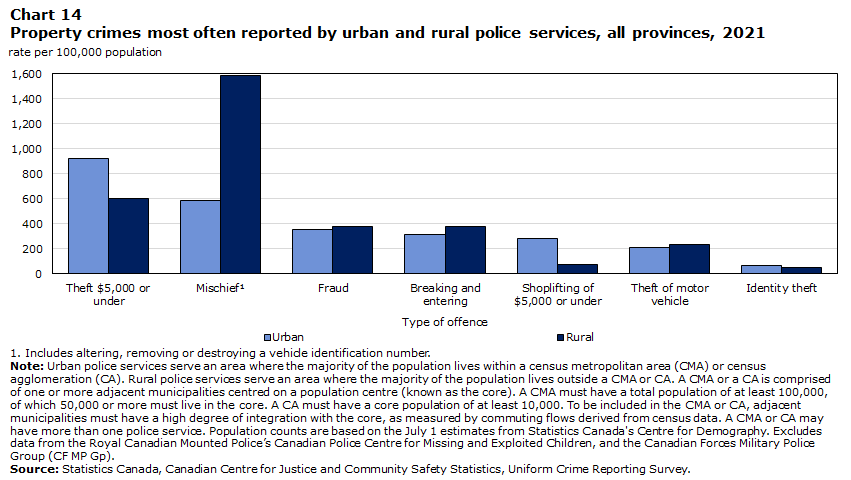
Data table for Chart 14
| Type of offence | Urban | Rural |
|---|---|---|
| rate per 100,000 population | ||
| Theft $5,000 or under | 924 | 605 |
| MischiefData table for Chart 14 Note 1 | 586 | 1581 |
| Fraud | 355 | 382 |
| Breaking and entering | 317 | 382 |
| Shoplifting of $5,000 or under | 279 | 77 |
| Theft of motor vehicle | 215 | 232 |
| Identity theft | 65 | 49 |
Source: Statistics Canada, Canadian Centre for Justice Statistics, Uniform Crime Reporting Survey. |
||
Chart 14 end
Although incidents of mischief can be serious offences, some can also reflect less serious acts that can sometimes be handled through municipal by-laws instead of under the Criminal Code, especially in urban areas where such by-laws are in effect and where teams of municipal by-law officers can enforce them. For this reason, it is conceivable that the scope of mischief may be slightly underestimated in urban areas.
Furthermore, there is considerable variation in the rates of mischief between different rural areas in the country. For example, the highest rate, recorded in Saskatchewan, was 13 times higher than the rate observed in Quebec (5,035 incidents of mischief per 100,000 population versus 375) (Table 6). In addition to Saskatchewan, rural areas in Manitoba (3,750), Newfoundland and Labrador (3,029), and Alberta (2,839) also posted relatively high rates of mischief. In Saskatchewan and Newfoundland and Labrador, mischief accounted for about one-third of the crimes that make up the crime rate. However, different law enforcement practices, such as the use of municipal by-laws, may account for part of these differences.
Break and enter and motor vehicle theft are highest in rural Alberta
Break and enters and thefts, especially motor vehicle thefts, have become a major cause of concern in rural areas (Seiden, 2017). As such, these offences have been at the centre of discussions about rural crime. Overall, the rates of break and enter were 21% higher in rural areas than in urban areas in 2021 (382 incidents per 100,000 population versus 317 incidents per 100,000 population). Similarly, the rates of motor vehicle theft were 8% higher in rural areas, with 232 incidents per 100,000 population, compared with 215 incidents per 100,000 population in urban areas. However, break and enters are one of the crimes that posted the largest decrease from 2011, with the rate dropping by 41% in rural areas (Table 1).
As with most property crimes, the rates of break and enter and motor vehicle theft were higher in the Prairie provinces, especially Alberta. In 2021, police reported 769 break and enter incidents per 100,000 population in rural Alberta. This was nearly five times higher than in rural Prince Edward Island, the province with the lowest break and enter rate in rural areas. Similarly, police reported 558 incidents of motor vehicle theft per 100,000 population in rural Alberta, a rate seven times higher than that recorded in rural Prince Edward Island (Table 6).
Theft of $5,000 or under more common in urban areas, while theft over $5,000 more common in rural areas
Unlike in rural areas, where the most common crime is mischief, the most common crime in urban areas is theft of $5,000 or under. In 2021, urban police services reported nearly 300,000 thefts of this nature, in addition to 90,000 shoplifting incidents. This represents a rate of 924 thefts of $5,000 or under per 100,000 population and a rate of 279 shoplifting incidents per 100,000 population. By comparison, the rates in rural areas were much lower, with 605 thefts of $5,000 or under per 100,000 population and 77 incidents of shoplifting of $5,000 or under per 100,000 population. In contrast, the rate of thefts over $5,000 (including shoplifting over $5,000) was slightly higher in rural areas (60 incidents versus 53 incidents per 100,000 population) (Table 1).
Although thefts were more common overall in urban areas, the rate of possession of stolen property was almost twice as high in rural than in urban areas (88 incidents per 100,000 population versus 47). This difference may be caused by the higher rates of theft over $5,000 and break and enters in rural areas.
Although break and enter rates are just slightly higher in rural areas than urban areas, and overall, the rates of theft are lower, these crimes are the cause of concern in some rural areas. On one hand, the different characteristics of the incidents may explain why these crimes are more of a concern in rural areas. For example, break and enter and thefts (all categories combined) are much more likely to have targeted a private residence than a business in rural areas than in urban areas. Therefore, victims may feel greater direct impacts in these circumstances. On the other hand, the overall picture does not apply to all provinces. For example, the rate of break and enter in rural Alberta is 53% higher than in urban Alberta. The rates of theft over $5,000, motor vehicle theft and possession of stolen property are also notably higher in rural areas of the province than urban areas (Table 6, Table 7).
Other Criminal Code offences
The “other Criminal Code offences” category includes all Criminal Code offences that are neither violent crimes nor property crimes. These crimes include many serious offences,Note such as terrorism offences,Note weapons trafficking and child pornography, and less serious offences, such as disturbing the peace and failure to appear in court. Although traffic violations (e.g., impaired driving) are not included in the calculation of the traditional crime rate or in the standard “other Criminal Code offences” category, they are still Criminal Code offences and will be analyzed in more detail in this section. Like those observed for violent crimes, the rates for these crimes are notably greater in rural areas. However, important differences and variations are observed, based on the crime and the province.
More offences against the administration of justice in rural areas
The category of offences against the administration of justice encompasses a group of criminal offences related to compliance with procedures and conditions imposed on an accused person by the justice system. Among other things, it includes offences such as failure to appear in court, escape, being unlawfully at large, failure to comply with a court order or breach of probation. Overall, in 2021, the rate of these offences was 36% higher in rural areas than in urban areas (706 incidents compared with 520 incidents per 100,000 population) (Chart 15).
Chart 15 start
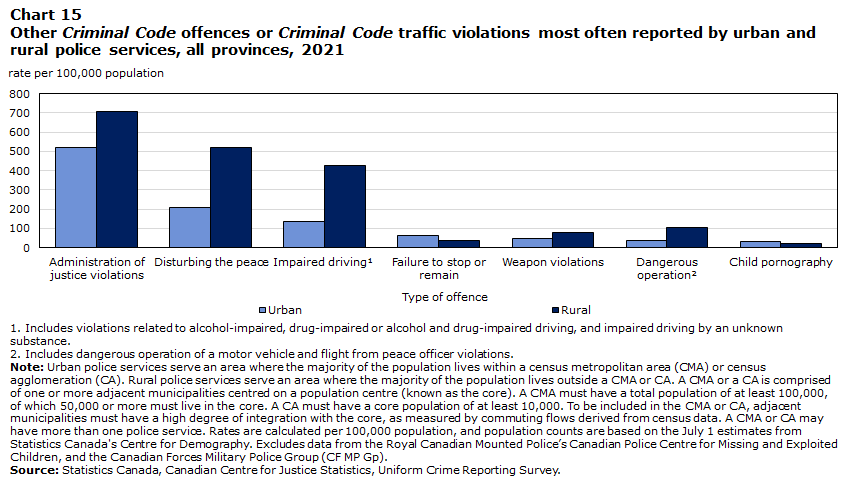
Data table for Chart 15
| Type of offence | Urban | Rural |
|---|---|---|
| rate per 100,000 population | ||
| Administration of justice violations | 520 | 706 |
| Disturbing the peace | 208 | 519 |
| Impaired drivingData table for Chart 15 Note 1 | 136 | 424 |
| Failure to stop or remain | 62 | 38 |
| Weapon violations | 47 | 76 |
| Dangerous operationData table for Chart 15 Note 2 | 38 | 106 |
| Child pornography | 32 | 19 |
Source: Statistics Canada, Canadian Centre for Justice Statistics, Uniform Crime Reporting Survey. |
||
Chart 15 end
Several studies have shown that people living in rural areas—especially those living in isolated regions far from large centres—experience additional challenges in terms of some of these offences, in particular, because of more difficult or limited access to various elements of the justice system (Aylin & Moore, 2015; Nuffield, 2003; Senate of Canada, 2016). More specifically, the distances and more limited access to various means of transportation can make it more difficult for an accused living in a remote region to appear in court, thereby increasing the likelihood of being accused of failure to appear. However, this reality is not clearly reflected in police-reported data. In 2021, while the rate of failure to appear was slightly higher in urban areas (96 incidents per 100,000 population) than in rural areas (73 incidents per 100,000 population), the location of the offence may often be based on the location of the court, and not where the accused lives. Since judicial institutions are often found in urban areas, this is also where these offences are often recorded.
Failure to comply with a court order and breach of probation account for the higher rate of offences against the administration of justice in rural areas than in urban areas. These offences represent more than three-quarters of offences against the administration of justice, and the rates for these two offences are higher in rural areas. The difference was especially large for failure to comply with a court order, for which the rate in 2021 was 494 incidents per 100,000 population in rural areas, compared with 321 incidents per 100,000 population in urban areas. As is the case for failure to appear, it can sometimes be more difficult to comply with certain conditions in rural areas, especially in small, isolated communities—for example, when prohibited from travelling outside a certain radius or perimeter (Senate of Canada, 2016) or issued a restraining, protection or no-contact order.
The rate of offences related to disturbing the peace is twice as high in rural areas than urban areas
Disturbing the peace is one of the most common offences in the “other Criminal Code offences” category. In 2021, police reported nearly 30,500 incidents of disturbing the peace in rural areas, representing a rate of 519 incidents per 100,000 population. This rate was more than double that in urban areas that year (208 incidents per 100,000 population). In rural and urban areas, this rate decreased from 2011, falling 15% in rural areas and 18% in urban areas (Table 1).
Disturbing the peace is an offence that is most often relatively minor.Note Thus, like mischief, it may sometimes be handled through municipal by-laws, particularly in urban areas—and therefore not included in the police-reported statistics presented here. Moreover, disturbing the peace is one of the crimes for which the largest variation between provinces was observed. Specifically, the 2021 rate recorded for rural Manitoba (1,881 incidents per 100,000 population) was 61 times higher than that observed in rural Quebec (31 incidents per 100,000 population).
Moreover, most of these incidents do not lead to charges. In 2021, just over 1% of these incidents had been cleared by charge, in both rural and urban areas.
Rate of non-violent weapons offences is higher in rural areas than urban areas
The non-violent weapons offences category brings together a group of offences, such as unsafe storage, weapons possession contrary to an order, unauthorized importing or exporting of weapons, and weapons trafficking. Like violent firearm-related offences, the rate of these violations was higher in rural areas (76 incidents per 100,000 population) than in urban areas (47 incidents per 100,000 population). Since 2011, these offences have seen a relatively large increase, in rural (+42%) and urban (+25%) areas (Table 1).
Among the provinces, the rural areas of Saskatchewan (208 incidents per 100,000 population) and Manitoba (196) had the highest rates of non-violent weapons offences. In contrast, the lowest rate among rural areas was observed in Prince Edward Island (24) (Table 6).
Impaired driving causing death is five times higher in rural areas than in urban areas
Urban and rural areas are very different environments with respect to travel. In rural areas, cars are often the only option for trips, the distances to cover can be longer, the speed limits can be higher and there may be less lighting (Canadian Centre on Substance Use and Addiction, 2017; Paré & Larochelle, 2004; Perreault, 2021; Robertson et al., 2016).
These differences are reflected in impaired driving rates, which are three times higher overall in rural areas. This difference was slightly smaller for drug-impaired driving, namely 30 incidents per 100,000 population in rural areas, compared with 18 incidents per 100,000 population in urban areas. In contrast, the rate of both alcohol- and drug-impaired driving was approximately five times higher in rural areas than in urban areas (43 incidents per 100,000 population versus 8.9).
The difference between impaired driving rates in rural versus urban areas is accentuated when factoring in the most serious offences, that is, those causing bodily harm or death. In 2021, the rate of impaired driving causing bodily harm was four times higher in rural areas than in urban areas; the rate of impaired driving causing death was five times higher.
Among the provinces, Saskatchewan had the highest impaired driving rate in rural areas (1,090 incidents per 100,000 population), followed by Manitoba (867) and British Columbia (552). In comparison, the lowest rate was recorded in Quebec (203), followed by Ontario (224).
Perceptions of police in rural areas
Rural residents in the provinces report a higher level of confidence in their local police than urban residents
Policing a wide territory with a low population density can present some challenges for rural police services, especially in terms of responding quickly to calls (Weisheit et al., 1994).
Despite these difficulties, and despite generally higher crime rates, self-reported data from the 2019 GSS on Victimization show that people residing in rural areas or small towns had slightly higher levels of confidence in their local police than people residing in urban areas. Overall, 45% of residents in the provinces’ rural areas said they had a great deal of confidence in their local police service. In comparison, this proportion was 40% in urban areas (Table 8).
However, New Brunswick was the exception. In the province’s rural areas, 39% of residents said they had a great deal of confidence in their local police, less than the 48% who said the same in urban areas. Conversely, rural Newfoundland and Labrador recorded the highest level of confidence: 58% of residents said they had a great deal of confidence in their local police, compared with 42% of urban residents.
When asked about specific tasks, rural residents rated their local police more favourably than their urban counterparts for all tasks mentioned in the survey. For example, rural residents were much more likely than their urban counterparts to report that their local police were doing a good job in terms of treating people fairly (53% versus 39%) or being approachable (59% versus 47%). Even in terms of responding quickly to calls, rural residents were more likely than urban residents to say that the police were doing a good job (43% versus 39%).
First Nations people, Métis and Inuit living in rural areas have less confidence in their local police
Previous studies have noted that confidence in the police was generally lower among First Nations people, Métis and Inuit than it was among non-Indigenous people (Cotter, 2022; Council of Canadian Academies, 2019; David, 2019; Jaccoud, 2020; Perreault, 2022). These low levels of trust may stem from the historical and ongoing legacy of colonization, including systemic racism and discriminatory policies and practices, generations of IndigenousNote people have been subjected to, which have contributed to an overall sense of mistrust in the police, criminal justice system and many other institutions (Jaccoud, 2020; National Inquiry into Missing and Murdered Indigenous Women and Girls, 2019; Pauktuutit Inuit Women of Canada and Comack, 2020).
Overall, 30% of Indigenous people (27% of First Nations people, 32% of Métis, data not available for InuitNote ) reported having a great deal of confidence in their local police service or detachment in 2019. In comparison, this proportion was 42% among non-Indigenous people.
Chart 16 start
Data table for Chart 16
| Area of residence | Indigenous people | Non-Indigenous people | ||||
|---|---|---|---|---|---|---|
| percent | 95% confidence interval | percent | 95% confidence interval | |||
| from | to | from | to | |||
| Rural north | 21Note E: Use with caution Note *** | 12 | 34 | 43 | 36 | 51 |
| Rural south | 27Note E: Use with caution Note ** | 19 | 36 | 46Note * | 43 | 49 |
| Urban north | Note F: too unreliable to be published | Note F: too unreliable to be published | Note F: too unreliable to be published | 40 | 34 | 47 |
| Urban southData table for Chart 16 Note † | 35Note E: Use with caution | 27 | 44 | 41 | 39 | 42 |
|
E use with caution F too unreliable to be published
Source: Statistics Canada, General Social Survey on Canadians' Safety (Victimization). |
||||||
Chart 16 end
While non-Indigenous people’s confidence in the police was higher in rural areas than in urban areas, the opposite was true among Indigenous people. In rural areas, 25%E of Indigenous people reported a great deal of confidence in the police, compared with 46% of non-Indigenous people. In urban areas, these proportions were 33%E,Note and 41%, respectively. The difference is more pronounced when disaggregating the Provincial North from the south. Just over one in five Indigenous people living in rural areas in the Provincial North (21%E) reported a great deal of confidence in the police, compared with 43% of non-Indigenous people in these same areas, and compared with 35%E of Indigenous people living in urban areas in the south (Chart 16).
Summary
Overall, police services serving a predominantly rural population in 2021 recorded a crime rate 43% higher than police services serving a predominantly urban population. This difference was somewhat larger for violent crimes and other Criminal Code offences, such as disturbing the peace or offences against the administration of justice. Although not included in the calculation of the crime rate, rates of Criminal Code traffic offences and other federal statute offences were also higher in rural areas than in urban areas.
Some violations were especially overrepresented in rural areas in 2021. This was the case for assaults, sexual offences against children, mischief and disturbing the peace. In contrast, robberies and thefts under $5,000 were much more common in urban areas. The average annual homicide rate for the 2011-to-2021 period was also higher in rural areas (2.22 homicides per 100,000 population) than in urban areas (1.64), although the rate of attempted murder was higher in urban areas.
Rural crime is not the same everywhere. More specifically, the highest crime rates and CSIs were mainly noted in the Prairie provinces and, to a lesser extent, in Newfoundland and Labrador. In the other provinces, the rural crime rate and CSI were closer to those recorded in urban areas, although still slightly higher in most cases. The highest crime rates were also recorded in the Provincial North. In the provinces’ southern areas, the rural crime rate was lower than or relatively similar to that of urban areas, except in Alberta, Saskatchewan and Nova Scotia.
The higher crime rate in rural areas was attributable to a small number of police services that recorded very high crime rates. In 2021, 14% of the rural population lived in a community with a crime rate of at least 10,000 incidents per 100,000 population, compared with 6% of the urban population. However, rural residents were also more likely to live in a community with a relatively low crime rate. For example, more than one-third (34%) of the rural population lived in a community where the crime rate was below 3,000 incidents per 100,000 population, compared with one-quarter (25%) of the urban population.
This analysis has provided the latest data about crime in rural areas, and it shows that rural Canada is very heterogeneous in terms of crime, as in several other ways, such as sociodemographic, economic and geographic realities. For example, some regions have an aging population, while in others, the population is very young. Some rural regions are experiencing a decline in economic vitality, while others are experiencing very rapid growth, sometimes related to resource extraction. Some rural regions are relatively close to urban centres and have better access to services and labour markets, whereas others are remote, isolated, and in some cases inaccessible by road. Some rural regions have an economy essentially centred on tourism, whereas others have more of an agricultural economy.
It is possible that one or more of these factors are in some way associated with rural crime. Analysis of the causes of rural crime was outside the scope of this article, but future work could address them to shed more light on crime in rural areas.
Detailed data tables
Table 1 Selected police-reported crimes, urban and rural police services, all provinces, 2021
Table 4 Crime Severity Index by province, urban and rural police services, 2021
Table 6 Selected police-reported crimes, rural police services, by province, 2021
Table 7 Selected police-reported crimes, urban police services, by province, 2021
Table 8 Perceptions of police performance, by area of residence, all provinces, 2019
Survey description
Uniform Crime Reporting Survey
The Uniform Crime Reporting (UCR) Survey was established in 1962 with the co-operation and assistance of the Canadian Association of Chiefs of Police. The UCR Survey measures criminal incidents that have been reported to federal, provincial or territorial, and municipal police services in Canada.
One incident can involve multiple offences. To ensure comparability, counts presented in this article are based on the most serious offence in the incident as determined by a standard classification rule used by all police services. Counts based on all violations are available upon request.
Data from the UCR are used to calculate both the traditional crime rate and the Crime Severity Index (CSI). The traditional crime rate and the CSI are based on the aggregate count of criminal incidents. A criminal incident involves one or more related offences that are committed during a single criminal event and have been reported to police. Where there are multiple victims within a single criminal event, a separate aggregate incident is counted for each victim. For example, a single incident involving an assault on three victims at the same time and location is counted in the aggregate statistics as three incidents of assault. For an incident to be counted in the crime statistics, it must be recorded as “founded” as opposed to “unfounded.” An incident is “founded” if, after police investigation, it has been determined that the reported offence did occur or was attempted or there is no credible evidence to confirm that the reported incident did not take place. This includes third-party reports that fit these criteria.
General Social Survey on Canadians’ Safety (Victimization)
The 2019 General Social Survey (GSS) on Canadians’ Safety target population was people aged 15 and older living in the provinces and territories, except for those living full time in an institution. Data collection took place between April 2019 and March 2020. Responses were obtained by computer-assisted telephone interviews (CATI), in-person interviews (in the territories only) and, for the first time, self-administered internet collection (for respondents in the provinces and the territorial capitals). Respondents could respond in the official language of their choice.
An individual aged 15 or older was randomly selected within each household to respond to the survey. An oversample of Indigenous people was added to the 2019 GSS on Victimization to allow for a more detailed analysis of individuals belonging to this population group. In 2019, the final sample size was 22,412 respondents. In 2019, the overall response rate was 37.6%. Non-respondents included people who refused to participate, could not be reached, or could not speak English or French. Respondents in the sample were weighted so that their responses represented the non-institutionalized Canadian population aged 15 and older.
As with any household survey, there are some data limitations. The results are based on a sample and are therefore subject to sampling errors. Somewhat different results might have been obtained if the entire population had been surveyed. For the quality of estimates, the lower and upper bounds of the confidence intervals are presented in the tables and charts. Confidence intervals should be interpreted as follows: if the survey were repeated many times, then 95% of the time (or 19 times out of 20), the confidence interval would cover the true population value. In addition to the confidence intervals, estimates are categorized into quality categories based on unweighted sample size. Estimates falling below a certain threshold are marked with the letter F, and estimates marked with the letter E have been deemed to be of marginal quality and should be used with caution.
References
Allen, M. (2022). Trends in firearm-related violent crime in Canada, 2009 to 2020. Juristat. Statistics Canada Catalogue no. 85-002-X.
Allen, M. & Perreault, S. (2015). Police-reported crime in Canada’s Provincial North and Territories, 2013. Juristat. Statistics Canada Catalogue no. 85-002-X.
Allen Bouffard, L. & Muftic, L.R. (2006). The rural mystique: Social disorganization and violence beyond urban communities. Western Criminology Review, 7(3), 55-66.
Aylin, N. & Moore, L. (2015). Rural and remote access to justice. A literature review. (Rural and remote access to justice Boldness project). Canadian Forum on Civil Justice.
Babyak, C., Alavi, A., Collins, K., Halladay, A. & Tapper, D. (2009). The Methodology of the Police-Reported Crime Severity Index. Statistics Canada Catalogue no. HSMD-2009-006E/F.
Babyak, C., Campbell, A., Evra, R. & Franklin, S. (2013). Updating the Police-reported Crime Severity Index Weights: Refinements to the Methodology. Statistics Canada Catalogue no. HSMD-2013-005E/F.
Canadian Centre for Justice Statistics. (2018). Revising the collection of founded and unfounded criminal incidents in the Uniform Crime Reporting Survey. Juristat. Statistics Canada Catalogue no. 85‑002‑X.
Canadian Centre on Substance Use and Addiction. (2017). Key messages about drug-impaired driving in rural and remote areas. (Drug-impaired Driving in Canada: Educator Toolkit).
Council of Canadian Academies. (2019). Toward Peace, Harmony, and Well-Being: Policing in Indigenous Communities. The Expert Panel on Policing in Indigenous Communities.
Cotter, A. (2022). Perceptions of and experiences with police and the justice system among the Black and Indigenous populations in Canada. Juristat. Statistics Canada Catalogue no. 85-002-X.
David, J.-D. (2019). Exploration des facteurs associés à la confiance des Autochtones envers la police au Canada : la pertinence du modèle expressif. Canadian Journal of Criminology and Criminal Justice, 61(4), 120-138.
Donnermeyer, J., Scott, J. & Barclay, E. (2013). How rural criminology informs critical thinking in criminology. International Journal for Crime, Justice and Social Democracy, 2(3), 69-91.
Government of Manitoba. (2020). Crime reduction support teams having an impact on rural crime. Press release. July 27th, 2020.
Government of Saskatchewan. (2019). Saskatchewan Crime watch advisory network expanded province-wide. Press release. April 18th, 2019.
Greenland, J. & Cotter, A. (2018). Unfounded criminal incidents in Canada, 2017. Juristat. Statistics Canada Catalogue no. 85-002-X.
Jaccoud, M. (2020). Entre méfiance et défiance : les Autochtones et la justice pénale au Canada. Les Cahiers de droit, 61(1).
Laforest, J. & Poitras, D. (2021). Violence conjugale en contexte de pandémie de COVID-19 : Synthèse rapide des connaissances. Institut national de santé publique du Québec.
Moffitt, P., Aujla, W., Giesbrecht, C.J., Grant, I. & Straatman, A.-L. (2020). Intimate partner violence and COVID-19 in rural, remote and northern Canada: Relationship, vulnerability and risk. Journal of Family Violence, 37.
Moreau, G. (2022). “Police-reported crime statistics, 2021." Juristat. Statistics Canada Catalogue no. 85-002-X.
Moreau, G. (2021). “Police-reported crime statistics, 2020." Juristat. Statistics Canada Catalogue no. 85-002-X.
Moreau, G. (2020). “Police-reported crime statistics, 2019." Juristat. Statistics Canada Catalogue no. 85-002-X.
National Inquiry into Missing and Murdered Indigenous Women and Girls. (2019). Reclaiming Power and Place: The Final Report of the National Inquiry into Missing and Murdered Indigenous Women and Girls.
Nelson, T., Kent-Wilkinson, A., & Li, H. (2022). Intimate partner violence in COVID-19: A literature review. Canadian Journal of Emergency Nursing, 45(1).
Nuffield, J. (2003). The challenges of youth justice in rural and isolated areas in Canada. Youth Justice Research. Department of Justice Canada.
Paré, L. & Larochelle, M. (2004). Alternatives de transport à la conduite avec facultés affaiblies en région rurale: bilan et perspectives. Agence de développement de réseaux locaux de services de santé et de services sociaux de Chaudière-Appalaches.
Pauktuutit Inuit Women of Canada & Comack, E. (2020). Addressing gendered violence against Inuit women: A review of police policies and practices in Inuit Nunangat. (Report in Brief and Recommendations).
Perreault, S. (2022). Victimization of First Nations people, Métis and Inuit in Canada. Juristat. Statistics Canada Catalogue no. 85-002-X.
Perreault, S. (2021). Impaired driving in Canada, 2019. Juristat. Statistics Canada Catalogue no. 85-002-X.
Perreault, S. (2019). Police-reported crime in rural and urban areas in the Canadian provinces, 2017. Juristat. Statistics Canada Catalogue no. 85-002-X.
Perreault, S. (2017). Canadian’s perceptions of personal safety and crime, 2014. Juristat. Statistics Canada Catalogue no. 85-002-X.
Robertson, R. D., Wicklund, C., Holmes, E. & Biderman, P. (2016). Impaired Driving in Rural Jurisdictions: Problems and Solutions. Traffic Injury Research Foundation.
Sanchez, O. R., Vale, D.B., Rodrigues, L. & Surita, F.G. (2020). Violence against women during the COVID-19 pandemic: An integrative review. International Journal of Gynecology and Obstetrics, 151(2).
Seiden, D. (2017). Know your neighbour. RCMP works with communities to tackle theft, vandalism. Gazette Magazine, 79 (4). Royal Canadian Mounted Police.
Senate of Canada. (2016). Delaying justice is denying justice. An urgent need to address lengthy court delays in Canada. Report of the Standing Senate Committee on Legal and Constitutional Affairs.
Statistics Canada. (2016). Measuring Crime in Canada: A Detailed Look at the Crime Severity Index. Statistics Canada Catalogue no. 11-629-X.
Statistics Canada. (2022a). Definitions, Data Sources and Methods — Statistical Classifications: North and South — Variant of Standard Geographical Classification (SGC) 2021. (https://www.statcan.gc.ca/en/subjects/standard/sgc/2021/index)
Statistics Canada. (2022b). Victims of police-reported family and intimate partner violence in Canada. The Daily, October 19th, 2022.
Wallace, M., Turner, J., Babyak, C. & Matarazzo, A. (2009). Measuring Crime in Canada: Introducing the Crime Severity Index and Improvements to the Uniform Crime Reporting Survey. Statistics Canada Catalogue no. 85-004-X.
Weisheit, R., Falcone, D. & Wells, E. (1994). Rural crime and rural policing. Research in Action. (September). National Institute of Justice.
Zorn, K.G., Wuerch, M.A., Faller, N. & Rucklos Hampton, M. (2017). Perspectives on regional differences and intimate partner violence in Canada: A qualitative examination. Journal of Family Violence, 32, 633-644.
- Date modified: