
Victimization of First Nations people, Métis and Inuit in Canada
by Samuel Perreault, Canadian Centre for Justice and Community Safety Statistics
Highlights
- Due to the historical and intergenerational trauma resulting from colonialism and related policies, as well as individual and systemic racism, many Indigenous people today—that is, those who are First Nations, Métis or Inuit—face a number of deeply rooted social and economic challenges, including higher rates of criminal victimization.
- According to self-reported data from the 2019 General Social Survey on Canadians’ Safety (Victimization), about 4 in 10 Indigenous people experienced sexual or physical violence by an adult before the age of 15. The proportion was about twice as high among Indigenous people aged 55 and older (54%) compared with those aged 15 to 34 (26%).
- Child welfare services or police were about three times more likely to have been made aware of violence experienced by Indigenous children, compared to violence experienced by non-Indigenous children (16% versus 5.2%).
- Indigenous people aged 15 and older were nearly 10 times more likely than non-Indigenous people to have been under the legal responsibility of the government during their childhood (11% versus 1.3%). This overrepresentation in child welfare services could only be partially explained by the higher rates of child maltreatment or neglect.
- More than one-third of those who experienced sexual or physical violence while under the legal responsibility of the government during their childhood were Indigenous.
- More than one-quarter (26%) of Indigenous women experienced sexual violence by an adult during their childhood, compared with 9.2% of non-Indigenous women, 5.8% of Indigenous men and 2.8% of non-Indigenous men.
- For the period from 2015 to 2020, the average homicide rate involving Indigenous victims (8.64 per 100,000 Indigenous people) was six times higher than the homicide rate involving non-Indigenous victims (1.39 per 100,000 non-Indigenous people). The homicide rates for Indigenous people were particularly high in the Prairie provinces and in the territories.
- Nearly half (47%) of Indigenous women aged 15 and older who were murdered between 2015 and 2020 were killed by an intimate partner, a proportion similar to that of non-Indigenous women (49%), but much higher than for Indigenous men (7.3%) and non-Indigenous men (4.6%).
- In 2019, nearly 1 in 10 (8.4%) Indigenous people were victims of sexual assault, robbery or physical assault, about twice the proportion of non-Indigenous people (4.2%).
- Violence experienced during childhood is closely linked to the risk of violent victimization in adulthood. For example, more than one-quarter (27%) of Indigenous people who experienced sexual violence by an adult before the age of 15 were victims of a violent crime in 2019, compared with 3.7% of Indigenous people who did not experience violence during childhood.
- Among respondents aged 15 to 34, relatively similar proportions of Indigenous people (8.8%) and non-Indigenous people (7.3%) were victims of violence in the 12 months preceding the survey. However, among those aged 35 to 54, the proportion was three times higher among Indigenous people (12.4%) than among non-Indigenous people (3.9%).
- One-third of Indigenous people experienced discrimination in the five years preceding the survey. They were also more likely to have been the victim of a violent crime—14.9% of Indigenous people who experienced discrimination were victims of a violent crime in 2019, compared with 5.1% of Indigenous people who had not suffered discrimination.
- When taking key socioeconomic indicators into account, as well as factors related to social cohesion (e.g., trust in neighbours, discrimination), health (e.g., mental health, drug use) and history of child abuse and homelessness, Indigenous people were not at a higher risk of victimization than non-Indigenous people.
- Almost 4 in 10 (39%) Indigenous victims reported the most serious sexual or physical assault (excluding intimate partner violence) they experienced to police, more than twice the proportion of non-Indigenous victims who reported their victimization to police (18%). Indigenous victims were also more likely to have faced an armed assailant, to have been injured and to have used victim services.
- A little more than 1 in 10 (13%) Indigenous people with a current or ex-intimate partner experienced violence from their partner in the five years preceding the survey, a proportion twice as high as non-Indigenous people (5.7%).
- Over a 10-year period, the proportion of Indigenous women who experienced violence from a current or former spouse or common-law partner in the five years preceding the survey has decreased; in the provinces, it fell from 15%E in 2009 to 7.5% in 2019.
- Compared to non-LGBTQ2+ non-Indigenous people, LGBTQ2+ Indigenous people were more likely to have been sexually or physically assaulted by an adult when they were under age 15 (58% versus 26% of non-LGBTQ2+ non-Indigenous people), to have been sexually or physically assaulted since age 15 (82% versus 41%), and to have experienced intimate partner violence (37% versus 13%), or non-intimate sexual or physical assault in the 12 months preceding the survey (28% versus 5.9%).
- Indigenous people (17%) were about twice more likely than non-Indigenous people (9.2%) to have little or no confidence in their local police service. The differences between Indigenous and non-Indigenous people in this regard were greatest in Saskatchewan and in the territories.
- Overall, similar proportions of Indigenous and non-Indigenous people reported feeling safe when walking alone in their neighbourhood after dark.
In recent years, several studies have shown that First Nations people, Métis and InuitNote are more likely than non-Indigenous people to have experienced violence during their childhood (Burczycka 2017), to have been sexually or physically assaulted (Boyce 2016; Cotter and Savage 2019; Perreault 2020), to have been victims of violence by an intimate partner (Heidinger 2021; Boyce 2016), or to have been victims of homicide (Armstrong and Jaffray 2021; Moreau 2021).
Due to the historical and ongoing colonialism and related policies—including the experiences of residential schools and the Sixties Scoop—as well as individual and systemic racism, many Indigenous people today deal with intergenerational trauma, socioeconomic marginalization. Both the National Inquiry into Missing and Murdered Indigenous Women and Girls and the Truth and Reconciliation Commission of Canada indicated that persistent and deliberate human and Indigenous rights violations and abuses are the root cause behind Canada’s staggering rates of violence against Indigenous people (National Centre for Truth and Reconciliation 2015; National Inquiry into Missing and Murdered Indigenous Women and Girls 2019).
To provide the most comprehensive picture of violent victimization among First Nations people, Métis and Inuit, the analyses in this article are based on various Statistics Canada data sources to measure the nature and extent of criminal victimization of Indigenous people.
The first two sections of the article use self-reported data from the 2019 General Social Survey (GSS) on Canadians’ Safety (Victimization) to provide a picture of childhood victimization and the nature and extent of violent victimization in the 12 months preceding the survey, including intimate partner violence. The third section outlines the main characteristics of violent crimes against Indigenous people using self-reported data from the 2018 Survey of Safety in Public and Private Spaces (SSPPS). Based on police-reported data from the Homicide Survey, the fourth section shows the key trends and characteristics of homicides involving Indigenous victims from 2015 to 2020. Finally, the fifth part briefly presents Indigenous people’s perceptions of the criminal justice system and their personal safety using 2019 GSS data.Note
Due to the ongoing concern of the victimization of Indigenous women, highlighted by the National Inquiry into Missing and Murdered Indigenous Women and Girls, a detailed analysis on victimization of Indigenous women is presented in a separate article (see Heidinger 2022).
Experiences of victimization during childhood
The recent media coverage about unmarked graves of Indigenous children who died while attending residential schools brought again to the forefront the violence and mistreatment experienced by many Indigenous peoples throughout history. In addition to the mistreatment that many Indigenous persons personally suffered as children, there is also the intergenerational transmission of the trauma that these experiences have caused.
The Sixties Scoop, in which many Indigenous children were forcibly removed from their communities by child protective services and placed in the care of non-Indigenous families, and other practices that resulted in Indigenous children being separated from their families and communities, also affected the childhood of many Indigenous people, including mistreatment in their new families and the loss of cultural references. Still today, Indigenous children are overrepresented in child welfare services and foster families, and many argue that the current child welfare system is the continuation of the residential school system and the Sixties scoop (Blackstock 2007; Choate et al. 2021; National Collaborating Centre for Indigenous Health 2017a). Indigenous people who were taken from their families as a child may have been exposed to weak parenting models in their foster families, and may have missed opportunities to learn positive parenting skills, including traditional parenting practices (Bombay et al. 2009).
In addition, many studies have established a link between disadvantage in terms of resources and a greater vulnerability to childhood violence or maltreatment (Lefebvre et al. 2017; Rothwell et al. 2018; Patwardhan et al. 2017; Paxson and Walfogel 1999). However, many Indigenous communities and Indigenous people face limited and inequitable access or barriers (e.g., cultural barriers) to a wide range of services, including health, education and employment services, which likely impacts their socioeconomic and health circumstances (National Collaborating Centre for Indigenous Health 2019, 2017b and 2017c). For example, GSS data shows that Indigenous people were more likely than non-Indigenous people to report that some services, such as shelters or transition homes, were not available in their area (17% versus 7.9%). Typically, those barriers are more frequent in rural or remote areas, where geography and population size may also pose challenges in terms of services availability.
In part by consequence of the various factors documented above, and deeply rooted within the historical and ongoing effects of colonialism, many Indigenous people face socioeconomic challenges. For example, 2016 Census data shows that Indigenous total average income was $36,043, compared to $47,981 for non-Indigenous people.Note GSS data also show that 22% of Indigenous people reported they have been unable to pay scheduled bills or make other payments in the 12 months preceding the survey, compared with 10% of non-Indigenous people. Another study noted that 26% of Inuit, 24% of First Nations people and 11% of Métis live in a dwelling in need of major repairs, compared with 6.0% of non-Indigenous people (Statistics Canada 2018). Moreover, 18% of Indigenous people live in an overcrowded dwelling, compared with 8.5% of non-Indigenous people. The same study also highlighted that Indigenous people were much more likely than non-Indigenous people to experience food insecurity.
Despite these challenges, Indigenous people also benefit from several social factors that can mitigate the risk of violent victimization. For example, GSS data show that 27% of Indigenous people report a very strong sense of community belonging (compared with 21% of non-Indigenous people), 33% said they know most people in their neighbourhood (versus 15%), and 85% said their neighbourhood was a place where people help each other. In addition, Indigenous people were more likely to report that their spiritual beliefs were very important to the way they live their life (35% versus 28% of non-Indigenous people). These indicators may be reflective of strong social cohesion, which is known to be a protective factor from criminal victimization (Fitzgerald and Carrington 2008; Rhineberger-Dunn and Carlson 2011; Sampson et al. 1997). In addition, some socioeconomic gaps may be narrowing. For example, the proportion of Indigenous people aged 20 to 24 with a high school diploma increased from 57% in 2006 to 70% in 2016, although a large gap still remains compared to non-Indigenous people from the same age group (91%) (Anderson 2021).
In 2014, questions were added to the GSS to measure childhood experiences of sexual or physical abuse perpetrated by an adult. It is important to note that these data reflect the childhood experiences of people aged 15 and over, and may not be representative of current child maltreatment. In 2014, results showed that, overall, Indigenous people aged 15 and over were 1.4 times more likely than non-Indigenous people to have experienced sexual or physical abuse as children (Burczycka 2017).
In addition to sexual and physical violence, childhood maltreatment can also include exposure to spousal violence, and experiences of neglect and harsh parenting. In 2019, more detailed questions, including questions about these types of maltreatment, were added to the GSS to better measure the nature and extent of childhood maltreatment and its impact in adulthood.
Previous studies revealed that experiencing violence during childhood was associated with various issues in adulthood, such a greater likelihood of reporting mental health problems, substance abuse, contact with the police and victimization experiences, as well as a greater risk of experiencing serious emotional or psychological consequences from victimization (Bombay et al. 2009; Boyce et al. 2015; Burczycka 2017, Cotter 2021; O’Neil et al. 2018; Perreault 2015; Scott 2007). Child abuse is rarely reported to police, and as such, self-reported retrospective measures as in the GSS are among the few available means to quantify the issue (Burczycka 2017).
Indigenous people more likely to report having experienced certain parenting practices or had basic needs unmet
The GSS covers a wide range of behaviours of varying severity that may be defined as harsh or severe parenting practices. These include spanking, slapping on the hand, saying hurtful comments and making children feel unwanted or unloved. Although harsh parenting may appear to be less serious than criminal behaviours such as sexual or physical violence, it is nevertheless closely linked to the risk of victimization in adulthood (Cotter and Savage 2019; Cotter 2021; Perreault 2020).
Although different from harsh parenting, the GSS also included a question to measure situations where children’s basic needs (e.g., washing, feeding, clothing) were not met, which can also be detrimental to children who experience it.Note
The majority of people living in Canada, whether Indigenous or non-Indigenous, reported experiencing at least one type of harsh parenting or situations where their basic needs went unmet before the age of 15. However, this proportion was higher among Indigenous people (78%) than among non-Indigenous people (66%) (Chart 1). More precisely, 84% of Métis and 74% of First Nations persons reported experiencing harsh parenting or had their basic needs unmet before the age of 15, whereas a similar proportion of Inuit persons (67%E) and non-Indigenous persons reported having such experiences (Table 1).Note
Chart 1 start

Data table for Chart 1
| Type of harsh parenting or neglect | Indigenous persons | Non-Indigenous personsData table for Chart 1 Note ‡ | ||||
|---|---|---|---|---|---|---|
| percent | 95% confidence interval | percent | 95% confidence interval | |||
| from | to | from | to | |||
| Total harsh parenting | 73.3Note * | 68.0 | 77.9 | 61.5 | 60.3 | 62.6 |
| Was spanked or slapped on the hand | 61.4Note * | 55.6 | 66.9 | 52.5 | 51.5 | 53.6 |
| Was told things that really hurt their feelings | 48.6Note * | 42.9 | 54.3 | 39.6 | 38.4 | 40.8 |
| Felt unwanted or unloved | 26.0Note * | 21.3 | 31.3 | 16.8 | 16.0 | 17.7 |
| Basic needs were not metData table for Chart 1 Note 1 | 12.3Note * | 9.0 | 16.6 | 2.8 | 2.5 | 3.2 |
Source: Statistics Canada, General Social Survey, 2019. |
||||||
Chart 1 end
However, larger differences between Indigenous and non-Indigenous people were noted for specific childhood experiences. For example, Indigenous people (17%) were twice as likely as non-Indigenous people (7.8%) to have felt unwanted or unloved as children on multiple occasions (i.e., more than five times). Indigenous people were also about five times more likely to report that their basic needs had not been met, on multiple occasions, during their childhood (7.6% versus 1.4%).
Of note, the GSS does not capture who was responsible for these behaviours or situations. As such, it may have been biological parents, but it could have been a step or foster parent or another guardian. Some of these experiences, such as unmet basic needs, may also be the result of economic marginalization. For instance, several studies showed that food insecurity was higher among Indigenous people than among non-Indigenous people (First Nations Food, Nutrition and Environment Study 2021; Polsky and Garriguet 2022; Statistics Canada 2018)
Just over one-third of Indigenous people witnessed violence by a parent against another person
Previous studies reported higher rates of spousal or intimate partner violence among Indigenous people than among non-Indigenous people, a type of violence that can be linked to the history of colonization, intergenerational trauma, marginalization and economic deprivation (Andersson and Nahwegahbown 2010; Brownridge et al. 2017; Heidinger 2021; Public Health Agency of Canada 2012). In some cases, children in the household may witness intimate partner violence or violence by one parent against another adult or another child in the household. Regardless of whether they were themselves victims of violence, witnessing a parent’s violence against others is associated with several negative impacts (Wolfe et al. 2003; Wood and Sommers 2011).
Overall, just over one-third (34%) of Indigenous people (32% of First Nations people, 36% of Métis and 37%E of Inuit) witnessed violence by one parent against another person during their childhood. In comparison, this was the case for one in five (20%) non-Indigenous people (Table 1).
Witnessing a parent’s violence against another child in the household was most commonly reported, with just under one-quarter (23%) of Indigenous people having witnessed it during their childhood. Just over one in six (17%) Indigenous people reported witnessing violence by a parent against another parent. Seeing a parent hit an adult other than a parent was less common, but 13% of Indigenous people had nonetheless experienced it.
Compared with non-Indigenous people, Indigenous people were more likely to have witnessed parental violence on multiple occasions (i.e., more than five times). For example, Indigenous people were nearly four times more likely than non-Indigenous people to have witnessed violence by a parent against another parent on multiple occasions (8.8% versus 2.4%) and seven times more likely to have seen a parent hit another adult more than five times (4.2% versus 0.6%).
Approximately 4 in 10 Indigenous people report experiencing sexual or physical violence as children
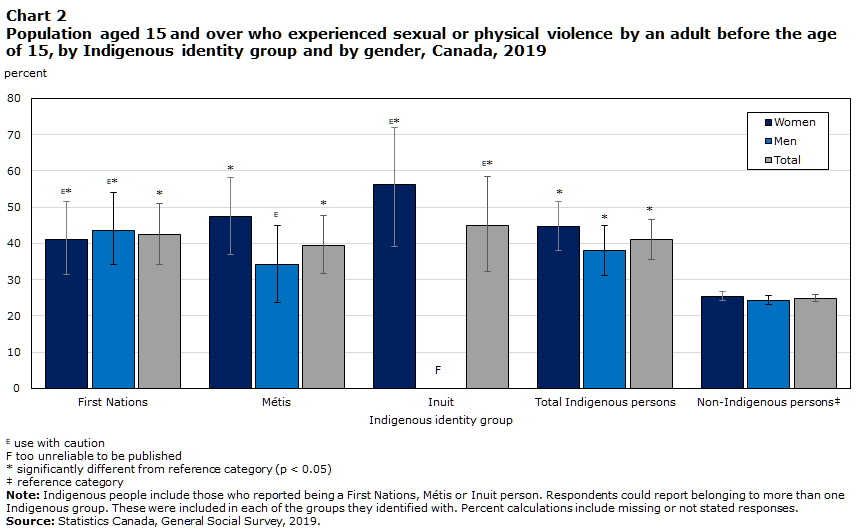
In 2019, Indigenous people were more likely than non-Indigenous people to report having experienced sexual or physical violence by an adult at least once before the age of 15. Approximately 4 out of 10 (41%) Indigenous people (42% of First Nations people, 39% of Métis and 45%E of Inuit) reported they had experienced such violence during childhood. Among non-Indigenous people, this proportion was 25% (Table 2, Table 3, Chart 2).
Chart 2 start
Data table for Chart 2
| Indigenous identity group | Women | Men | Total | ||||||
|---|---|---|---|---|---|---|---|---|---|
| percent | 95% confidence interval | percent | 95% confidence interval | percent | 95% confidence interval | ||||
| from | to | from | to | from | to | ||||
| First Nations | 41.1Note E: Use with caution Note * | 31.5 | 51.4 | 43.7Note E: Use with caution Note * | 29.7 | 58.6 | 42.3Note * | 34.1 | 50.9 |
| Métis | 47.3Note * | 36.8 | 58.1 | 34.3Note E: Use with caution | 23.8 | 46.6 | 39.4Note * | 31.7 | 47.7 |
| Inuit | 56.3Note E: Use with caution Note * | 39.2 | 72.0 | Note F: too unreliable to be published | Note F: too unreliable to be published | Note F: too unreliable to be published | 45.0Note E: Use with caution Note * | 32.3 | 58.4 |
| Total Indigenous persons | 44.7Note * | 38.0 | 51.6 | 37.9Note * | 29.3 | 47.5 | 41.0Note * | 35.6 | 46.6 |
| Non-Indigenous personsData table for Chart 2 Note ‡ | 25.4 | 24.2 | 26.7 | 24.2 | 22.9 | 25.6 | 24.8 | 23.9 | 25.8 |
|
E use with caution F too unreliable to be published
Source: Statistics Canada, General Social Survey, 2019. |
|||||||||
Chart 2 end
Among Canada’s various regions, Ontario has the highest proportion of Indigenous people who have experienced sexual or physical violence during childhood (54%E). In comparison, this proportion was 33% in the territories and 32% in the Prairies. In the Atlantic provinces (43%) and Quebec (37%E), the proportion of Indigenous people who experienced violence during childhood was closer to the national average (41%).Note
The overrepresentation of Indigenous people among victims of violence during childhood is declining with each new cohort
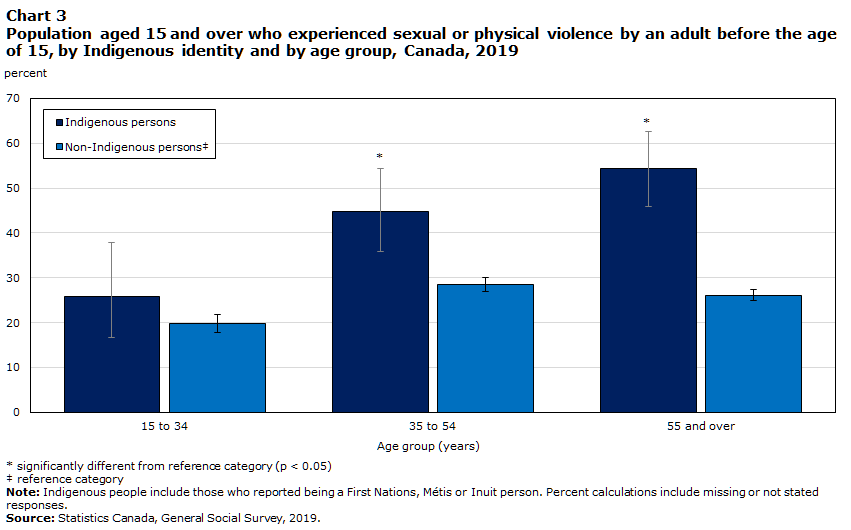
The 2014 GSS data revealed age differences, with younger Indigenous people less likely than older ones to have experienced sexual or physical violence by an adult during childhood (Burczycka 2017). The 2019 GSS data confirm what was noted in 2014—that Indigenous people aged 15 to 34 (26%) were significantly less likely than Indigenous people aged 35 to 54 (45%) or 55 and older (54%) to have experienced this form of violence during childhood (Chart 3).
Chart 3 start
Data table for Chart 3
| Age group (years) | Indigenous persons | Non-Indigenous personsData table for Chart 3 Note ‡ | ||||
|---|---|---|---|---|---|---|
| percent | 95% confidence interval | percent | 95% confidence interval | |||
| from | to | from | to | |||
| 15 to 34 | 25.9 | 16.7 | 37.9 | 19.8 | 17.9 | 21.8 |
| 35 to 54 | 44.9Note * | 35.8 | 54.3 | 28.4 | 26.9 | 30.0 |
| 55 and over | 54.4Note * | 46.0 | 62.6 | 26.0 | 24.8 | 27.3 |
Source: Statistics Canada, General Social Survey, 2019. |
||||||
Chart 3 end
In fact, the proportion of Indigenous people aged 15 to 34 who experienced violence during childhood (26%) is relatively similar to the proportion of non-Indigenous people of the same age (20%), a difference that is not statistically significant. In contrast, Indigenous people aged 55 and older were nearly twice as likely as non-Indigenous people of the same age to have experienced violence during childhood (54% versus 26%).
Over one-quarter of Indigenous women experienced sexual violence during childhood
The GSS measures childhood violence using a set of five retrospective questions, two of which focus on sexual violence. More specifically, respondents are asked how many times an adult has sexually touched them and how many times they have been forced (including attempts) to engage in a sexual activity.
Overall, 16% of Indigenous people (14% of First Nations people, 17% of Métis and 27%E of Inuit) experienced sexual violence perpetrated by an adult at least once before the age of 15. Among non-Indigenous people, this proportion was 6.1% (Table 2, Table 3, Chart 4).
Both Indigenous and non-Indigenous womenNote were much more likely than men to have experienced sexual violence during childhood. More than one-quarter (26%) of Indigenous women experienced sexual violence during childhood, nearly three times the proportion of non-Indigenous women (9.2%). This proportion was also more than four times higher than that of Indigenous men (5.8%) (Chart 4). Due to the ongoing concern of the victimization of Indigenous women and girls, highlighted by the National Inquiry into Missing and Murdered Indigenous Women and Girls, a detailed analysis on childhood abuse experiences of Indigenous women is presented in a separate article (see Heidinger 2022).
Chart 4 start

Data table for Chart 4
| Indigenous identity group | Women | Men | Total | ||||||
|---|---|---|---|---|---|---|---|---|---|
| percent | 95% confidence interval | percent | 95% confidence interval | percent | 95% confidence interval | ||||
| from | to | from | to | from | to | ||||
| First Nations | 20.0Note * | 13.9 | 28.0 | 6.4Note E: Use with caution | 2.7 | 14.3 | 13.8Note * | 9.8 | 19.0 |
| Métis | 32.1Note * | 22.3 | 43.8 | 4.9Note E: Use with caution | 2.1 | 11.2 | 17.5Note * | 12.1 | 24.6 |
| Inuit | 38.0Note E: Use with caution Note * | 21.3 | 58.1 | Note F: too unreliable to be published | Note F: too unreliable to be published | Note F: too unreliable to be published | 27.2Note E: Use with caution Note * | 15.6 | 43.0 |
| Total Indigenous persons | 26.1Note * | 20.4 | 32.6 | 5.8 | 3.2 | 10.1 | 16.0Note * | 12.7 | 20.0 |
| Non-Indigenous personsData table for Chart 4 Note ‡ | 9.2 | 8.4 | 10.0 | 2.8 | 2.4 | 3.3 | 6.1 | 5.6 | 6.6 |
|
E use with caution F too unreliable to be published
Source: Statistics Canada, General Social Survey, 2019. |
|||||||||
Chart 4 end
Among the various forms of sexual violence, sexual touching was reported most often. Overall, nearly one in six Indigenous people (16%) were sexually touched by an adult during childhood, compared with 5.9% of non-Indigenous people. The difference is more pronounced when only those who have been sexually touched multiple occasions are considered; Indigenous people were about four times more likely than non-Indigenous people to have sexually touched more than five times (5.9% versus 1.4%, respectively).
Having been forced to engage in a sexual activity during childhood was reported less frequently but nonetheless experienced by 11% of Indigenous people, compared with 3.0% of non-Indigenous people. Indigenous people were about six times more likely than non-Indigenous people to have experienced this form of violence more than five times (4.5% versus 0.8%, respectively).
In more than half of cases, the sexual violence was perpetrated by a family member
The GSS asked individuals who experienced sexual violence by an adult during their childhood to share some information about the most serious incidentNote they experienced, including details about the person who committed it and the location of the assault.
The majority (56%) of Indigenous people who experienced sexual violence during childhood indicated that a family member was responsible for the most serious assault. More specifically, one-quarter (25%E) identified an immediate family member,Note and nearly one-third (31%E) identified an extended family memberNote as being responsible. In comparison, 44% of non-Indigenous people who experienced sexual violence during childhood reported being assaulted by a family member (23% by an immediate family member, 21% by an extended family member)Note (Table 4).
However, compared with Indigenous people, non-Indigenous people were more likely to have been sexually assaulted by a neighbour, friend or acquaintance (32% versus 21%E). Among both Indigenous (95%) and non-Indigenous (93%) people, a man was responsible for the most serious sexual assault in almost all cases.
Just over half (51%E) of Indigenous people who experienced sexual violence during childhood reported that the most serious incident occurred in the family home. Slightly more than one-third (35%E) reported that the incident occurred in another residence, usually that of the perpetrator, and nearly 1 in 10 Indigenous victims (8.8%E) reported that the most serious incident occurred at a school or residential school.Note Non-Indigenous people were also most likely to have been sexually assaulted in a private residence, but compared with Indigenous people, they were more likely to have been assaulted in a public place (15% versus 3.6%E).
More than one-third of Indigenous people experienced physical violence during childhood
Physical violence in childhood includes being slapped, beaten, pushed, grabbed, shoved, bitten, burned, kicked, punched or strangled; having an object thrown at them; or being otherwise physically assaulted. More than one-third (36%) of Indigenous people (38% of First Nations people, 36% of Métis and 34%E of Inuit) reported having experienced physical violence by an adult during childhood (Table 2, Table 3).
Overall, Indigenous people (36%) were more likely than non-Indigenous people (22%) to have experienced physical violence by an adult at least once during their childhood. However, the differences between Indigenous and non-Indigenous people are more pronounced when considering those who experienced violence on several occasions.
Compared with non-Indigenous people, Indigenous people were twice as likely to have been slapped or beaten more than five times (13% versus 6.5%), three times more likely to have been shoved, grabbed, pushed or to have had an object thrown at them on several occasions (11% versus 3.3%) and over four times more likely to have been bitten, burned, kicked, punched, assaulted or otherwise physically attacked on more than five occasions (6.9% versus 1.6%).
In most cases, a man was responsible for the most serious physical assault, both among Indigenous people (65%) and non-Indigenous people (58%). However, these proportions are lower than those for sexual assaults perpetrated by a man (95% and 93%, respectively).
In the large majority of cases, Indigenous people who experienced physical violence during childhood reported that the most serious incident was committed by an immediate family member (73%) and that it occurred in the family home (76%).
Few victims of childhood violence have talked about the violence to authorities, but Indigenous victims were more likely to have done so
Experiences of sexual or physical violence during childhood have rarely come to the attention of police or child protection services. About one in six (16%) Indigenous people who experienced sexual or physical violence by an adult during childhood reported that they had talked about it to the authorities, whether it was to the police (12%) or child protection services (10%), before the age of 15. Of note, GSS data does not ask how the violence came to the attention of authorities, which may have been reported by someone other than the victim.
Compared to Indigenous people, non-Indigenous people (5.2%) were less likely to have talked to the authorities about the violence they experienced while under the age of 15: 3.7 % of victims spoke to the police and 2.8% spoke to child protection services (Chart 5). In comparison, approximately one-quarter (24%) of violent crimes committed against all victims aged 15 and older, Indigenous and non-Indigenous, were reported to the police in 2019 (Cotter 2021).
Chart 5 start

Data table for Chart 5
| Person to whom the victim talked about the incidents before age 15 | Indigenous persons | Non-Indigenous personsData table for Chart 5 Note ‡ | ||||
|---|---|---|---|---|---|---|
| percent | 95% confidence interval | percent | 95% confidence interval | |||
| from | to | from | to | |||
| Police or child protection services | 16.2Note * | 10.4 | 24.4 | 5.2 | 4.4 | 6.3 |
| Police | 12.0Note * | 7.4 | 19.0 | 3.7 | 3.0 | 4.5 |
| Child protection services | 10.1Note * | 5.5 | 18.0 | 2.8 | 2.2 | 3.7 |
| Family member | 35.3 | 27.2 | 44.4 | 28.3 | 26.5 | 30.3 |
| Friend | 18.3 | 12.4 | 26.1 | 15.4 | 13.8 | 17.2 |
| Health professional | 7.7 | 3.3 | 16.7 | 2.7 | 2.1 | 3.5 |
| Teacher | 5.2 | 2.0 | 13.1 | 2.0 | 1.5 | 2.7 |
| Other | 11.4Note * | 5.9 | 20.9 | 3.4 | 2.7 | 4.2 |
Source: Statistics Canada, General Social Survey, 2019. |
||||||
Chart 5 end
Some victims of childhood violence were also able to talk about the events to others, such as a family member or a friend. Overall, slightly less than half (46%) of Indigenous people who had experienced violence during childhood talked to someone other than the authorities about these violent events before the age of 15. Most of the time, they were family members (35%), friends (18%), health care workersNote (7.7%) or teachers (5.2%).
More than one-third of individuals who experienced sexual or physical violence while under the legal responsibility of the government are Indigenous
Indigenous people 15 years of age and older were about 9 times more likely than non-Indigenous people to have been under the government’s responsibility during their childhood (11% versus 1.3%). Specifically, 15% of First Nations people, 7.3% of Métis and 19%E of Inuit reported that they had previously been under the government’s responsibility (Table 2).
For many children, particularly Indigenous children, these placements under the responsibility of the government were accompanied by sexual or physical violence. Overall, more than one-third (34%) of people aged 15 and older who experienced violence while they were under the government’s responsibility are Indigenous.
Start of text box 1
Text box 1
Overrepresentation
of Indigenous people in child
protection services
Several studies and reports indicate that Indigenous people are overrepresented in child protection services (Assembly of First Nations 2006; Ma et al. 2019; National Centre for Truth and Reconciliation 2015; Sinha et al. 2011).
The higher proportion of Indigenous people who have been under the legal responsibility of the government during their childhood could be partly due to a higher severity and reporting of childhood violence among the Indigenous population. Indigenous people were more likely than non-Indigenous people to have experienced certain behaviours by an adult multiple times (i.e., more than five times) before the age of 15 (Table 1, Table 2). Respondents, whether Indigenous or non-Indigenous, who reported having been repeatedly subjected to certain behaviours were also more likely to have talked the authorities about it.
For example, non-Indigenous people who reported having been forced to engage in sexual activity more than five times, sexually touched more than five times, beaten more than five times, or pushed or grabbed more than five times were about as likely as Indigenous people who had the same experiences (15% and 21%,Note respectively) to have told authorities about it. As such, it is possible that the relatively high proportion of Indigenous people who have been under the legal responsibility of the government is, in part, attributable to the heightened frequency and severity of sexual and physical violence experienced as well as such violence being more commonly reported to authorities.
However, even among those who reported having experienced less serious or less frequent violence, it was more likely to have been reported to the authorities when it involved Indigenous people. For example, among those who were slapped or hit five times or less by an adult before the age of 15, Indigenous people were about four times more likely than non-Indigenous people to have talked to authorities (13%E versus 2.9%).
A multivariate analysis was conducted to analyze the factors involved in a greater likelihood of having been under the legal responsibility of the government. The analysis took into account the severity and frequency of the past acts of violence or neglect, as well as the relationship between the child and the person who committed the most serious assault, the location of the most serious assault and Indigenous identity of victim. However, several known correlates were not part of the General Social Survey and could not be included in the multivariate analysis, for example, the resources of parents (e.g., social network, financial resources), the mental health or substance use of parents, or the household situation (e.g., overcrowding in dwellings).
Nevertheless, the results show that the greater proportion of Indigenous people who have been under the government’s responsibility during their childhood is, at least partly, attributable to factors other than the severity or frequency of violence or neglect. Of all the factors considered, being Indigenous remained most closely related to the likelihood of having been under the legal responsibility of the government (odds ratio = 6.85)Note (Text box 1 table).
Many have criticized child protection systems as a continuation of the residential school system and for perpetuating experiences of marginalization, oppression and colonialism (Blackstock 2007; Choate et al. 2021; National Collaborating Centre for Indigenous Health 2017a). For its part, the report of the National Inquiry into Missing and Murdered Indigenous Women and Girls emphasized that the way in which child protection services investigate child apprehensions or substantiate their merits can be deemed racist and insufficient (National Inquiry into Missing and Murdered Indigenous Women and Girls 2019).
In this context, former Bill C-92, An Act respecting First Nations, Inuit and Métis children, youth and families, received Royal Assent in June 2019. The purpose of the act is to enable Indigenous communities and groups to develop child protection policies and legislation based on their own histories, cultures and situations, to protect the relationship between children and their families, communities and cultures (Indigenous Services Canada 2019).
End of text box 1
Victimization experiences of people aged 15 and over in the 12 months preceding the survey
In addition to experiences of sexual or physical violence experienced by Indigenous people as children, the issue of overrepresentation of Indigenous people among victims of violent crime has also often been a focal point in recent news. The final report of the National Inquiry into MMIWG highlighted the high homicide rates and disappearances of Indigenous women and girls. Further, the report emphasized the context of such violence, often marked by intergenerational trauma; marginalization in the form of poverty, precarious housing or homelessness; and barriers to education, employment, health care and cultural support (National Inquiry into Missing and Murdered Indigenous Women and Girls 2019). The most recent data continue to show higher homicide rates and violent victimization rates among Indigenous people than non-Indigenous people (Armstrong and Jaffray 2021; Cotter 2021).
Using data from the 2019 GSS, the next section presents an analysis of the nature and extent of more recent victimization (i.e., in the 12 months preceding the survey) among First Nations people, Métis and Inuit. In addition, it discusses the context and key factors associated with this violence.
Indigenous people are twice as likely as non-Indigenous people to have been victims of violent crime
Nearly 80,000 Indigenous people were victims of at least one sexual assault, robbery or assault in the 12 months preceding the 2019 GSS. This represents 8.4% of Indigenous people, twice the proportion of non-Indigenous people (4.2%) (Table 3, Table 5). Specifically, 4.1% of Indigenous people reported having been victims of one violent crime, while 4.3% reported having been victims of at least two violent crimes.Note In comparison, 2.2% of non-Indigenous people were victims of one violent crime, and 1.9% were victims of at least two violent crimes.Note
Overall, Indigenous people were the victims of just over 165,000 violent crimes, representing 6.4% of all violent crimes. This corresponds to a rate of 177 violent crimes per 1,000 Indigenous people, compared with a rate of 80 violent crimes per 1,000 non-Indigenous people.
Among the various crimes, physical assaults were the most frequent, accounting for more than two-thirds (68%) of violent crimes reported by Indigenous people. About one in five (20%) violent crimes were sexual assaults, while 12% were robberies.
Indigenous people living in rural areas are about as likely as non-Indigenous people to have been victims of violent crime
While, overall, Indigenous people were more likely than non-Indigenous people to report having been victims of a violent crime in 2019, this may not be the case in rural areas (that is, areas outside of census metropolitan areas or census agglomerationsNote ). In rural areas, 6.4% of Indigenous peopleNote reported having been the victims of a violent crime, a proportion not statistically different from that reported by non-Indigenous people in rural areas (3.9%). In contrast, Indigenous people living in urban areas were about twice as likely as their non-Indigenous counterparts to have been victims of a violent crime in 2019 (9.7%Note versus 4.2%) (Table 5, Table 6).
Previous studies based on police-reported data have found relatively high crime rates in the northern parts of the country—that is, in the provincial North and the territories (Allen and Perreault 2015; Perreault 2019), which are mostly rural. According to self-reported data from the 2019 GSS, 11% of Indigenous people living in northern areas were victims of a violent crime in 2019. However, the difference between that proportion and the proportion of victims among non-Indigenous people living in northern areas (6.2%) or among Indigenous people living in southern areas (7.6%) was not found to be statistically significant.
Start of text box 2
Text box 2
Indigenous
people living in the Atlantic provinces are less likely to have been victims of
a crime against the person than Indigenous people in other regions
In addition to providing information on experiences of violent victimization, the General Social Survey collects data on thefts of personal property that occurred in the 12 months preceding the survey. Together, this information represents crimes against the person. The analysis of all crimes against the person helps identify certain differences between the provinces or territories, which would not be possible if the analysis focused on violent crimes only because of sample size.Note
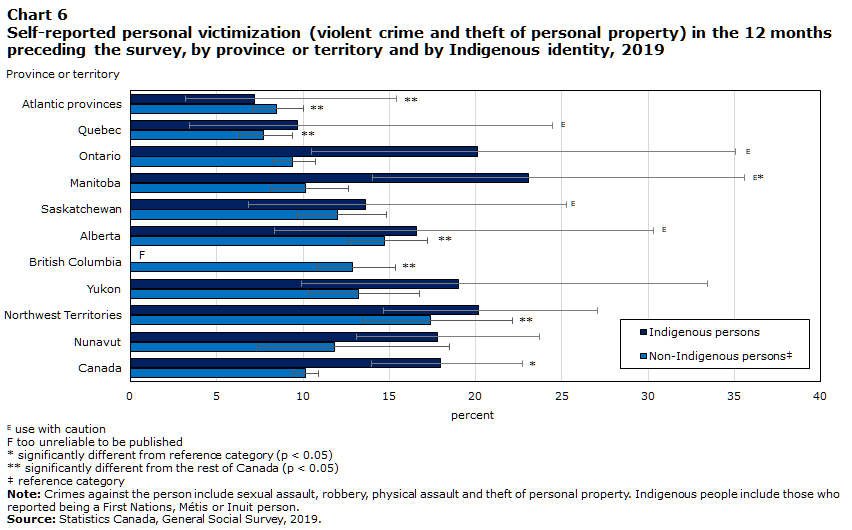
Of the Indigenous population residing in all provinces and territories, Indigenous people living in the Atlantic provincesNote were least likely to have been victims of a crime against the person in 2019. In the Atlantic provinces taken as a whole, 7.2% of Indigenous people were victims of violent a violent crime or theft of personal property. In comparison, this proportion was 18% nationwide. In addition, the proportion of Indigenous people who were victims of a crime against the person in the Atlantic provinces was similar to the proportion of their non-Indigenous counterparts (8.5%) (Chart 6).
Chart 6 start
Data table for Chart 6
| Province or territory | Indigenous persons | Non-Indigenous personsData table for Chart 6 Note ‡ | ||||
|---|---|---|---|---|---|---|
| percent | 95% confidence interval | percent | 95% confidence interval | |||
| from | to | from | to | |||
| Atlantic provinces | 7.2Note ** | 3.2 | 15.4 | 8.5Note ** | 7.1 | 10.0 |
| Quebec | 9.7Note E: Use with caution | 3.4 | 24.5 | 7.7Note ** | 6.3 | 9.4 |
| Ontario | 20.1Note E: Use with caution | 10.5 | 35.1 | 9.4 | 8.2 | 10.7 |
| Manitoba | 23.1Note E: Use with caution Note * | 14.0 | 35.6 | 10.2 | 8.1 | 12.6 |
| Saskatchewan | 13.6Note E: Use with caution | 6.9 | 25.3 | 12.0 | 9.6 | 14.9 |
| Alberta | 16.6Note E: Use with caution | 8.3 | 30.3 | 14.7Note ** | 12.6 | 17.2 |
| British Columbia | Note F: too unreliable to be published | 13.7 | 43.7 | 12.9Note ** | 10.8 | 15.4 |
| Yukon | 19.0 | 9.9 | 33.4 | 13.2 | 10.3 | 16.7 |
| Northwest Territories | 20.2 | 14.7 | 27.1 | 17.4Note ** | 13.5 | 22.1 |
| Nunavut | 17.8 | 13.1 | 23.7 | 11.8 | 7.4 | 18.5 |
| Canada | 17.9Note * | 14.0 | 22.7 | 10.1 | 9.4 | 10.9 |
|
E use with caution F too unreliable to be published
Source: Statistics Canada, General Social Survey, 2019. |
||||||
Chart 6 end
Manitoba was the province with the greatest difference in victimization between Indigenous and non-Indigenous people. Nearly one-quarter (23%E) of Indigenous people in that province reported they were victims of at least one violent crime or theft of personal property in the 12 months preceding the survey, compared with 10% of non-Indigenous people. This difference was mainly because of high victimization rates in urban areas. In rural areas, 5.4% of Indigenous people and 5.0% of non-Indigenous people reported being victims of a crime against the person.
End of text box 2
More than 1 in 10 Métis and Inuit were victims of a violent crime in 2019
The higher victimization rates among Indigenous people are primarily attributable to the high rates reported by Métis and Inuit. More specifically, 12% of Métis (225 violent crimes per 1,000 Métis) and 11%E of Inuit (265E violent crimes per 1,000 Inuit) reported experiencing at least one violent crime in 2019. Among First Nations people, 5.5% were victims of at least one violent crime (127 violent crimes per 1,000 First Nations people), a proportion relatively similar to that of non-Indigenous people (4.2%)Note (Table 3, Chart 7).
Chart 7 start

Data table for Chart 7
| Indigenous identity group | rate per 1,000 population | 95% confidence interval | |
|---|---|---|---|
| from | to | ||
| First Nations | 127 | 33 | 220 |
| Métis | 225Note * | 84 | 367 |
| Inuit | 265Note * | 114 | 415 |
| Total Indigenous persons | 177Note * | 97 | 258 |
| Non-Indigenous personsData table for Chart 7 Note ‡ | 80 | 68 | 92 |
Source: Statistics Canada, General Social Survey, 2019. |
|||
Chart 7 end
The higher prevalence of victimization among Métis and Inuit was observed primarily for physical assaults. The proportions of individuals who were sexually assaulted or robbed at least once were relatively similar in each Indigenous group and when compared to non-Indigenous people.Note In contrast, 10%E of Inuit and 8.5% of Métis were victims of at least one physical assault incident, compared with 4.5% of First Nations people and 2.6% of non-Indigenous people (Table 3).Note
Nearly 1 in 10 Indigenous women were victims of a violent crime in 2019
While the victimization of Indigenous women is a long-standing problem (see Miladinovic and Mulligan 2015 or Brzozowski et al. 2006), as a social issue, it has received more attention in recent years. In particular, the numerous cases of missing and murdered Indigenous women and girls led to the establishment of a national inquiry in 2016 (National Inquiry into Missing and Murdered Indigenous Women and Girls 2019). Victimization among Indigenous women is discussed in depth in the article “Violent victimization and perceptions of safety: Experiences of First Nations, Métis and Inuit women in Canada” (Heidinger 2022).
According to 2019 GSS data, nearly 1 in 10 (9.3%) Indigenous women (5.9% of First Nations women, 15% of Métis women and 9.7%E of Inuit women) were victims of a violent crime in the 12 months preceding the survey (Table 5, Table 6). More specifically, 2.8% of Indigenous women were sexually assaulted, 1.8% were robbed and 6.3% were physically assaulted. Among non-Indigenous people, approximately 1 in 20 (4.9%) women were victims of a violent crime.Note
Among Indigenous men, 7.7% (5.1%E of First Nations people and 9.6%E of Métis men)Note were victims of a violent crime in the 12 months preceding the survey—twice the proportion of non-Indigenous men (3.4%).
Indigenous people aged 35 to 54 are most likely to have been victims of a violent crime
Most studies on victimization show that there is a strong link between age and risk of victimization (Cotter 2021; Perreault 2015; Siddique 2016). In general, victimization rates peak among those aged 15 to 24, then tend to decline gradually as age increases. A similar relationship has also been noted between age and the commission of crime, both in Canada and in most countries (Loeber et al. 2015; Ulmer and Steffensmeier 2014).
Among respondents aged 15 to 34 years, Indigenous and non-Indigenous people were the victims of a relatively similar level of violent crime in 2019. The highest rates were rather found among Indigenous people aged 35 to 54. As such, about one in eight (12%) Indigenous people (8.4%E of First Nations people and 19%E of Métis)Note aged 35 to 54 years were victims of at least one violent crime in the 12 months preceding the survey. This proportion is approximately four times higher than that of non-Indigenous people of the same age (3.9%) or Indigenous people aged 55 and older (3.4%) (Table 5, Table 6, Chart 8).
Chart 8 start

Data table for Chart 8
| Indigenous identity and gender | 15 to 34 years | 35 to 54 years | 55 years and over | ||||||
|---|---|---|---|---|---|---|---|---|---|
| percent | 95% confidence interval | percent | 95% confidence interval | percent | 95% confidence interval | ||||
| from | to | from | to | from | to | ||||
| Indigenous persons | |||||||||
| Women | 8.4Note E: Use with caution | 3.5 | 18.6 | 14.0Note E: Use with caution | 6.8 | 26.9 | 3.7Note E: Use with caution | 1.6 | 8.4 |
| Men | Note F: too unreliable to be published | Note F: too unreliable to be published | Note F: too unreliable to be published | 9.7Note E: Use with caution | 3.8 | 22.9 | 3.2Note E: Use with caution | 0.9 | 10.2 |
| Total | 8.8 | 4.9 | 15.3 | 12.4Note * | 6.8 | 21.5 | 3.4 | 1.7 | 6.8 |
| Non-Indigenous personsData table for Chart 8 Note ‡ | |||||||||
| Women | 9.3 | 7.5 | 11.6 | 4.4 | 3.4 | 5.8 | 1.8 | 1.4 | 2.3 |
| Men | 5.2 | 3.8 | 7.0 | 3.3 | 2.6 | 4.2 | 1.8 | 1.2 | 2.7 |
| Total | 7.3 | 6.1 | 8.7 | 3.9 | 3.2 | 4.7 | 1.8 | 1.5 | 2.3 |
|
E use with caution F too unreliable to be published
Source: Statistics Canada, General Social Survey, 2019. |
|||||||||
Chart 8 end
The higher rates of violent victimization among Indigenous people aged 35 to 54 may be related, in part, to the higher proportions of those who experienced violence during childhood in this age group compared with Indigenous people younger than 35. Having experienced violence during childhood is associated with mental health problems, substance use, marginalization and discrimination, which in turn can increase the risk of victimization (Boyce et al. 2015; Burczycka 2017; Cotter 2021; Perreault 2015).
Start of text box 3
Text box 3
Self-reported
spousal violence and intimate partner violence
Similar to violent victimization in general, several studies have noted higher rates of spousal violence or intimate partner violence among Indigenous people compared with non-Indigenous people (Boyce 2016, Burczycka 2016; Heidinger 2021). The ongoing legacy of colonization and cultural suppression may have led to the normalization of violence, especially against women (Andersson and Nahwegahbon 2010; Heidinger 2021; National Inquiry into Missing and Murdered Indigenous Women and Girls 2019).
In 2019, 7.5% of Indigenous people (7.3% of First Nations people, 9.4% of Métis and 15%E of Inuit) who were married or in common-law relationships or had (or had contact with) a partner in the previous five years, experienced spousal violence in the five years preceding the survey. Among non-Indigenous people, the proportion was 3.4%. That said, there has been a significant decrease in spousal violence against Indigenous women. Specifically, the proportion of spousal violence victims among Indigenous women decreased by about 50% since 2009, from 15%E in 2009 to 7.5% in 2019 (Chart 9).
Chart 9 start

Data table for Chart 9
| Indigenous identity and gender | 2009 | 2014 | 2019Data table for Chart 9 Note ‡ | ||||||
|---|---|---|---|---|---|---|---|---|---|
| percent | 95% confidence interval | percent | 95% confidence interval | percent | 95% confidence interval | ||||
| from | to | from | to | from | to | ||||
| Indigenous persons | |||||||||
| Women | 15.4Note E: Use with caution Note *** | 10.8 | 21.4 | 9.7Note E: Use with caution Note ** | 6.3 | 14.5 | 7.5 | 4.0 | 13.6 |
| Men | Note F: too unreliable to be published | Note F: too unreliable to be published | Note F: too unreliable to be published | 8.0Note E: Use with caution Note ** | 4.7 | 13.4 | 6.2 | 2.8 | 13.5 |
| Total | 9.5Note ** | 6.9 | 13.1 | 8.8Note ** | 6.4 | 12.1 | 6.9Note ** | 4.3 | 10.9 |
| Non-Indigenous personsData table for Chart 9 Note ‡ | |||||||||
| Women | 6.0Note * | 5.4 | 6.7 | 3.3 | 3.0 | 3.8 | 4.1 | 3.4 | 5.0 |
| Men | 6.1Note * | 5.4 | 6.9 | 4.1Note * | 3.6 | 4.7 | 2.6 | 2.1 | 3.2 |
| Total | 6.1Note * | 5.6 | 6.6 | 3.7 | 3.4 | 4.1 | 3.4 | 2.9 | 3.9 |
|
E use with caution F too unreliable to be published
Source: Statistics Canada, General Social Survey, 2019. |
|||||||||
Chart 9 end
In 2019, questions were added to the General Social Survey to better measure the nature and extent of violence committed by current or former intimate partners other than married or common-law partners. Overall, 11% of Indigenous people (8.9% of First Nations people, 13% of Métis and 17%E of Inuit) reported having experienced violence from an intimate partner in the five years preceding the survey, more than double the proportion of non-Indigenous people (4.7%)Note (Chart 10).
More specifically, 11% of Indigenous people reported having been threatened with being hit; had an object thrown at them; been pushed, grabbed or slapped by an intimate partner. Meanwhile, 18% reported having been bitten, punched or kicked; hit with an object; beaten or choked; threatened with a weapon; and forced or manipulated into engaging in non-consensual sexual activity. In comparison, these proportions were 5.1% and 3.1% for non-Indigenous people, respectively.
Chart 10 start

Data table for Chart 10
| Indigenous identity group | Women | Men | Total | ||||||
|---|---|---|---|---|---|---|---|---|---|
| percent | 95% confidence interval | percent | 95% confidence interval | percent | 95% confidence interval | ||||
| from | to | from | to | from | to | ||||
| First Nations | 15.7Note E: Use with cautionNote * | 8.8 | 26.3 | 6.4Note E: Use with caution | 2.5 | 15.7 | 11.7Note * | 7.2 | 18.4 |
| Métis | 12.9Note E: Use with caution | 7.1 | 22.6 | 17.6Note E: Use with cautionNote * | 8.2 | 33.9 | 15.5Note * | 9.2 | 24.9 |
| Inuit | Note F: too unreliable to be published | Note F: too unreliable to be published | Note F: too unreliable to be published | Note F: too unreliable to be published | Note F: too unreliable to be published | Note F: too unreliable to be published | 22.0Note E: Use with cautionNote * | 11.6 | 37.5 |
| Total Indigenous persons | 13.5Note * | 9.0 | 19.7 | 12.9Note * | 7.0 | 22.7 | 13.3Note * | 9.3 | 18.5 |
| Non-Indigenous personsData table for Chart 10 Note ‡ | 6.5 | 5.7 | 7.5 | 4.9 | 4.1 | 5.9 | 5.7 | 5.1 | 6.4 |
|
E use with caution F too unreliable to be published
Source: Statistics Canada, General Social Survey, 2019. |
|||||||||
Chart 10 end
In addition to physical or sexual violence, violence between intimate partners can sometimes take the form of psychological or financial abuse. Just over one in four (27%) Indigenous people (21% of First Nations people, 30% of Métis and 47%E of Inuit) experienced psychological or financial abuse from an intimate partner,Note compared with 16% of non-Indigenous people.
For more information on intimate partner violence and spousal violence, see the Juristat articles “Spousal violence in Canada, 2019” (Conroy 2021) and “Intimate partner violence: Experiences of First Nations, Métis and Inuit women” (Heidinger 2021).
End of text box 3
Individuals who report drug use have higher victimization rates
Indigenous people were more likely than non-Indigenous people to report having used cannabis or illicit drugs in the 12 months preceding the survey. One-quarter (25%) of Indigenous people (19% of First Nations people, 30% of Métis and 46%E of Inuit) reported having used cannabis or illicit drugs, compared with 15% of non-Indigenous people. Various studies have noted an increased risk of victimization among people using cannabis or illicit drugs (Boyce 2016; Cotter and Savage 2019; Cotter 2021; Perreault 2015; Perreault 2020). The same association was noted with 2019 GSS data, where Indigenous people who used drugs were about three times more likely than those who did not use drugs to have been victims of at least one violent crime (17% versus 5.4%) (Table 7).
Among both Indigenous and non-Indigenous people, drug users were more likely than non-drug users to be aged 15 to 34 (49% versus 28%), to be single (41% versus 26%), to go out during the evening 20 or more times per month (31% versus 21%), to report binge drinkingNote at least once per month (52% versus 18%) and to have a partner who uses drugs or engages in binge drinking at least once per month (66% versus 19%).Note These factors are also associated with higher victimization rates. Thus, people who use drugs may be more exposed to violence.
Drug use is also associated with other difficult life experiences or experiences of marginalization. For example, drug use was more common among Indigenous people who had experienced childhood violence (33%) or harsh parenting (29%) than those who had not experienced such violence (21%) or harsh parenting (16%). Similarly, drug use was higher among people who had previously been homeless, who had a physical or mental disability, or who had been discriminated against in the last five years. However, these life experiences are also linked to an increased risk of victimization.
Finally, some victims may use drugs to deal with the negative impact of victimization. According to data from the 2018 SSPPS, 10% of people who use drugs and who had been victims of physical or sexual assault in their lifetimeNote reported using substances to cope with the negative impacts of victimization.
A history of violence or harsh or negligent parenting during childhood is closely linked to the risk of victimization in adulthood
Among both Indigenous and non-Indigenous populations, experiencing violence or harsh parenting practices during childhood is one of the main factors associated with the risk of victimization in adulthood (Burczycka 2017; Cotter 2021; Perreault 2015; Perreault 2020). As noted in the first section of this article, Indigenous people, particularly those aged 35 and older, were more likely than non-Indigenous people to have experienced violence during their childhood.
Thus, higher rates of violent victimization among Indigenous people may be tied with the greater proportion having experienced violence or harsh parenting practices. For example, 1.1% of Indigenous peopleNote who never experienced harsh or neglectful parentingNote were victims of a violent crime in the 12 months preceding the survey, a proportion similar to that reported by their non-Indigenous counterparts (1.7%). However, this proportion was approximately 10 times higher among Indigenous people who had experienced harsh parenting (11%, 7.5% of First Nations people and 15% of Métis), and approximately twice as high as non-Indigenous people who had also experienced such behaviours (5.7%) (Table 7).
Similarly, while 3.7% of Indigenous people who had not experienced childhood violence reported being the victims of a violent crime in 2019, this proportion was 14% (11%E of First Nations people and 22%E of Métis)Note among those who experienced physical violence and 27%E among those who experienced sexual violence. Among non-Indigenous people, these proportions were 2.9%, 7.6% and 10%, respectively.
Start of text box 4
Text box 4
Multivariate
analysis: Indigenous identity is not a factor associated with the risk of
violent victimization, but sexual violence in childhood is a significant factor
There is a close correlation between several factors that are associated with higher rates of violent victimization. For example, being young is generally associated with higher rates of violent victimization, but being young is also associated with being single, going out during the evening more often and using more alcohol or drugs. All these factors are also associated with higher victimization rates in general. A multivariate analysis (logistic regression) analyzes these factors independently, keeping the other factors constant, and determines which ones are the most decisive.
In this article, a first round of multivariate analyses was conducted across the population to determine whether Indigenous persons remained at greater risk of victimization when other factors remained constant.
When taking into account some key socioeconomic factors (i.e., age, gender, marital status, education, and sexual orientation) Indigenous people continued to be at slightly higher risk of violent victimization compared to non-Indigenous people (Model 1). However, when additional factors related to social cohesion (trust in neighbours, discrimination), health (poor mental health), lifestyle (drug use, frequency of evenings out) and, most important, certain circumstances (childhood abuse, homelessness) were also considered, Indigenous persons did not have a higher risk of violent victimization (Model 2) (Table 8). Said otherwise, higher victimization rates among Indigenous people can be attributed to factors such as socioeconomic and health conditions, as well as history of homelessness and childhood maltreatment.
Factors associated with an increased risk of victimization may however be slightly different among Indigenous people compared with the general population. Thus, another regression model was applied only to the Indigenous population. Age was also a risk factor among Indigenous people, but as noted earlier, the risk of victimization only drops significantly around the age of 55. As was the case with the general population model, a history of childhood sexual violence and harsh parenting were among the factors most closely associated with an increased risk of victimization among the Indigenous people. Finally, even when the various risk factors are considered, Indigenous people living in the territories or the Prairie provinces were more likely to have been victims of violent crime than Indigenous people living in the other provinces (Model 3) (Table 9).
End of text box 4
The rate of violent victimization is four times higher among Indigenous people who have experienced discrimination than among those who have not
In Canada, people belonging to certain population groups are more likely than others to be discriminated against (i.e., experience unfair treatment because of ethnicity or culture, gender, sexual orientation, or physical or mental disability) (Gorelik 2022; Ibrahim 2020; Gravel 2015; Statistics Canada 2020).
One-third (33%) of Indigenous people (44% of First Nations people, 24% of Métis and 29%E of Inuit) reported having experienced discrimination in the five years preceding the survey. The most common experiences of discrimination faced by Indigenous people occurred in a store, restaurant or bank (14%) and in the workplace (13%).
Compared with interactions with the staff of stores, restaurants and banks or interactions with co-workers, interactions with the police are generally infrequent. Thus, few people reported being discriminated against in their dealings with the police (1.2%). However, Indigenous people were overrepresented among victims of police discrimination. While they accounted for about 5% of those who had been discriminated against in general, Indigenous people accounted for 17% of those who had experienced discrimination in their dealings with the police. Systemic racism in policing in Canada is a growing concern and likely a contributing factor to Indigenous people’s overrepresentation in the criminal justice system (David and Mitchell 2021)
Several of the population groups most likely to face discrimination also record relatively high rates of violent victimization. This is true of Indigenous people, but also of women, people with physical or mental disabilities, and bisexual individuals (Cotter 2021). But even within each of these population groups, those who personally experienced discrimination were the most likely to have been victims of a violent crime. For example, 15% of Indigenous people who experienced discrimination were also victims of violent crime in 2019, a rate of 354 violent crimes per 1,000 people. This rate is four times higher than that of Indigenous people who did not experience discrimination (86 crimes per 1,000 people) (Table 5, Table 6).
Violence may be partly rooted in the same social structures as discrimination. Thus, the most marginalized Indigenous people may also be the most vulnerable to discrimination and violence. According to the National Inquiry into Missing and Murdered Indigenous Women and Girls, discrimination is one of the factors behind high rates of violence against Indigenous women (National Inquiry into Missing and Murdered Indigenous Women and Girls 2019).
Start of text box 5
Text box 5
Victimization
of LGBTQ2+ Indigenous people
Previous studies have shown that LGBTQ2+ peopleNote were more likely to experience sexual or physical assaults, as well as other types of unwanted behaviours compared to non-LGBTQ2+ people (Jaffray 2020; Perreault 2020). The same studies have highlighted an increased risk of victimization among LGBTQ2+ individuals who also identify with another marginalized population group, such as people with a disability and Indigenous people.
The sample size of the 2019 General Social Survey on Canadian’s Safety (victimization) does not allow reliable estimates for LGBTQ2+ Indigenous people. However, data from the 2018 Survey on Safety in Public and Private Spaces do show that, compared to non-LGBTQ2+ non-Indigenous people, LGBTQ2+ Indigenous people were more likely to have experienced sexual or physical assault as well as intimate partner violence (IPV). More specifically, LGBTQ2+ Indigenous people were about twice as likely to have been sexually or physically assaulted by an adult when they were under age 15 (58% versus 26%), to have been sexually or physically assaulted since age 15 (82% versus 41%), and to have experienced IPV since age 15 (81% versus 40%) (Text box 5 chart).
Text box 5 chart 1 start

Data table for Text box 5 chart 1
| Experiences of victimization | Indigenous LGBTQ2+ persons | Indigenous non-LGBTQ2+ persons | Non-Indigenous LGBTQ2+ persons | Non-Indigenous non-LGBTQ2+ personsData table for textbox 5 Chart 1 Note ‡ | ||||||||
|---|---|---|---|---|---|---|---|---|---|---|---|---|
| percent | 95% confidence interval | percent | 95% confidence interval | percent | 95% confidence interval | percent | 95% confidence interval | |||||
| from | to | from | to | from | to | from | to | |||||
| Assault before age 15Data table for textbox 5 Chart 1 Note 1 | 58.0 | 43.2 | 71.4 | 37.0 | 33.4 | 40.7 | 41.5 | 37.2 | 45.9 | 26.3 | 25.6 | 27.0 |
| Assault since age 15Data table for textbox 5 Chart 1 Note 2 | 82.3 | 70.1 | 90.2 | 60.9 | 57.3 | 64.5 | 62.4 | 57.8 | 66.8 | 41.4 | 40.6 | 42.2 |
| IPV since age 15Data table for textbox 5 Chart 1 Note 3 | 80.8 | 67.3 | 89.6 | 56.2 | 52.4 | 60.0 | 60.1 | 55.1 | 65.0 | 39.5 | 38.7 | 40.3 |
| Assault in the preceding 12 monthsData table for textbox 5 Chart 1 Note 2 | 28.3 | 16.4 | 44.2 | 10.6 | 7.8 | 14.1 | 13.6 | 11.0 | 16.6 | 5.9 | 5.4 | 6.3 |
| IPV in the preceding 12 monthsData table for textbox 5 Chart 1 Note 3 | 36.7 | 19.8 | 57.7 | 17.3 | 13.8 | 21.6 | 23.7 | 19.1 | 28.9 | 12.6 | 11.9 | 13.3 |
Source: Statistics Canada, Survey on Safety in Public and Private Spaces, 2018. |
||||||||||||
Text box 5 chart 1 end
The picture was similar for more recent victimization, but the differences were even wider. Compared to non-LGBTQ2+ non-Indigenous people, LGBTQ2+ Indigenous people were about three times more likely to have experienced IPV in the 12 months preceding the survey (37% compared to 13% of non-Indigenous non-LGBTQ2+ people), and almost five times more likely to have experienced sexual or physical assault in the 12 months preceding the survey (28% compared to 5.9%).
End of text box 5
Characteristics of violent victimization incidents
In the 2019 GSS, respondents who were victims of criminal acts were asked to provide some information about each of these crimes. However, the sample size prevents analyzing the characteristics of crimes involving Indigenous victims.
As a complement to the GSS, the 2018 SSPPS is another source of data on criminal victimization. Compared with the GSS, the larger sample size may allow for the analysis of some additional information on crimes involving Indigenous victims.Note However, while the GSS collects information on each of the criminal victimization incidents survey respondents experienced, the SSPPS data is limited to the physical and sexual assault that the victim considered to be the most serious in the 12 months preceding the survey.
The following section presents some of the key findings from the SSPPS data on the main characteristics of the most serious sexual or physical assault experienced by Canadians in the 12 months preceding the survey.Note For almost half (46%) of non-Indigenous people and one-third (33%) of Indigenous people, the most serious assault was a sexual assault.Note The characteristics of the crimes exclude assaults by an intimate partner, which were collected through a separate set of questions.
More than one-third of Indigenous victims were injured during the most serious assault they experienced
The SSPPS data indicate that Indigenous victims were more likely than non-Indigenous victims to have been physically injured in the most serious assault. More specifically, more than one-third (36%) of Indigenous victims suffered injuries in the most serious assault they experienced in the 12 months preceding the survey. This proportion was more than double that of non-Indigenous victims (15%). Similarly, nearly one-third (32%) of Indigenous victims reported that their assailant was armed, compared with 13% of non-Indigenous victims (Table 10, Chart 11).
Chart 11 start

Data table for Chart 11
| Selected characteristics of the most serious assault | Indigenous persons | Non-Indigenous personsData table for Chart 11 Note ‡ | ||||
|---|---|---|---|---|---|---|
| percent | 95% confidence interval | percent | 95% confidence interval | |||
| from | to | from | to | |||
| Victim felt blamedData table for Chart 11 Note 1 | 27.8 | 16.5 | 42.9 | 21.5 | 17.9 | 25.5 |
| Victim used victims services | 29.8Note * | 15.7 | 49.2 | 7.7 | 6.0 | 9.8 |
| Crime was reported to police | 39.3Note * | 25.0 | 55.7 | 17.8 | 14.8 | 21.2 |
| Victim suffered injuries | 36.2Note * | 21.7 | 53.7 | 15.0 | 12.3 | 18.3 |
| Offender had a weapon | 32.2Note * | 20.0 | 47.4 | 12.8 | 10.1 | 16.2 |
| Linked to offender's substance use | 46.6 | 31.6 | 62.3 | 35.7 | 31.6 | 40.1 |
| Offender was a manData table for Chart 11 Note 2 | 87.9 | 79.5 | 93.1 | 81.4 | 77.5 | 84.7 |
| Offender was a strangerData table for Chart 11 Note 3 | 31.7 | 20.1 | 46.1 | 45.5 | 41.0 | 50.2 |
| Took place in a private residence | 38.7 | 25.7 | 53.5 | 32.1 | 27.9 | 36.7 |
Source: Statistics Canada, Survey of Safety in Private and Public Spaces, 2018. |
||||||
Chart 11 end
The presence of injuries or weapons may be indicators of the potential level of severity of the assaults. In fact, these are key factors in classifying levels of sexual assault and assaults in the Criminal Code.
Indigenous people are twice as likely as non-Indigenous people to have reported the most serious assault to the police
Among both Indigenous and non-Indigenous people, the majority of assaults identified as the most serious experienced by victims in the 12 months preceding the SSPPS were not reported to the police. However, the most serious assaults on Indigenous people were approximately twice as likely to be brought to the attention of the police either as a result of the victim reporting the incident or otherwise.
Among Indigenous victims, nearly 4 in 10 (39%) assaults were brought to the attention of the police, compared with 18% among non-Indigenous victims. The difference was particularly pronounced among women, with one-third (32%) of Indigenous women and 12% of non-Indigenous women reporting the most serious assault (Table 10, Chart 11). Higher reporting rates may be another indicator of a higher level of severity, as the reporting rate tends to increase with severity (Sinha 2015).
Indigenous people were also more likely to have used victim services. Nearly one-third (30%) of Indigenous victims reported using services following the most serious assault, compared with 7.7% of non-Indigenous victims. Among victims who did not use victim services, the majority (51%) indicated that they did not feel the need to do so, and 29% said that the incident was too minor.Note
Nearly half of Indigenous women felt blamed
The term “secondary victimization” is sometimes used to refer to criticizing victims or making them feel responsible for their own victimization. A lack of support for victims or criticism can lead victims to blame themselves and therefore remain silent rather than confide in others, report the incident or seek help. Victim-blaming can have many negative emotional impacts on victims, such as increased distrust of others, anxiety or depression (Harber et al. 2015).
Nearly half (44%) of Indigenous women who were victims of a violent crime reported feeling blamed for the most serious assault they had experienced in the 12 months preceding the SSPPS. This proportion was more than double that noted among Indigenous men (17%). Among non-Indigenous women, it was rarer for them to feel blamed, with three-quarters (75%) of them reporting that they did not feel criticized or blamed for their most serious assault (Table 10).
Indigenous victims are less likely to have been assaulted by a stranger
Previous studies have shown that Indigenous victims were generally less likely than non-Indigenous victims to have been assaulted by a stranger (Allen 2020; Boyce 2016; Heidinger 2022). This trend was confirmed by the SSPPS data. Slightly less than one-third (32%) of the most serious assaults experienced by Indigenous people in the 12 months preceding the survey, excluding assaults by an intimate partner, were committed by a stranger (Table 10, Chart 11).
In comparison, almost half (46%) of non-Indigenous victims were targeted by a stranger. The difference was particularly pronounced among women, with 19% of Indigenous women having been assaulted by a stranger, compared with 39% of non-Indigenous women.
This difference may be, in part, because a greater proportion of Indigenous people than non-Indigenous people reside in rural or remote areas, where interactions with strangers may be less frequent. Other studies have also shown that crimes committed by strangers are less common in rural areas than in urban areas (Burczycka 2022; Perreault 2020).
Most Indigenous victims were assaulted by a man
Among both Indigenous (88%) and non-Indigenous (81%) people, most victims of a crime committed by a person other than an intimate partner were assaulted by one or more men. However, Indigenous people (6.3%) were less likely than non-Indigenous people (16%) to have been assaulted by one or more women. This difference was particularly pronounced among men, as 6.6% of Indigenous men were assaulted by one or more women, compared with 20% of non-Indigenous men (Table 10).
Indigenous people less likely to have been assaulted in a store or institution than non-Indigenous people
Overall, a relatively large proportion of assaults in 2018 occurred in a commercial or institutional establishment (37%), most often in a restaurant or bar (15% of all victims). However, Indigenous victims were less likely than non-Indigenous victims to have been assaulted in a commercial or institutional establishment (21% compared with 38%). Indigenous men, in particular, were more likely than non-Indigenous men to have been assaulted on the street or in another public place (51% versus 25%) (Table 10).
Indigenous women were more likely than non-Indigenous women to consider that the assault could be related to the assailant’s alcohol or drug use. For example, slightly more than half (52%) of Indigenous women believed that the most serious assault they had experienced could be related to the assailant’s substance use, compared with 29% of non-Indigenous women.
Indigenous victims more likely than non-Indigenous victims to have withdrawn from social activities because of the most serious assault
Among both Indigenous and non-Indigenous people, the vast majority of individuals who had been physically or sexually assaulted in the 12 months preceding the 2018 SSPPS reported having suffered emotional or psychological repercussions because of the most serious assault. However, compared with non-Indigenous victims, Indigenous victims were somewhat less likely to report being little affected (4.1% versus 12%) (Chart 12).
Chart 12 start

Data table for Chart 12
| Type of consequence | Indigenous persons | Non-Indigenous personsData table for Chart 12 Note ‡ | ||||
|---|---|---|---|---|---|---|
| percent | 95% confidence interval | percent | 95% confidence interval | |||
| from | to | from | to | |||
| Emotional consequences | ||||||
| Experienced emotional impacts (total) | 93.1 | 75.7 | 98.3 | 88.5 | 84.9 | 91.4 |
| Angry | 57.0 | 41.2 | 71.4 | 45.5 | 40.7 | 50.4 |
| Annoyed | 55.6 | 40.8 | 69.4 | 42.6 | 37.9 | 47.5 |
| Upset | 49.6 | 34.5 | 64.8 | 43.1 | 38.3 | 47.9 |
| More cautious | 43.8 | 29.9 | 58.7 | 42.5 | 37.9 | 47.3 |
| Hurt, disappointed | 39.2 | 25.7 | 54.6 | 25.4 | 21.4 | 29.9 |
| Shock, disbelief | 36.4 | 22.0 | 53.7 | 32.1 | 27.8 | 36.6 |
| Lack of trust in others | 30.5 | 18.7 | 45.7 | 23.9 | 19.7 | 28.7 |
| Fearful | 29.2 | 17.5 | 44.4 | 24.8 | 20.8 | 29.3 |
| Victimized | 27.7 | 16.3 | 43.0 | 21.9 | 18.0 | 26.4 |
| Depression, anxiety attacks | 23.6 | 12.8 | 39.5 | 9.8 | 7.2 | 13.3 |
| Lower self-esteem | 21.2 | 10.8 | 37.4 | 9.8 | 7.2 | 13.4 |
| Sleeping problems | 15.4 | 6.5 | 32.2 | 8.5 | 6.6 | 10.9 |
| Afraid for children | 14.5 | 5.5 | 32.8 | 6.3 | 4.5 | 8.9 |
| Ashamed, guilty | 11.9 | 4.8 | 26.6 | 12.4 | 9.3 | 16.3 |
| Problems with men or women | 11.1 | 4.1 | 26.8 | 10.5 | 7.4 | 14.5 |
| Not much impact | 4.1Note * | 1.5 | 10.4 | 12.4 | 9.5 | 16.2 |
| Post-Traumatic Stress Disorder symptoms | ||||||
| Possible PTSDData table for Chart 12 Note 1 | 20.7 | 10.5 | 36.9 | 9.5 | 6.8 | 13.2 |
| Feels on guard or was easily startled | 33.6Note * | 21.1 | 49.0 | 18.2 | 14.6 | 22.5 |
| Feels numb or detached from others, activities | 33.5Note * | 20.4 | 49.6 | 16.1 | 12.5 | 20.5 |
| Avoids situations that remind of incident | 23.7 | 13.0 | 39.2 | 17.9 | 14.6 | 21.7 |
| Has nightmares about the incident | 17.7 | 8.3 | 33.8 | 14.6 | 11.1 | 18.8 |
| Changes in behaviour | ||||||
| At least one change in behaviour | 53.9 | 38.7 | 68.4 | 40.3 | 35.6 | 45.2 |
| Avoids certain people | 33.8 | 20.6 | 50.0 | 21.0 | 17.2 | 25.4 |
| Avoids certain places | 33.4 | 21.2 | 48.4 | 20.1 | 16.2 | 24.5 |
| Stays home | 27.9Note * | 16.4 | 43.2 | 9.3 | 6.7 | 12.8 |
| Withdrew from social activities | 23.2Note * | 12.5 | 39.0 | 8.6 | 6.0 | 12.1 |
| Changed the way presented self in public | 21.7 | 11.3 | 37.6 | 11.2 | 8.5 | 14.6 |
| Carries something for self-defense | 14.6 | 6.5 | 29.5 | 7.1 | 4.8 | 10.5 |
Source: Statistics Canada, Survey of Safety in Private and Public Spaces, 2018. |
||||||
Chart 12 end
All should feel free to pursue their activities in safety. Although victims are not responsible for their victimization, some of them nevertheless change their habits or limit their activities to regain a certain sense of safety (Ullman et al. 2018). Some victims may also change their habits to avoid situations that would remind them of the assault (e.g., avoiding the location of the assault). Changes in habits can thus be a certain indicator of the extent of the assault’s impact on the victim. Compared with non-Indigenous victims, Indigenous victims were more likely to have withdrawn from social activities (23% versus 8.6%) or to stay at home more often (28% versus 9.2%) (Chart 12).
Besides emotional repercussions and changes in habits, some victims may suffer long-term consequences consistent with the symptoms of Post-Traumatic Stress Disorder (PTSD). The 2018 SSPPS included four questions designed to assess whether the victim could have PTSD.Note According to these criteria, just over one in five (21%) Indigenous victims could potentially have PTSD because of the most serious assault—that is, they have identified at least three of the four symptoms measured.
Specifically, compared with non-Indigenous victims, Indigenous victims were more likely to feel numb or detached from others or activities (33% versus 16%) or to be constantly on the alert or on guard (34% versus 18%). Research suggests that the combined impacts of multiple lifetime stressors and traumatic experiences are correlated with the development and severity of PTSD symptoms (Bombay et al. 2009; O’Neil et al. 2018; Scott 2007). As such, it is possible that higher levels of PTSD symptoms among Indigenous victims be, at least in part, linked to intergenerational trauma resulting from historical and ongoing repercussions of colonization, systemic and individual racism, as well as childhood abuse experiences.
Indigenous homicide victims
The issue of high homicide rates involving Indigenous victims is a major concern in Canada. Many studies have highlighted the significant disparities between Indigenous and non-Indigenous people in terms of homicide rates. This issue led to the establishment in 2016 of the National Inquiry into MMIWG, whose final report was tabled in 2019 (National Inquiry into Missing and Murdered Indigenous Women and Girls 2019).
Statistics Canada is working with the Canadian police community to improve the quality of data collected on the Indigenous identity of victims and accused individuals. In recent years, this information has been collected through the Homicide Survey, making it possible to better quantify the nature and extent of homicides involving an Indigenous victim and to monitor progress in this matter. The next section presents the main trends in homicides among First Nations people, Métis and Inuit from 2015 to 2020.
For more information on Indigenous homicide victims, see data table 35-10-0156-01 and the Juristat articles “Homicide in Canada, 2020” (Armstrong and Jaffray 2021) and “Homicide in Canada, 2014” (Miladinovic and Mulligan 2015).Note
The homicide rate involving an Indigenous victim reached its highest level since 2015
In 2020, police in Canada reported a total of 201 Indigenous homicide victims. This figure represents a homicide rate of 10.05 per 100,000 inhabitants, the highest rate since 2015. This increase was mainly due to a higher number of murdered Indigenous men than in previous years, with the homicide rate among Indigenous women having declined somewhat in 2020 compared with the previous three years.Note Despite the decline in the homicide rate among Indigenous women, this rate was nearly twice that of non-Indigenous men and more than five times that of non-Indigenous women (Table 11, Chart 13).
Among non-Indigenous people, the homicide rate (1.41 per 100,000 non-Indigenous people in 2019) remained relatively stable, being 5.2% higher than in 2015, but nevertheless lower than the rates recorded in 2017 and 2018.
Chart 13 start
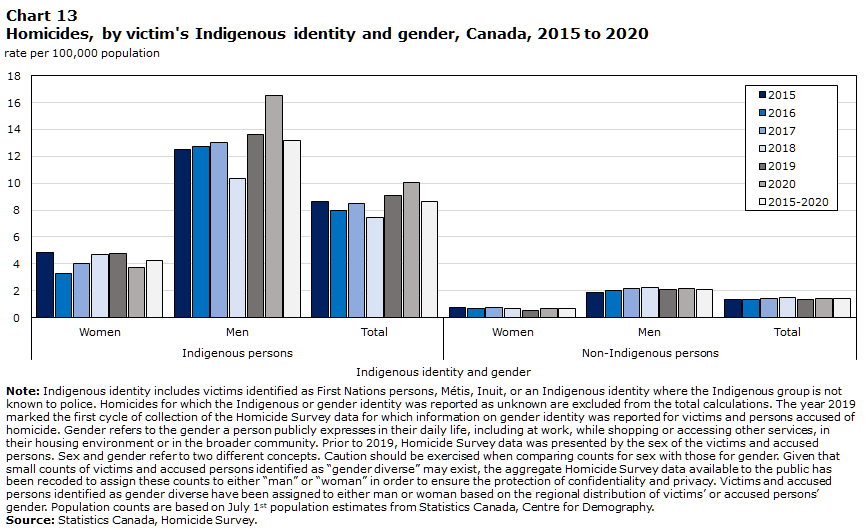
Data table for Chart 13
| Indigenous identity and gender | 2015 | 2016 | 2017 | 2018 | 2019 | 2020 | 2015-2020 |
|---|---|---|---|---|---|---|---|
| rate per 100,000 population | |||||||
| Indigenous persons | |||||||
| Women | 4.87 | 3.29 | 4.05 | 4.67 | 4.76 | 3.76 | 4.23 |
| Men | 12.49 | 12.76 | 13.04 | 10.34 | 13.60 | 16.50 | 13.16 |
| Total | 8.62 | 7.96 | 8.48 | 7.47 | 9.12 | 10.05 | 8.64 |
| Non-Indigenous persons | |||||||
| Women | 0.78 | 0.71 | 0.76 | 0.68 | 0.56 | 0.69 | 0.69 |
| Men | 1.90 | 2.02 | 2.13 | 2.25 | 2.13 | 2.14 | 2.10 |
| Total | 1.34 | 1.36 | 1.44 | 1.46 | 1.34 | 1.41 | 1.39 |
|
Note: Indigenous identity includes victims identified as First Nations persons, Métis, Inuit, or an Indigenous identity where the Indigenous group is not known to police. Homicides for which the Indigenous or gender identity was reported as unknown are excluded from the total calculations. The year 2019 marked the first cycle of collection of the Homicide Survey data for which information on gender identity was reported for victims and persons accused of homicide. Gender refers to the gender a person publicly expresses in their daily life, including at work, while shopping or accessing other services, in their housing environment or in the broader community. Prior to 2019, Homicide Survey data was presented by the sex of the victims and accused persons. Sex and gender refer to two different concepts. Caution should be exercised when comparing counts for sex with those for gender. Given that small counts of victims and accused persons identified as “gender diverse” may exist, the aggregate Homicide Survey data available to the public has been recoded to assign these counts to either “man” or “woman” in order to ensure the protection of confidentiality and privacy. Victims and accused persons identified as gender diverse have been assigned to either man or woman based on the regional distribution of victims’ or accused persons’ gender. Population counts are based on July 1st population estimates from Statistics Canada, Centre for Demography. Source: Statistics Canada, Homicide Survey. |
|||||||
Chart 13 end
To conduct a more detailed analysis of the characteristics of homicides involving an Indigenous victim, particularly by Indigenous group, the data on homicides from 2015 to 2020 were combined. For the rest of this section, analysis will cover the entire period from 2015 to 2020.Note During this period, 69% of Indigenous homicide victims were First Nations people, 5.8% were Métis, 6.7% were Inuit and 18% were identified as Indigenous with an unknown or unspecified identity group.Note
The average homicide rate involving an Indigenous victim for the period from 2015 to 2020 was 8.64 homicides per 100,000 Indigenous people, a rate six times higher than the rate for non-Indigenous people during the same period (1.39). Specifically, the average homicide rates for the period of 2015 to 2020 were 13.16 homicides per 100,000 Indigenous men and 4.23 homicides per 100,000 Indigenous women. Among non-Indigenous people, these rates were 2.09 per 100,000 men and 0.69 per 100,000 women (Chart 13). In other words, while Indigenous people account for about 5% of the population in Canada, they accounted for one-quarter (25%) of homicide victims during this period, both for men and women.
The homicide rate among Indigenous people in Saskatchewan is 13 times higher than the rate among non-Indigenous people
In most provinces, Indigenous people have higher average rates of homicides reported by the police from 2015 to 2020 than non-Indigenous people. The only exceptions were Prince Edward Island, where no Indigenous people were murdered during this period, and Nova Scotia (Chart 14).
Overall, homicide rates among Indigenous people were the lowest in the Atlantic provinces and the highest in the Prairies and the territories. Among the provinces, Saskatchewan had the highest average homicide rate among Indigenous people (17.57 homicides per 100,000 Indigenous people). The largest difference between Indigenous and non-Indigenous people was also noted in Saskatchewan, where the homicide rate among Indigenous people was 13 times higher than among non-Indigenous people (1.38 homicides per 100,000 non-Indigenous people).
The higher homicide rates among Indigenous people contribute to the relatively high homicide rates generally recorded in these provinces. For example, Manitoba and Saskatchewan reported homicide rates more than twice the rate for Canada as a whole in 2020 (Moreau 2021). However, in these provinces, homicide rates among non-Indigenous people were very similar to the national average.
Chart 14 start
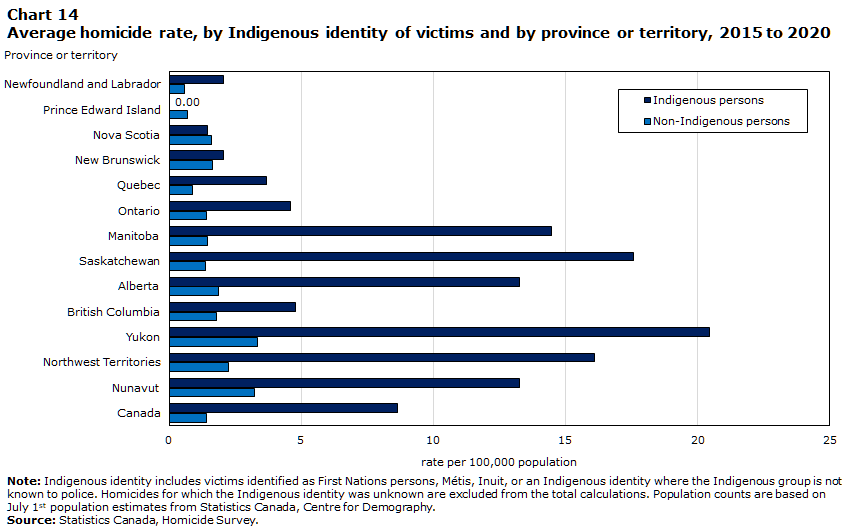
Data table for Chart 14
| Province or territory | Indigenous persons | Non-Indigenous persons |
|---|---|---|
| rate per 100,000 population | ||
| Newfoundland and Labrador | 2.04 | 0.56 |
| Prince Edward Island | 0.00 | 0.68 |
| Nova Scotia | 1.45 | 1.61 |
| New Brunswick | 2.04 | 1.64 |
| Quebec | 3.69 | 0.89 |
| Ontario | 4.60 | 1.42 |
| Manitoba | 14.47 | 1.45 |
| Saskatchewan | 17.57 | 1.38 |
| Alberta | 13.24 | 1.87 |
| British Columbia | 4.76 | 1.78 |
| Yukon | 20.43 | 3.33 |
| Northwest Territories | 16.11 | 2.24 |
| Nunavut | 13.25 | 3.23 |
| Canada | 8.65 | 1.39 |
|
Note: Indigenous identity includes victims identified as First Nations persons, Métis, Inuit, or an Indigenous identity where the Indigenous group is not known to police. Homicides for which the Indigenous identity was unknown are excluded from the total calculations. Population counts are based on July 1st population estimates from Statistics Canada, Centre for Demography. Source: Statistics Canada, Homicide Survey. |
||
Chart 14 end
Yukon had the highest homicide rate among Indigenous people (20.43 homicides per 100,000 Indigenous people). Nunavut was the territory with the lowest homicide rate involving an Indigenous victim (13.25 homicide victims per 100,000 Indigenous people).
Murdered Indigenous women were twice as likely as Indigenous men to have been reported missing
The issue of missing Indigenous women and girls is an important security, justice and policy issue in Canada. To meet the need for information on the subject, the Homicide Survey has included, since 2015, a question to determine whether the homicide victims were previously reported missing.
Just under 1 in 10 (8.1%) Indigenous victims (9.1% of First Nations people, 7.1% of Métis and 7.7% of Inuit) were reported missing before the homicide came to the attention of the police. This proportion was relatively similar among non-Indigenous victims (7.3%) (Table 12).
This proportion was about twice as high among women than among men. Among Indigenous women who were victims of homicide from 2015 to 2020, 32 were reported missing (13%), compared with 47 Indigenous men (6.4%).
Homicides involving an Indigenous victim are more likely to have been cleared than homicides involving a non-Indigenous victim
Overall, homicides involving Indigenous victims from 2015 to 2020 were more likely to have been cleared (solved) than homicides involving non-Indigenous victims.Note More than 8 out of 10 (84%) homicides involving Indigenous victims ( 85% of First Nations people, 80% of Métis and 91% of Inuit) were cleared, either cleared by charge (81%) or otherwise (2.9%).Note This proportion is relatively similar for women (86%) and men (83%) (Table 13).
Homicides involving non-Indigenous victims were less likely to be cleared: 70% were cleared (63% for men, 90% for women), including 62% cleared by charge and 8.0% otherwise. However, in the case of homicides where the victim had previously been reported missing, the clearance rate was similar for Indigenous (67%) and non-Indigenous (68%) victims.
Higher clearance rates for homicides involving Indigenous victims may be due in part to the fact that they are less likely to be committed by strangers or gang-related, which are crimes that are generally more difficult to solve (Hotton Mahony and Turner 2012; Ouimet and Paré 2003; Paré et al. 2007). In fact, homicides of Indigenous victims from 2015 to 2020 were, on average, solved more quickly than homicides involving non-Indigenous victims (82 days versus 45 days). This difference is mainly attributable to homicides that took more than 30 days to solve. These accounted for 21% of cleared homicides where the victim was non-Indigenous, compared with 17% where the victim was Indigenous.
Most victims were killed by someone they knew
Among both Indigenous and non-Indigenous people, homicides committed by strangers are relatively rare, as are homicides involving a randomly chosen victim. Of the homicides reported by the police from 2015 to 2020 for which an accused was identified, less than 1 in 10 (8.8%) Indigenous victims (5.9% of First Nations people, 18% of Métis and 1.8% of Inuit) were killed by a stranger, and 6.0% (4.3% of First Nations people, 9.4% of Métis and 4.7% of Inuit) were randomly selected. Among non-Indigenous victims, these proportions were slightly higher, with 19% being killed by a stranger and 9.2% being randomly selected (Table 12, Table 13). As mentioned earlier, the greater proportion of Indigenous people living in rural areas, where interactions with strangers are less frequent than in urban areas, may partly explain these differences.
Compared with non-Indigenous victims, Indigenous victims were more likely to have been killed by a friend or a friend of the family. This was the case for about one-third (34%) of Indigenous people (36% of First Nations people, 31% of Métis and 29% of Inuit) who were victims of homicides reported by the police from 2015 to 2020, compared with 22% of non-Indigenous victims.
In addition, Indigenous people were more likely to have been killed by an extended family member, such as an uncle or a cousin. Just over 1 in 10 (11%) Indigenous victims (13% of First Nations people, 4.4% of Métis and 16% of Inuit) were killed by an extended family member, compared with 3.2% of non-Indigenous victims.
One in six homicides involving an Indigenous victim was committed by a spouse or intimate partner
Among the homicides reported by the police from 2015 to 2020 for which an accused was identified, about one in six Indigenous victims (16%, or 17% of victims aged 15 and older) was killed by a current or former spouse or intimate partner. This proportion is relatively similar to that of non-Indigenous victims (18%, or 19% of victims aged 15 and older) (Table 13). Overall, Indigenous women (42%, or 47% among those aged 15 and older) and non-Indigenous women (45%, or 49% of those aged 15 and older) who were victims of homicide were much more likely to have been killed by an intimate partner than were Indigenous men (7.1%, or 7.3% among those aged 15 and older) and non-Indigenous men (4.5%, or 4.6% among those aged 15 and older). For more information on homicides of Indigenous women, please refer to the Juristat article “The criminal victimization of First Nations, Métis and Inuit women in Canada” (Heidinger 2022).
The proportion of homicides committed by a spouse or intimate partner also varies by Indigenous identity group. For example, 8.9% of Métis victims (10% of those aged 15 and older) were killed by a spouse or intimate partner. This proportion was 17% for First Nations victims (18% for those aged 15 and older) and 31% for Inuit victims (34% for those aged 15 and older). However, the proportions for the detailed groups are based on a relatively small number of homicides, particularly among Métis and Inuit. As a result, overall trends can vary more easily based on the characteristics of each homicide.
Among those who were killed by a spouse, intimate partner or family member, a history of family violence between the victim and the accused was more common in cases involving an Indigenous, compared to those involving a non-Indigenous, victim. Among Indigenous victims, a history of family violence or intimate partner violence was noted for more than half (53%, 52% of First Nations people, 38% of Métis and 65% of Inuit) of family homicides or those committed by a spouse or intimate partner. Among non-Indigenous victims, 38% involved a reported history of family or intimate partner violence.
Homicides involving an Indigenous victim were less likely to have involved a firearm or to be gang-related
Firearms accounted for the most homicide deaths among non-Indigenous people. From 2015 to 2020, just under half (44%) of homicides involving non-Indigenous victims were committed using a firearm, most often a handgun (60% of homicides by firearm). Among Indigenous people, homicides involving firearms were less common, making up less than one-quarter (23%) of homicides. Among Inuit victims, this proportion decreased to 11%. Likely a reflection of the relatively high proportion of indigenous people living in rural areas, firearm-related homicides involving Indigenous victims have generally been committed with a rifle or hunting rifle (73% of firearm-related homicides), rather than a handgun (15%) (Table 12).
Compared with homicides involving non-Indigenous victims, homicides involving Indigenous victims reported by the police from 2015 to 2020 were also less likely to be linked to criminal activities. Among non-Indigenous people, one-quarter (25%) of homicides were gang-related or suspected of being so. Among Indigenous people, this proportion was almost half (13%) the size. Similarly, among Indigenous people, 15% of homicides were related to the illegal drug business, compared with 28% for non-Indigenous people (Table 13).
The majority of homicides involving an Indigenous victim were not premeditated
The majority of homicides involving Indigenous victims were not related to gangs or criminal activities, nor were they premeditated. In fact, 6 out of 10 (60%) homicides involving Indigenous victims (57% among First Nations people, 61% among Métis and 65% among Inuit) and cleared by police involved the laying of second degree murder charges, and an additional 19% involved manslaughter charges. In comparison, 38% of homicides involving non-Indigenous victims from 2015 to 2020 were not premeditated (i.e., second-degree murder), and 10% were manslaughter (Table 13). These findings are similar to those from a study on crimes reported by the police serving a predominantly Indigenous population (Allen 2020).
Substance use may have been a factor with the lack of premeditation in some cases. In 90% of homicides involving an Indigenous victim, the police noted that the accused had used alcohol or drugs prior to the event. Among homicides involving non-Indigenous victims, this proportion is 62% (Table 13).
Experiences of victimization since the age of 15
In addition to gathering information on experiences of victimization in childhood and in the 12 months preceding the survey, the 2018 SSPPS included questions to measure the extent of violent victimization since the age of 15. Victimization measured by the SSPPS included sexual assault and physical assault, regardless of whether they were committed by an intimate partner.
It should be noted that lifetime victimization is more likely than recent victimization to be underreported, particularly because of memory bias (Desai and Saltzman 2001; Glasner and van der Wander 2007; Sutton 2010; Yoshima and Gillepsie 2002). Measuring it can nonetheless be informative because the experiences that survey respondents remember may have been those that affected them the most. For more information on victimization among Indigenous people since the age of 15, see data table 35-10-0168-01.
Nearly two-thirds of Indigenous people have experienced at least one sexual or physical assault since the age of 15
Similar to what the 2019 GSS data revealed for victimization in the 12 months preceding the survey, the 2018 SSPPS data show that Indigenous people were more likely than non-Indigenous people to have experienced at least one sexual or physical assault since the age of 15. Specifically, this was the case for almost two-thirds (62%) of Indigenous people (61% of First Nations people, 64% of Métis and 51% of Inuit), compared with 42% of non-Indigenous people (Table 3, Table 14).
More precisely, nearly one-third (31%) of Indigenous people (31% of First Nations people, 32% of Métis and 20% of Inuit) have experienced at least one sexual assault since the age of 15, and nearly 6 out of 10 (57%) Indigenous people (57% of First Nations people, 60% of Métis and 48% of Inuit) have experienced at least one physical assault since the age of 15. In comparison, 21% of non-Indigenous people had experienced at least one sexual assault, and 36% had experienced at least one physical assault.
Indigenous people in Newfoundland and Labrador, Quebec, and Nunavut have the lowest rates of victimization since the age of 15
The proportion of Indigenous people who have experienced at least one sexual or physical assault since the age of 15 varies across the country. Across Canada, 62% of Indigenous people have experienced at least one sexual or physical assault since the age of 15. However, this proportion was lower in Newfoundland and Labrador (45%), Quebec (47%) and Nunavut (53%) (Table 14, chart 15).
Chart 15 start

Data table for Chart 15
| Province or territory | Indigenous persons | Non-Indigenous personsData table for Chart 15 Note ‡ | ||||
|---|---|---|---|---|---|---|
| percent | 95% confidence interval | percent | 95% confidence interval | |||
| from | to | from | to | |||
| Newfoundland and Labrador | 45.2Note ** | 33.6 | 57.3 | 35.9Note ** | 33.2 | 38.7 |
| Prince Edward Island | Note F: too unreliable to be published | Note F: too unreliable to be published | Note F: too unreliable to be published | 41.5 | 37.9 | 45.2 |
| Nova Scotia | 59.7Note * | 48.4 | 70.1 | 47.4Note ** | 44.9 | 50.0 |
| New Brunswick | 53.8 | 39.5 | 67.4 | 41.1 | 38.7 | 43.4 |
| Quebec | 46.6Note ** | 35.7 | 57.8 | 35.8Note ** | 34.4 | 37.2 |
| Ontario | 67.2Note * | 57.1 | 76.0 | 42.0 | 40.5 | 43.6 |
| Manitoba | 58.6Note * | 51.1 | 65.8 | 43.3 | 41.1 | 45.4 |
| Saskatchewan | 61.9Note * | 54.3 | 69.0 | 42.8 | 40.9 | 44.7 |
| Alberta | 69.1Note *** | 60.3 | 76.6 | 46.5Note ** | 44.6 | 48.3 |
| British Columbia | 66.4Note * | 56.4 | 75.1 | 46.7 | 45.0 | 48.5 |
| Yukon | 71.8 | 58.1 | 82.4 | 63.6Note ** | 59.2 | 67.7 |
| Northwest Territories | 64.0 | 58.8 | 68.8 | 57.2Note ** | 52.1 | 62.2 |
| Nunavut | 53.5Note *** | 49.6 | 57.2 | 65.3Note ** | 58.8 | 71.2 |
| Canada | 61.6Note * | 58.0 | 64.9 | 41.8 | 41.1 | 42.6 |
F too unreliable to be published
Source: Statistics Canada, Survey of Safety in Private and Public Spaces, 2018. |
||||||
Chart 15 end
Alberta recorded the highest proportion (69%) of Indigenous people who have experienced at least one sexual or physical assault since the age of 15.Note In addition, the largest differences in victimization rates between Indigenous and non-Indigenous people were recorded in Ontario (+25 percentage points among Indigenous people), Alberta (+23 percentage points), British Columbia (+20 percentage points) and Saskatchewan (+19 percentage points).
Indigenous people aged 35 to 44 have the highest victimization rates since the age of 15
Overall, characteristics that were associated with higher victimization rates in 2019 were also associated with higher victimization rates since the age of 15. Similar to findings for recent victimization, Indigenous people aged 35 to 44 had the highest proportion (74%) of victimization since the age of 15 (75% of First Nations people, 75% of Métis and 64% of Inuit). In addition, Indigenous people of all age groups were more likely than their non-Indigenous counterparts to have been victims of at least one sexual assault or physical assault since the age of 15 (Table 15).
As was the case with recent victimization, a history of sexual or physical abuse in childhood, harsh parenting practices and exposure to spousal violence were also closely associated with higher victimization rates since the age of 15. For example, 91% of Indigenous people who had been both sexually and physically assaulted by an adult before the age of 15 have experienced at least one assault since age 15. In comparison, 48% of Indigenous people who had not been assaulted before the age of 15 experienced at least one assault since age 15. Likewise, 84% of Indigenous people (86% of First Nations people, 84% of Métis and 68% of Inuit) who had witnessed spousal violence before the age of 15 also experienced at least one sexual or physical assault since age 15, compared with 54% of Indigenous people who did not witness spousal violence.
Indigenous people with physical or mental disabilities people have higher victimization rates
Recent studies have highlighted higher rates of victimization among people with a disability (Burczycka 2018; Cotter 2018; Savage 2021). Another suggests that rates may be even higher among those who identify with multiple population groups, such as Indigenous women with disabilities (Perreault 2020)
According to SSPPS data, nearly three-quarters (72%) of Indigenous people with physical, cognitive or mental health disabilities (75% of First Nations people, 70% of Métis and 67% of Inuit) have experienced at least one sexual assault since the age of 15, compared with 52% of Indigenous people without disabilities and 54% of non-Indigenous people with disabilities.
A history of criminal victimization is often associated with other social or health issues
Previous studies have shown that criminal victimization is often associated with other social or health issues, such as poor physical or mental health, or drug or alcohol use (Andersen et al. 2014; Cotter 2021; Hughes et al. 2014; Perreault 2015; Perreault 2020). The data from the SSPPS confirm that both Indigenous and non-Indigenous people who have been assaulted at least once since the age of 15 were more likely to report that they are facing or have faced some social or health issues.
For example, nearly one-quarter (23%) of Indigenous people (24% of First Nations people, 23% of Métis and 14% of Inuit) who had experienced at least one assault since the age of 15 considered their mental health to be fair or poor, compared with 11% of Indigenous people who had never been victimized (Table 16).
Similarly, approximately 4 in 10 (41%) Indigenous victims (44% of First Nations people, 38% of Métis and 48% of Inuit who have been victims) have seriously considered suicide, compared with 16% of Indigenous people who have never been victims. Finally, almost one-third (31%) of Indigenous people (34% of First Nations people, 29% of Métis and 40% of Inuit) who have experienced at least one assault reported that their alcohol use has been a source of trouble with people close to them, compared with 7.2% of Indigenous people who had not been victimized.
However, note that these data cannot establish a causal link. It is impossible to determine whether the victimization experiences are the cause of other social or health issues (e.g., using alcohol or drugs to cope with the experiences of violence), whether these issues may contribute to greater exposure to violence, or whether victimization and the other issues simply have common sources.
Indigenous people’s perception of the criminal justice system and safety
Issues related to the fragile bond of trust and sometimes tense relationships between Indigenous people and the police, or, more broadly, Indigenous people’s perceptions of the entire criminal justice system, are well documented (Boyce 2016; Cao 2014; Cotter 2015; Council of Canadian Academies 2019; David 2019; Ibrahim 2020; Nilson and Mantello 2019).
The relationship between Indigenous people and the justice system has been largely defined by colonialism, racism, prejudice, discrimination, and fundamental cultural and societal differences (National Inquiry into Missing and Murdered Indigenous Women and Girls 2019). Therefore, Indigenous people who are in contact with the criminal justice system often face a person, policy, procedure or behaviour that shows little or no sensitivity to them or a lack of understanding of the stories and complexities that characterize police–Indigenous relations (National Inquiry into Missing and Murdered Indigenous Women and Girls 2019). Similarly, the Truth and Reconciliation Commission highlighted how police participation in the residential school system negatively affected Indigenous people’s confidence in them (National Centre for Truth and Reconciliation 2015).
Recently, there has also been much discussion about systemic discrimination and racism in Canada, specifically about police–Indigenous relations (British Columbia 2020; Parliament of Canada 2020). In June 2020, the Commissioner of the Royal Canadian Mounted Police (RCMP) recognized that throughout its history, the police service had not always treated racialized and Indigenous people fairly, and that this is still the case today. At the same time, she called for renewed efforts to make changes regarding this issue (Royal Canadian Mounted Police 2020).
In the 2019 GSS, respondents were asked about their experiences of victimization. The survey also included a set of questions intended to measure public perceptions of the criminal justice system and their sense of safety. The next section presents the main findings of the survey on this issue.
Indigenous people have less confidence in their local police than non-Indigenous people
The 2019 GSS data show that the majority (82%) of Indigenous people in Canada (81% of First Nations people, 85% of Métis and 70%E of Inuit) have at least some confidence in their local police service or RCMP detachment. At the same time, 17% of Indigenous people (19% of First Nations people, 15% of Métis and 29%E of Inuit) reported that they had no or very little confidence in their local police, nearly twice that of non-Indigenous people who held the same view (9.2%) (Table 17). However, the proportions of Indigenous people having little confidence in police may be under-estimated, as those with little confidence in police may also have little confidence in institutions in general, and as such be more reluctant to answer a federal government-led survey.
Across the country, differences between Indigenous and non-Indigenous people in terms of level of confidence in local police were greatest in the territories and in Saskatchewan. Conversely, there was little or no difference between the perceptions of Indigenous and non-Indigenous people in Quebec, Manitoba and Alberta (Chart 16).
Chart 16 start

Data table for Chart 16
| Province or territory | Indigenous persons | Non-Indigenous personsData table for Chart 16 Note ‡ | ||||
|---|---|---|---|---|---|---|
| percent | 95% confidence interval | percent | 95% confidence interval | |||
| from | to | from | to | |||
| Atlantic provinces | 19.6Note * | 10.2 | 34.6 | 7.2Note ** | 6.0 | 8.6 |
| Quebec | 7.2Note E: Use with caution Note ** | 2.5 | 18.9 | 7.3Note ** | 6.0 | 8.9 |
| Ontario | 21.3Note E: Use with caution | 11.4 | 36.4 | 10.1Note ** | 8.9 | 11.5 |
| Manitoba | 16.4Note E: Use with caution | 8.3 | 29.8 | 12.2Note ** | 9.8 | 15.2 |
| Saskatchewan | 26.8Note E: Use with caution Note * | 13.5 | 46.2 | 6.8Note ** | 5.0 | 9.1 |
| Alberta | 13.9Note E: Use with caution | 6.8 | 26.4 | 9.0 | 7.5 | 10.8 |
| British Columbia | Note F: too unreliable to be published | Note F: too unreliable to be published | Note F: too unreliable to be published | 10.5 | 8.8 | 12.6 |
| Yukon | 32.1Note *** | 19.9 | 47.3 | 9.1 | 6.4 | 12.7 |
| Northwest Territories | 24.3Note * | 19.0 | 30.6 | 10.5 | 7.2 | 15.0 |
| Nunavut | 31.4Note *** | 21.7 | 43.1 | 5.0Note ** | 2.5 | 9.9 |
| Canada | 17.5Note * | 13.5 | 22.3 | 9.2 | 8.5 | 9.9 |
|
E use with caution F too unreliable to be published
Source: Statistics Canada, General Social Survey, 2019. |
||||||
Chart 16 end
When they were asked to assess specific aspects of the work of their local police, Indigenous people were more critical about core police duties than non-Indigenous people. That is, Indigenous people were about twice as likely as non-Indigenous people to consider that their local police does a poor job at enforcing the law (10% versus 5.2%), responding quickly to calls (16% versus 7.1%) and ensuring the safety of citizens (11% versus 5.4%).
Nearly half of Indigenous people had contact with the police in 2019
According to 2019 GSS data, Indigenous people were more likely to have been in contact with the police, for any reason, in the 12 months preceding the survey. Specifically, nearly half (45%) of Indigenous people (43% of First Nations people, 50% of Métis and 33%E of Inuit) had contact with the police, compared with 34% of non-Indigenous people (Table 17).
Both among Indigenous and non-Indigenous people, the most common reason given for the contact was in the context of work or volunteering (14% of Indigenous people versus 12% of non-Indigenous people). However, the most significant differences between Indigenous and non-Indigenous people were in relation to witnessing a crime (8.0% versus 4.6%) or for the emotional or substance use problems of a family member (9.9% versus 2.5%) or oneself (2.5% versus 0.6%).
Interacting with the police can impact one’s confidence in them. Overall, respondents who had contact with the police were slightly more likely to say that they had no or very little confidence in their local police (11% compared with 8.5% of those who did not have contact with the police). Among Indigenous people, this difference was particularly pronounced—25% of Indigenous people who had contact with the police said they had no or very little confidence in their local police, compared with 12% of Indigenous people who had no contact.
Nevertheless, the majority (80%) of Indigenous people (76% of First Nations people, and 85% of Métis) who had contact with the police felt that, overall, the experience had been positive, lower than the corresponding proportion (88%) among non-Indigenous people.
For more information on Indigenous people’s perceptions of and interactions with the criminal justice system, see the Juristat article “Perceptions of and experiences with police and the justice system among the Black and Indigenous populations in Canada” (Cotter 2022).
Indigenous people are as satisfied as non-Indigenous people with their personal safety from crime
Overall, most Indigenous people said they were satisfied or very satisfied with their personal safety from crime. Specifically, about three-quarters (76%) of Indigenous people (73% of First Nations people, 78% of Métis and 71%E of Inuit) thought so, a proportion similar to non-Indigenous people (78%). As with non-Indigenous people, Indigenous women were less likely than Indigenous men to be satisfied or very satisfied with their personal safety in general (69% versus 82%) (Chart 17).
Chart 17 start
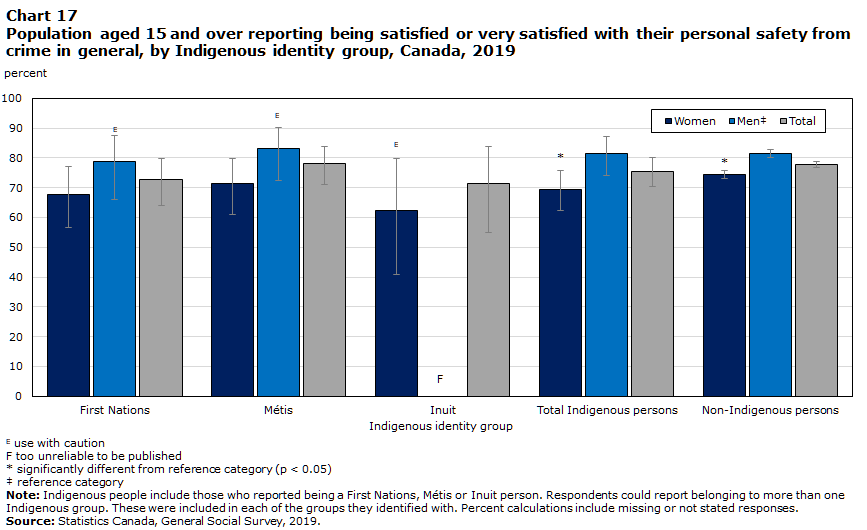
Data table for Chart 17
| Indigenous identity group | Women | MenData table for Chart 17 Note ‡ | Total | ||||||
|---|---|---|---|---|---|---|---|---|---|
| percent | 95% confidence interval | percent | 95% confidence interval | percent | 95% confidence interval | ||||
| from | to | from | to | from | to | ||||
| First Nations | 67.7 | 56.6 | 77.1 | 78.6Note E: Use with caution | 66.1 | 87.4 | 72.7 | 64.1 | 79.8 |
| Métis | 71.3 | 61.1 | 79.7 | 83.2Note E: Use with caution | 72.5 | 90.3 | 78.1 | 71.1 | 83.8 |
| Inuit | 62.4Note E: Use with caution | 40.7 | 80.0 | Note F: too unreliable to be published | Note F: too unreliable to be published | Note F: too unreliable to be published | 71.5 | 55.0 | 83.7 |
| Total Indigenous persons | 69.4Note * | 62.2 | 75.7 | 81.6 | 74.2 | 87.3 | 75.6 | 70.3 | 80.2 |
| Non-Indigenous persons | 74.4Note * | 73.0 | 75.7 | 81.6 | 80.3 | 82.9 | 77.9 | 76.9 | 78.9 |
|
E use with caution F too unreliable to be published
Source: Statistics Canada, General Social Survey, 2019. |
|||||||||
Chart 17 end
When asked about their sense of safety in specific situations, Indigenous people generally had a sense of safety similar to that of non-Indigenous people. For example, 78% of Indigenous people and 80% of non-Indigenous people said they felt safe when walking alone in their neighbourhood after dark. However, a slightly smaller proportion of First Nations people reported the same since 72% said they felt safe in this situation (Table 17).
However, overall, Indigenous people (14%) were somewhat more likely than non-Indigenous people (8.3%) to say that they never walked alone in their neighbourhood after dark. This was particularly true among First Nations people, 17% of whom said that they never walked alone in their neighbourhood after dark. Women also accounted for 88% of all Indigenous people who reported never walking alone after dark.
While there are several reasons other than safety considerations why a person never walks alone after dark, 44%E of Indigenous people and 33% of non-Indigenous peopleNote who said they never walked alone after dark said they would do so if they felt safer.
Summary
Because of the repercussions of colonization and systemic racism—including the experiences of Indigenous residential schools, the child welfare system or as a result of the Sixties Scoop—many Indigenous people continue to cope with intergenerational trauma and sometimes difficult social and economic circumstances, which may be related to violent victimization.
Approximately 4 out of 10 Indigenous people aged 15 and older experienced physical or sexual violence during their childhood. In particular, more than one-quarter (26%) of Indigenous women experienced sexual violence during childhood, compared with 9.2% of non-Indigenous women and 5.8% of Indigenous men. However, the overrepresentation of Indigenous people among victims of childhood violence is declining among younger cohorts. Overall, similar proportions of Indigenous and non-Indigenous people aged 15 to 34 were victims of childhood abuse; these proportions were two times lower than that of Indigenous people aged 55 and older.
Many Indigenous people experienced violence during childhood while under the legal responsibility of the government. More than one-third of those aged 15 and older who experienced violence while they were under the government’s responsibility in Canada were Indigenous. Just over 1 in 10 (11%) Indigenous people aged 15 and older have been under the government’s responsibility, a proportion 10 times higher than that of non-Indigenous people. The severity and frequency of child abuse or neglect could not explain this difference entirely.
Indigenous people were also overrepresented among victims of violent crime in the 12 months preceding the 2019 GSS. Nearly 1 in 10 (8.4%) Indigenous people were victims of a violent crime during that period, compared to 4.2% of non-Indigenous people. Moreover, according to police-reported data from the Homicide survey, the homicide rate for the 2015 to 2020 period was six times higher among Indigenous people (8.64 victims per 100,000 Indigenous people) than non-Indigenous people (1.39 victims per 100,000 non-Indigenous people).
As with childhood victimization, the overrepresentation of Indigenous people among victims of violence in adulthood tends to decline among the younger generations. Indigenous people aged 15 to 24 were victims of violent crime in the 12 months preceding the GSS in a similar proportion to non-Indigenous people of the same age, while Indigenous people aged 35 to 54 were victims in a proportion three times higher than their non-Indigenous counterparts.
More than 1 in 10 (13%) Indigenous people with a current or former intimate partner experienced violence from their partner in the five years preceding the survey, a proportion more than double that of non-Indigenous people (5.7%). Moreover, nearly half of the Indigenous women murdered from 2015 to 2020 had been killed by an intimate partner. Nevertheless, the proportion of Indigenous women who have been victims of spousal violence has been declining in the provinces, from 15%E in 2009 to 7.5% in 2019.
Despite higher victimization rates than non-Indigenous people, the majority of Indigenous people report feeling safe when walking alone in their neighbourhood after dark. However, Indigenous people were slightly more likely to report never walking alone after dark, especially for safety reasons. A majority of Indigenous people also reported that they had confidence in their local police force, but the proportion of those with little or no confidence in the police was higher among non-Indigenous people.
Detailed data tables
Table 11 Homicides, by Indigenous and gender identity and by year, Canada, 2015 to 2020
Surveys descriptions
General Social Survey (GSS) on Canadians’ Safety (Victimization)
In 2019, Statistics Canada conducted the GSS on Victimization for the seventh time. Previous cycles were conducted in 1988, 1993, 1999, 2004, 2009 and 2014. The target population was persons aged 15 and older living in the provinces and territories, except for those living full-time in institutions.
Data collection took place between April 2019 and March 2020. Responses were obtained by computer-assisted telephone interviews (CATI), in-person interviews (in the territories only) and, for the first time, the GSS on Victimization offered a self-administered internet collection option to survey respondents in the provinces and in the territorial capitals. Respondents were able to respond in the official language of their choice.
An individual aged 15 or older was randomly selected within each household to respond to the survey. An oversample of Indigenous people, including those living on-reserve, was added to the 2019 GSS on Victimization to allow for a more detailed analysis of individuals belonging to this population group. In 2019, the final sample size was 22,412 respondents. In 2019, the overall response rate was 37.6%. Non-respondents included people who refused to participate, could not be reached, or could not speak English or French. Respondents in the sample were weighted so that their responses represent the non-institutionalized Canadian population aged 15 and older.
As with any household survey, there are some data limitations. The results are based on a sample and are therefore subject to sampling errors. Somewhat different results might have been obtained if the entire population had been surveyed.
For the quality of estimates, the lower and upper bounds of the confidence intervals are presented in the tables and charts. Confidence intervals should be interpreted as follows: If the survey were repeated many times, then 95% of the time (or 19 times out of 20), the confidence interval would cover the true population value. Throughout this article, unless otherwise specified, statistically significant differences were determined using 95% confidence intervals.
In addition to the confidence intervals, estimates are categorized into quality categories based on unweighted sample size. Estimates falling below the minimum thresholds are marked with the letter F. Further, estimates marked with the letter E have been deemed to be of marginal quality and should be used with caution; such as is the case for all estimates for Inuit persons.
Statistics Canada has confidence in the quality of the data disseminated from the 2019 GSS and assures that the data are fit for use for this analysis. It is important to point out that any significant change in survey methodology can affect the comparability of the data over time. It is impossible to determine with certainty whether, and to what extent, differences in a variable are attributable to an actual change in the population or to changes in the survey methodology. However, there are reasons to believe that the use of an electronic questionnaire might have an impact on the estimations. At every stage of processing, verification and dissemination, considerable effort was made to produce data that are as precise in their level of detail, and to ensure that the published estimates are of good quality in keeping with Statistics Canada standards. However, because of these changes, direct comparison of results from the 2019 GSS to previous iterations are not appropriate.
It should be noted that even when the proportion of respondents who completed the survey online is similar, it is possible that the mode effect is different across different populations.
Survey of Safety in Private and Public Spaces (SSPPS)
In 2018, Statistics Canada conducted the first cycle of the Survey of Safety in Public and Private Spaces (SSPPS). The purpose of the survey is to collect information on Canadians’ experiences in public, at work, online, and in their intimate partner relationships.
The target population for the SSPPS is the population aged 15 and older, living in the provinces and territories, including those living on-reserve. Those residing in institutions are not included. Once a household was contacted, an individual 15 years or older was randomly selected to respond to the survey.
In the provinces, data collection took place from April to December 2018 inclusively. Responses were obtained by self-administered online questionnaire or by interviewer-administered telephone questionnaire. Respondents were able to respond in the official language of their choice. The sample size for the 10 provinces was 43,296 respondents. The response rate in the provinces was 43.1%.
In the territories, data collection took place from July to December 2018 inclusively. Responses were obtained by self-administered online questionnaire or by interviewer-administered in-person questionnaire. Respondents were able to respond in the official language of their choice. The sample size for the 3 territories was 2,597 respondents. The response rate in the territories was 73.2%. Compared to provinces, a greater proportion of the population living in the territories was sampled in order to allow detailed analysis. As such, estimates for Inuit persons may primarily reflect experiences of those living in the territories.
Non-respondents included people who refused to participate, could not be reached, or could not speak English or French. Respondents in the sample were weighted so that their responses represent the non-institutionalized Canadian population aged 15 and older.
As with any household survey, there are some data limitations. The results are based on a sample and are therefore subject to sampling errors. Somewhat different results might have been obtained if the entire population had been surveyed.
For the quality of estimates, the lower and upper bounds of the confidence intervals are presented. Confidence intervals should be interpreted as follows: If the survey were repeated many times, then 95% of the time (or 19 times out of 20), the confidence interval would cover the true population value.
Homicide survey
The Homicide Survey collects police-reported data on the characteristics of all homicide incidents, victims and accused persons in Canada. There are cases where homicides become known to police months or years after they occurred. These incidents are counted in the year in which they become known to police (based on the report date). Information on persons accused of homicide are only available for solved incidents (i.e., where at least one accused has been identified).
Indigenous identity is reported by police to the Homicide Survey and is determined through information found with the victim or accused person, such as status cards, or through information supplied by victims' or accused persons' families, the accused persons themselves, community members, or other sources (i.e., such as band records). Forensic evidence such as genetic testing results may also be an acceptable means of determining the Indigenous identity of victims.
For the purposes of the Homicide Survey, Indigenous identity includes those identified as First Nations persons (either status or non-status), Métis, Inuit, or an Indigenous identity where the Indigenous group is not known to police. Non-Indigenous identity refers to instances where the police have confirmed that a victim or accused person is not identified as an Indigenous person. Indigenous identity reported as 'unknown' by police includes instances where police are unable to determine the Indigenous identity of the victim or accused person, where Indigenous identity is not collected by the police service, or where the accused person has refused to disclose their Indigenous identity to police. The term Indigenous will be used in place of Aboriginal throughout this article.
References
Allen, M. and S. Perreault. 2015, “Police-reported crime in Canada’s Provincial North and Territories, 2013”. Juristat. Statistics Canada Catalogue no. 85-002-X.
Allen. M. 2020. “Crime reported by police serving areas where the majority of the population is Indigenous, 2018”. Juristat. Statistics Canada Catalogue no. 85-002-X.
Andersen, J.P., Hughes, T.L., Zou, C., Wilsnack, S.C. 2014. “Lifetime Victimization and Physical Health Outcomes among Lesbian and Heterosexual Women”. Plos One, 9 (7).
Anderson, T. 2021. Chapter 4: Indigenous youth in Canada. In “Portrait of youth in Canada: Data report”. Statistics Canada Catalogue no. 42-28-0001.
Andersson, N. and A. Nahwegahbow. 2010. “Family violence and the need for prevention research in First Nations, Inuit, and Métis Communities.” Pimatisiwin, 8 (2) 9-33.
Armstrong A. and B. Jaffray. 2021. “Homicide in Canada, 2020”. Juristat. Statistics Canada Catalogue no. 85-002-X.
Assembly of First Nations. 2006. “Leadership Action Plan on First Nations Child Welfare”. Akwesasne, Ontario.
Blackstock, C. 2007. "Residential schools: Did they really close or just morph into child welfare". Indigenous Law Journal, 6(1), 71-78.
Bombay, A., Matheson, K. and H. Anisman. 2009. “Intergenerational Trauma: Convergence of Multiple Processes among First Nations peoples in Canada”. International Journal of Indigenous Health, 5(3), 6-47.
Boyce, J., Rotenberg, C. and M. Karam. 2015. “Mental health and contact with police in Canada, 2012”. Juristat. Statistics Canada Catalogue no. 85-002-X.
Boyce, J. 2016. “Victimization of Aboriginal people in Canada”. Juristat. Statistics Canada Catalogue no. 85-002-X.
British Columbia, 2020. BC Gov News, “Ministers statement on police act reform”, Public safety and solicitor general. (June 12th, 2020)
Brownridge, D., Taillieu, T., Afifi, T., Chan, K., Emery, C., Lavoie, J., and F. Elgar. 2017. “Child maltreatment and intimate partner violence among Indigenous and non-Indigenous Canadians.” Journal of Family Violence,32 (6) 607-619.
Brzozowski, J.-A., Taylor-Butts, A. and S. Johnson. 2006. “Victimization and offending among the Aboriginal population in Canada”. Juristat. Statistics Canada Catalogue no. 85-002-X.
Burczycka, M. 2016. Trends in self-reported spousal violence in Canada, 2014. In “Family violence in Canada: A statistical profile, 2014”. Juristat. Statistics Canada Catalogue no. 85-002-X.
Burczycka, M. 2017. Profile of Canadian adults who experienced childhood maltreatment. In “Family violence in Canada: A statistical profile, 2015”. Juristat. Statistics Canada Catalogue no. 85-002-X.
Burczycka, M. 2018. “Violent victimization of Canadians with mental health-related disabilities, 2014”. Juristat. Statistics Canada Catalogue no. 85-002-X.
Burczycka, M. 2022. “Women’s experiences of victimization in Canada’s remote communities”. Juristat. Statistics Canada Catalogue no. 85-002-X.
Cao, L. 2014. “Aboriginal People and Confidence in the Police”. Canadian journal of criminology and criminal justice, 56 (5), 499-526.
Choate, P., Bear Chief, R., Lindstrom, D. and B. CRAZYBULL. 2021. “Sustaining Cultural Genocide—A Look at Indigenous Children in Non-Indigenous Placement and the Place of Judicial Decision Making—A Canadian Example”. Laws, 10 (3), 59-77.
Conroy, S. 2021. “Spousal violence in Canada, 2019”. Juristat. Statistics Canada Catalogue no. 85-002-X.
Cotter, A. 2015. “Public confidence in public institutions”. Spotlight on Canadians: Results from the General Social Survey. Statistics Canada Catalogue no. 89-652-X.
Cotter, A. 2018. “Violent victimization of women with disabilities, 2014”. Juristat. Statistics Canada Catalogue no. 85-002-X.
Cotter, A. and L. Savage. 2019. “Gender-based violence and unwanted sexual behaviour in Canada, 2018: Initial findings from the Survey of Safety in Public and Private Spaces”. Juristat. Statistics Canada Catalogue no. 85-002-X.
Cotter, A. 2021. “Criminal victimization in Canada, 2019”. Juristat. Statistics Canada Catalogue no. 85-002-X.
Cotter, A. 2022. “Perceptions of and experiences with police and the justice system among the Black and Indigenous populations in Canada”. Juristat. Statistics Canada Catalogue no. 85-002-X.
Council of Canadian Academies. 2019. “Toward Peace, Harmony, and Well-Being: Policing in Indigenous Communities”. The Expert Panel on Policing in Indigenous Communities. Ottawa, Ontario.
David, J.-D., 2019. “Exploration des facteurs associés à la confiance des Autochtones envers la police au Canada : la pertinence du modèle expressif“. Canadian journal of criminology and criminal justice, 61 (4), 120-138.
David, J.-D., and M. Mitchell. 2021. Contacts with the Police and the Over-Representation of Indigenous Peoples in the Canadian Criminal Justice System. Canadian Journal of Criminology and Criminal Justice, 63 (2), 23-45.
Desai, S. and L.E. Saltzman. 2001. “Measurement issues for violence against women“. In C.M. Renzetti, J.L. Edleson and R. Kennedy Bergen (Eds). Sourcebook on Violence Against Women. Thousand Oaks, California.
First Nations Food, Nutrition and Environment Study. 2021. “Key findings and recommendations for decision-makers”. University of Ottawa, Université de Montréal and Assembly of First Nations.
Fitzgerald, Robin T., and Peter J. Carrington. 2008. "The neighbourhood context of urban Aboriginal crime."Canadian Journal of Criminology and Criminal Justice, 50 (5), 523-557.
Glasner, T. and V. van der Wander. 2007. “Applications of calendar instruments in social surveys: A review”. Quality and Quantity, 43, 333-349.
Gorelik, M. 2022. “Discrimination of Aboriginals on Native Lands in Canada”. UN Chronicle. United Nations.
Gravel, M.-A. 2015. “Portrait de la discrimination au Québec”. Coup d’œil sociodémographique, 44. Institut de la statistique du Québec.
Harber, K.D., Podolski, P. and C.H. Williams. 2015. “Emotional disclosure and victim-blaming.” Emotion, 15, 1-12.
Heidinger, L. 2021. “Intimate partner violence: Experiences of First Nations, Métis and Inuit women in Canada, 2018”. Juristat. Statistics Canada Catalogue no. 85-002-X.
Heidinger, L. 2022. “Violent victimization and perceptions of safety: Experiences of First Nations, Métis and Inuit women in Canada”. Juristat. Statistics Canada Catalogue no. 85-002-X.
Hughes, T.L., Johnson, T.P., Steffen, A.D., Wilsnack, S.C. and B. Everett. 2014. “Lifetime victimization, hazardous drinking, and depression among heterosexual and sexual minority women.” LGBT Health, 1 (3).
Hotton Mahony, T. and J. Turner. 2012. “Police-reported clearance rates in Canada, 2010”. Juristat. Statistics Canada Catalogue no. 85-002-X.
Ibrahim, D. 2020. “Public perceptions of the police in Canada’s provinces, 2019”. Juristat. Statistics Canada Catalogue no. 85-002-X.
Indigenous Services Canada. 2019. “Bill C-92: An Act respecting First Nations, Inuit and Métis children, youth and families receives Royal Assent”. News release. June 21st, 2019. Ottawa, Ontario.
Jaffray, B. 2020. “Experiences of violent victimization and unwanted sexual behaviours among gay, lesbian, bisexual and other sexual minority people, and the transgender population, in Canada, 2018.” Juristat. Statistics Canada Catalogue no. 85-002-X.
Lefebvre, R., Fallon, B. Van Wert, M. and J. Filippelli. 2017. “Examining the Relationships between Economic Hardship and Child Maltreatment Using Data from the Ontario Incidence Study of Reported Child Abuse and Neglect-2013 (OIS-2013)”. Behavioral Sciences, 7 (6).
Loeber, R., Farrington, D.P., Hipwell, A.E., Stepp, S.D., Pardini, D., and L. Ahonen. 2015. “Constancy and change in the prevalence and frequency of offending when based on longitudinal self-reports or official records: Comparisons by gender, race and crime type”. Journal of Developmental and Life-Course Criminology, 1 (2), 150-168.
Ma, J., Fallon, B. and K. Richard. 2019. “The overrepresentation of First Nations children and families involved with child welfare: Findings from the Ontario incidence study of reported child abuse and neglect 2013”. Child Abuse & Neglect, 90, 52-65.
Miladinovic, Z. and L. Mulligan. 2015. “Homicide in Canada, 2014”. Juristat. Statistics Canada Catalogue no. 85-002-X.
Moreau, G. 2021. “Police-reported crime statistics in Canada, 2020”. Juristat. Statistics Canada Catalogue no. 85-002-X.
National Centre for Truth and Reconciliation. 2015. “Honouring the truth, reconciling for the future: Summary of the final report of the truth and reconciliation commission of Canada”. Ottawa, Ontario.
National Collaborating Centre for Indigenous Health. 2017a. “Indigenous Children and the Child Welfare System in Canada”. Prince George, British Columbia.
National Collaborating Centre for Indigenous Health. 2017b. “Indigenous Education as a social determinant of First Nations, Inuit and Métis health”. Prince George, British Columbia.
National Collaborating Centre for Indigenous Health. 2017c. “Employment as a social determinant of First Nations, Inuit and Métis health”. Prince George, British Columbia.
National Collaborating Centre for Indigenous Health. 2019. “Access to health services as a social determinant of First Nations, Inuit and Métis health”. Prince George, British Columbia.
National Inquiry into Missing and Murdered Indigenous Women and Girls. 2019. Reclaiming Power and Place: The Final Report of the National Inquiry into Missing and Murdered Indigenous Women and Girls.
Nilson, C. and B. Mantello. 2019. “Joining The Circle – Identifying Key Ingredients for Effective Police Collaboration within Indigenous Communities”. Community Safety Knowledge Alliance, Saskatoon, Saskatchewan.
O’Neil, L., Fraser, T., Kitchenham, A., and V. McDonald. 2018. "Hidden burdens: A review of intergenerational, historical and complex trauma, implications for indigenous families." Journal of Child & Adolescent Trauma, 11 (2), 173-186.
Ouimet M. and P.P. Paré. 2003. "Modéliser la performance: comment analyser les statistiques policières d'élucidation et d'accusation." Revue Internationale de Criminologie et de Police Technique et Scientifique, 56, 23-42.
Paré, P.P., R.B. Felson and M. Ouimet. 2007. "Community variation in crime clearance: A multilevel analysis with comments on assessing police performance." Journal of Quantitative Criminology, 23, 243-258.
Parliament of Canada. 2020. Debates of the Senate. 43rd Parliament, 1st Session. Vol. 151, Issue 27 (June 25, 2020).
Patwardhan, I., Dupong Hurley, K., Thompson R.W., Mason W.A. and J.L. Ringle. 2017. “Child maltreatment as a function of cumulative risk: Findings from the intensive family preservation program”. Child Abuse & Neglect, 70, 92-99.
Paxson, C. and J. Waldfogel. 1999. “Parental resources and child abuse and neglect”. American Economic Review, 89 (2) 239-244.
Perreault, S. 2015. “Criminal victimization in Canada, 2014”. Juristat. Statistics Canada Catalogue no. 85-002-X.
Perreault, S. 2019. “Police-reported crime in rural and urban areas in the Canadian provinces, 2017”. Juristat. Statistics Canada Catalogue no. 85-002-X.
Perreault, S. 2020. “Gender-based violence: Sexual and physical assault in Canada’s territories, 2018”. Juristat. Statistics Canada Catalogue no. 85-002-X.
Polsky, J.Y. and D. Garriguet. 2022. “Household food insecurity in Canada early in the COVID-19 pandemic”. Health Reports. Statistics Canada Catalogue no. 82-003-X.
Prins, A., Ouimette, P., Kimerling, R., Cameron, R.P., Hugleshoffer, D.S., Shaw-Hegwer, J., Thraikill, A., Gusman, F.D. and J.I. Sheikh. 2003. “The Primary Care PTSD screen (PC-PTSD): Development and operating characteristics”, Primary Care Psychiatry, 9 (1).
Public Health Agency of Canada. 2012. "Breaking the links between poverty and violence against women: A resource guide - The reality of poverty and violence". (accessed in June 2022).
Rhineberger-Dunn, G.M., and S.M. Carlson. 2011. "An analysis of the mediating effects of social relations and controls on neighborhood crime victimization."Western Criminology Review, 12.
Rothwell, D., Wegner-Lohin, J., Fast, E., De Boer, K., Trocmé, N., Fallon, B., and T. Esposito. 2018. “Explaining the economic disparity gap in the rate of substantiated child maltreatment in Canada”. Journal of Law and Social Policy, 28.
Royal Canadian Mounted Police. 2020. Statement by Commissioner Brenda Lucki. June 12th, 2020. Ottawa, Ontario.
Sampson, R.J., Raudenbush, S.W., and F. Earls. 1997. "Neighborhoods and violent crime: A multilevel study of collective efficacy."Science, 277 (5328), 918-924.
Savage, L. 2021. Intimate partner violence: Experiences of women with disabilities in Canada, 2018.” Juristat. Statistics Canada Catalogue no. 85-002-X.
Scott, S.T. 2007. "Multiple traumatic experiences and the development of posttraumatic stress disorder." Journal of Interpersonal Violence 22 (7), 932-938.
Siddique, J.A. 2016. “Age, marital status, and risk of sexual victimization: Similarities and differences across victim-offender relationships”. Journal of Interpersonal Violence, 31 (15), 2,556-2,575.
Sinha, V., Trocmé, N., Fallon, B., MacLaurin, B., Fast, E., Prokop, S. T., et al. 2011. « Kiskisik Awasisak: Remember the children. Understanding the overrepresentation of First Nations children in the child welfare system”. Assembly of First Nations, Akwesasne, Ontario.
Sinha, M. 2015. “Trends in reporting criminal victimization to police, 1999 to 2009”. Juristat. Statistics Canada Catalogue no. 85-002-X.
Statistics Canada. 2018. “First Nations people, Métis and Inuit in Canada: Diverse and growing populations”. Statistics Canada Catalogue no. 89-659-X.
Statistics Canada. 2020. “Experiences of discrimination during the COVID-19 pandemic”. The Daily, September 17th, 2020.
Sutton, J. E. 2010. “A review of the life-events calendar method for criminological research”, Journal of Criminal Justice, 38 (5), 1,038-1,044.
Ullman, S., Lorenz, K. and E. O’Callaghan. 2018. “Risk avoidance strategies after sexual assault: A dyadic study of survivors and informal support providers”. Victims and offenders, 13 (6), 814-833.
Ulmer, J. and D. Steffmensmeier. 2014. “The age and crime relationship: Social variation, social explanations”, The Nurture versus biosocial debate in criminology: On the origins of criminal behavior and criminality, Barnes Beaver and Brian Boutwell (Eds). Sage Publications Ltd, London.
Wolfe, D.A., C.V. Crooks, V. Lee, A. McIntyre-Smith and P.G. Jaffe. 2003. “The effects of children’s exposure to domestic violence: A meta-analysis and critique.” Clinical Child and Family Psychology Review, 6 (3) 171-187.
Wood, S.L. and M. Sommers. 2011. “Consequences of intimate partner violence on child witnesses: A systematic review of the literature”. Journal of Child and Adolescent Psychiatric Nursing 24 (4), 223-236.
Yoshima, M. and B. Gillepsie. 2002. “Age-adjustment and recall bias in the analysis of domestic violence data”. Journal of Family Violence, 17 (3), 199-221.
- Date modified: