
Impaired driving in Canada, 2019

Archived Content
Information identified as archived is provided for reference, research or recordkeeping purposes. It is not subject to the Government of Canada Web Standards and has not been altered or updated since it was archived. Please "contact us" to request a format other than those available.
by Samuel Perreault, Canadian Centre for Justice and Community Safety Statistics
Highlights
- The police-reported impaired driving rate increased by 19% in 2019 from 2018, ending a downward trend that began in 2011.
- Many legislative measures to address drug-impaired driving were implemented in 2018. In 2019, police reported 6,453 incidents of drug-impaired driving, representing 8% of all incidents of impaired driving and a 43% increase over 2018. Alcohol-impaired driving, which was also impacted by new legislative measures, increased by 15% in 2019.
- The rate of impaired driving causing death reached its lowest level since data collection began, falling 38% from 2018. By contrast, the rate of impaired driving causing bodily harm rose slightly (+4%).
- Among the provinces, Prince Edward Island, Saskatchewan, and Newfoundland and Labrador posted the highest rates of impaired driving in 2019, while Ontario, Quebec and Manitoba had the lowest rates.
- Among the census metropolitan areas, Moncton, Abbotsford–Mission and Lethbridge saw the highest rates of impaired driving, while Kingston, Toronto and Winnipeg had the lowest rates.
- Alcohol-impaired driving peaks on weekends and late evenings. However, the rate of drug-impaired driving varies little from one time of day to another, as police reported just as many of these incidents between 11:00 a.m. and 3:00 p.m. as between 11:00 p.m. and 3:00 a.m.
- Impaired drivers are most often men and young adults. However, it was among these groups that alcohol-impaired driving decreased the most and drug-impaired driving increased the least.
- Drug-impaired driving incidents rarely led to charges based on new blood concentration limits. In addition, they took longer to be cleared by the police and were less likely to be cleared by charge.
- Cases of drug-impaired driving in criminal court took about twice as long as alcohol-related cases. On average, they required more court appearances and were less likely to result in a guilty finding.
- The COVID-19 pandemic appears to have led to a decline in impaired driving incidents. From March 2020 to February 2021, a sample of police services reported a 14% decrease in impaired operation of a motor vehicle and a 33% decrease in impaired driving causing death or bodily harm from the same period a year earlier.
Impaired driving is a major public safety issue in Canada. Despite significant progress in recent decades, it remains one of the leading criminal causes of death in Canada. According to police-reported data, impaired driving killed as many as 155 people in Canada in 2019 (88 impaired driversNote and 67 other road users) and injured 540.Note By comparison, all other criminal offences causing death excluding homicide resulted in the deaths of 108 people in 2019.
In addition to the human cost, impaired driving has a significant financial cost for Canadian taxpayers, particularly because of the significant police resources it requires and the heavy burden it places on the justice system. Despite a decrease in the number of cases of impaired driving over the last 10 years, it is still the most common offence brought to adult criminal court. Furthermore, a 2013 study for Mothers Against Drunk Driving (MADD) Canada estimated that the total social costs associated with impaired driving were $20.6 billion (Pitel and Solomon 2013).
In 2018, the legalization of recreational cannabis came with concerns about drug-impaired driving. Studies have pointed to a possible, though potentially temporary, increase in drug-impaired driving in U.S. states that have legalized recreational cannabis (Nazif-Munoz et al. 2020; Kamer et al. 2020; Aydelotte et al. 2019; Lane and Hall 2019). In addition, before cannabis became legal, police services in Canada were already stopping an increasing number of drug-impaired drivers (Moreau 2019; Perreault 2016).Note
So, to coincide with legalization, the Government of Canada implemented measures to fight drug-impaired driving. In June 2018, former Bill C-46, An Act to amend the Criminal Code (offences relating to conveyances) and to make consequential amendments to other Acts, received royal assent. Amendments were then made to the sections of the Criminal Code dealing with impaired driving. In particular, police were granted new powers to screen for alcohol and drugs, including the introduction of mandatory alcohol screening. Per se limits (i.e., predetermined blood concentration limits) were established for many drugs, as well as for impaired driving involving a combination of alcohol and drugs (see Text box 2).
Using police-reported data collected through the Uniform Crime Reporting Survey (UCR) and data from the Integrated Criminal Court Survey (ICCS), this Juristat article presents an analysis of major trends in impaired driving in Canada, with a focus on drug-impaired driving. This report was sponsored by the Department of Justice Canada.
Start of text box 1
Text box 1
Definition of impaired driving
The Criminal Code impaired driving offences are as follows:
- 320.14
(1) Everyone
commits an offence who
- (a) operates a conveyance while the person’s ability to operate it is impaired to any degree by alcohol or a drug or by a combination of alcohol and a drug;
- (b) subject to subsection (5), has, within two hours after ceasing to operate a conveyance, a blood alcohol concentration that is equal to or exceeds 80 mg of alcohol in 100 ml of blood;
- (c) subject to subsection (6), has, within two hours after ceasing to operate a conveyance, a blood drug concentration that is equal to or exceeds the blood drug concentration for the drug that is prescribed by regulation; or
- (d) subject to subsection (7), has, within two hours after ceasing to operate a conveyance, a blood alcohol concentration and a blood drug concentration that is equal to or exceeds the blood alcohol concentration and the blood drug concentration for the drugs that are prescribed by regulation for instances where alcohol and that drug are combined.
- 320.15 (1) Everyone commits an offence who, knowing that a demand has been made, fails or refuses to comply, without reasonable excuse, with a demand made under section 320.27 or 320.28 (sections on screening for alcohol or drugs).
Each of these sections is followed by subsections (2) and (3), which create the aggravated offences that involve bodily harm (2) or death (3). Subsection (4) of section 320.14 also creates the offence of “Operation – low blood drug concentration:”
- (4) Subject to subsection (6), everyone commits an offence who has, within two hours after ceasing to operate a conveyance, a blood drug concentration that is equal to or exceeds the blood drug concentration for the drug that is prescribed by regulation but is less than the concentration prescribed for the purposes of paragraph (1)(c).
Provincial and territorial laws
In addition to the provisions of the Criminal Code, provincial and territorial road safety laws outline the suspension of driver’s licences for impaired driving, as well as zero tolerance for young or novice drivers. Most provinces and territories also set out fines for drivers with a high blood alcohol level (generally 50 mg or more of alcohol per 100 ml of blood but less than 80 mg of alcohol per 100 ml of blood) and the possibility of requiring the driver to undergo an evaluation, an education program, or to use an ignition interlock device. In recent decades, provincial and territorial administrative sanctions have become more severe and have been used with increasing frequency (Solomon et al. 2020). A document prepared by the Canadian Centre on Substance Use and Addiction provides a summary of the key measures in place in each province and territory (Canadian Centre on Substance Use and Addiction 2020a).
It should be noted that impaired driving that meets the definitions under provincial law, but not under the Criminal Code, is not included in the data presented in this report.
End of text box 1
Police-reported impaired driving at its highest level in nearly 10 years
In 2019, police services in Canada reported a total of 85,673 incidents of impaired driving, the highest number since 2011 (Table 1). When factoring in population size, this represents a rate of 228 incidents per 100,000 population, an increase of 19% over the previous year and 21% over the low reached in 2017 (Chart 1).
Chart 1 start

Data table for Chart 1
| Year | Rate per 100,000 population |
|---|---|
| 1986 | 577 |
| 1987 | 561 |
| 1988 | 538 |
| 1989 | 529 |
| 1990 | 502 |
| 1991 | 502 |
| 1992 | 467 |
| 1993 | 410 |
| 1994 | 372 |
| 1995 | 349 |
| 1996 | 325 |
| 1997 | 301 |
| 1998 | 291 |
| 1999 | 283 |
| 2000 | 258 |
| 2001 | 267 |
| 2002 | 255 |
| 2003 | 245 |
| 2004 | 252 |
| 2005 | 243 |
| 2006 | 234 |
| 2007 | 241 |
| 2008 | 255 |
| 2009 | 263 |
| 2010 | 257 |
| 2011 | 261 |
| 2012 | 242 |
| 2013 | 221 |
| 2014 | 210 |
| 2015 | 201 |
| 2016 | 197 |
| 2017 | 189 |
| 2018 | 191 |
| 2019 | 228 |
|
Note: The different ways in which police services deal with traffic violations can impact police-reported statistics. Counts are based on the most serious offence in the incident. One incident can involve more than one traffic violation under the Criminal Code. Source: Statistics Canada, Canadian Centre for Justice and Community Safety Statistics, Uniform Crime Reporting Survey. |
|
Chart 1 end
Despite this recent increase, the impaired driving rate remains well below the rate recorded 35 years ago. When collection of comparable data began in 1986, police reported 577 incidents per 100,000 population. Until the early 2000s, this rate declined by an average of 5.5% each year, before stabilizing at about 250 incidents per 100,000 population during the 2000s. The 2010s were marked by another downward trend until 2018, when the most recent amendments to the Criminal Code for impaired driving were enacted.
In 2018, police were granted new powers to screen for alcohol and drugs and new offence categories were created (see Text box 1 and Text box 2). In addition, the Government of Canada invested $161 million over five years to fight drug-impaired driving, particularly to train police officers, increase law enforcement capacity, purchase detection equipment, encourage research and implement awareness campaigns (Public Safety Canada 2020). Many police services, including the Royal Canadian Mounted Police, have made impaired driving one of their organizational priorities (Royal Canadian Mounted Police 2021).
Despite the many deaths caused by impaired driving, most incidents do not have a direct victim. As with most crimes that have no victim, the impaired driving rate reported by police is more likely than many other crimes to vary based on law enforcement practices and police service priorities. So, the increase in 2019 may be caused—at least in part—by better detection by police of impaired driving. In addition, changes to the rules for reporting founded and unfounded incidents may also have influenced the increase in the number of police-reported impaired driving incidents (see Text box 3).
Impaired driving causing death at its lowest level
Incidents of impaired driving causing death or bodily harm are more likely to be brought to the attention of police, because of their more serious nature and the presence of victims.Note For this reason, trends in impaired driving causing death or bodily harm may prove to be better indicators of the actual trend in impaired driving or, at least, of the magnitude of the harm linked to this offence.
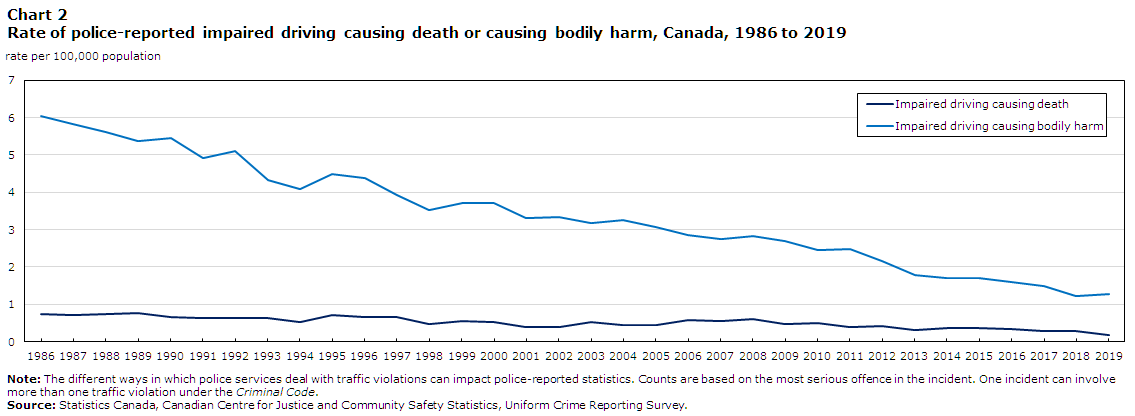
In 2019, police reported 66 incidents of impaired driving causing death, compared with 105 the previous year.Note The former is the lowest number of incidents of impaired driving causing death since comparable data were first collected in 1986. Over this period, the rate of impaired driving causing death fell by more than 60%, from 0.75 incidents per 100,000 population in 1986 to 0.18 incidents per 100,000 in 2019 (Chart 2).
Chart 2 start
Data table for Chart 2
| Year | Impaired driving causing death | Impaired driving causing bodily harm |
|---|---|---|
| rate per 100,000 population | ||
| 1986 | 1 | 6 |
| 1987 | 1 | 6 |
| 1988 | 1 | 6 |
| 1989 | 1 | 5 |
| 1990 | 1 | 5 |
| 1991 | 1 | 5 |
| 1992 | 1 | 5 |
| 1993 | 1 | 4 |
| 1994 | 1 | 4 |
| 1995 | 1 | 4 |
| 1996 | 1 | 4 |
| 1997 | 1 | 4 |
| 1998 | 0 | 4 |
| 1999 | 1 | 4 |
| 2000 | 1 | 4 |
| 2001 | 0 | 3 |
| 2002 | 0 | 3 |
| 2003 | 1 | 3 |
| 2004 | 0 | 3 |
| 2005 | 0 | 3 |
| 2006 | 1 | 3 |
| 2007 | 1 | 3 |
| 2008 | 1 | 3 |
| 2009 | 0 | 3 |
| 2010 | 0 | 2 |
| 2011 | 0 | 2 |
| 2012 | 0 | 2 |
| 2013 | 0 | 2 |
| 2014 | 0 | 2 |
| 2015 | 0 | 2 |
| 2016 | 0 | 2 |
| 2017 | 0 | 1 |
| 2018 | 0 | 1 |
| 2019 | 0 | 1 |
|
Note: The different ways in which police services deal with traffic violations can impact police-reported statistics. Counts are based on the most serious offence in the incident. One incident can involve more than one traffic violation under the Criminal Code. Source: Statistics Canada, Canadian Centre for Justice and Community Safety Statistics, Uniform Crime Reporting Survey. |
||
Chart 2 end
Impaired driving causing bodily harm has also been on a generally downward trend, despite a slight increase from 2018. In 2019, police recorded 483 incidents of impaired driving causing bodily harm, 26 more than the dip in 2018. However, the rate of impaired driving causing bodily harm in 2019 (1.28 incidents per 100,000 population) was half the rate of 10 years earlier and nearly five times lower than in 1986 (6.06 incidents per 100,000 population).
Start of text box 2
Text box 2
History of selected Criminal Code amendments that affect impaired
driving offences
1921: Parliament creates, under the Criminal Code, the summary conviction offence of driving while intoxicated.
1925: The offence of driving while intoxicated by a drug was enacted.
1969: The 1921 offence of driving while intoxicated is repealed. The offence of driving while impaired is retained and “exceeds 80 mg of alcohol in 100 ml of blood” offence and the refusal to provide a breath sample on an approved instrument offence are added by Parliament as summary conviction offences (hybridized in 1975).
1985: The prohibition of operating a vehicle while impaired is extended to aircraft and vessels. The maximum sentence is raised to 14 years where impaired operation causes death, and to 10 years where it causes bodily harm. A mandatory driving prohibition period is introduced and some adjustments are made to penalties.
1999: Driving with a blood alcohol concentration exceeding 160 mg of alcohol per 100 ml of blood becomes an aggravating factor for the purposes of sentencing. A judge can now impose treatment or the use of an ignition interlock device. Driving prohibition periods are increased and the minimum fine for a first impaired-driving offence is raised from $300 to $600.
2000: The maximum penalty for impaired driving causing death is increased to life imprisonment.
2008: The minimum fine for a first offence is raised from $600 to $1,000. The minimum penalty for a second offence goes from 14 days to 30 days and for a subsequent offence, from 90 days to 120 days. Moreover, police are now allowed to perform physical roadside sobriety tests and demand an assessment by an evaluating officer of drivers suspected of drug impairment.
2018: Many amendments concerning impaired driving are made to the Criminal Code in the Act to amend the Criminal Code (offences relating to conveyances) and to make consequential amendments to other Acts S.C. 2018, c. 21 (formerly Bill C-46). Specifically, the following amendments:
- authorize the police to use “approved drug screening equipment” (e.g., saliva drug screeners) at the roadside;
- enact three new offences related to having a blood drug concentration over the predetermined limit within two hours of driving (also known as “per se limits”), including a per se offence involving a combination of alcohol and drugs. Per se limits were established by regulation and are not found in the Criminal Code;
- allow police to demand a breath sample from a driver even if there is no suspicion that driver has alcohol in their body (also called “mandatory alcohol screening”), facilitate the police’s ability to demand a blood sample, and eliminate the requirement that a sample be taken by or under the direct supervision of a physician;
- permit a drug recognition expert to testify without requiring them to be qualified as an expert in every case, consistent with the 2017 Supreme Court of Canada decision in R. v. Bingley.
End of text box 2
Increase in police-reported drug-impaired driving
Although drug-impaired driving has been an indictable offence since 1925, it was relatively difficult to prove until recently. In 2008, new tools were authorized in the Criminal Code to facilitate the investigation of drug-impaired driving. This included the Drug Evaluation and Classification Program and Standardized Field Sobriety Testing (see Text box 3). It was also in 2008 that police-reported data began to differentiate between drug-impaired driving and alcohol-impaired driving. In 2018, the legalization of recreational cannabis raised new concerns about drug-impaired driving. In response to these concerns, the Canadian government implemented a series of legislative measures and made significant investments to address drug-impaired driving, whether it involves cannabis or any other drug (Public Safety Canada 2020).
In 2019, police reported 6,453 drug-impaired driving incidents, for a rate of 17 incidents per 100,000 population (Table 2).Note Although these incidents represent only 8% of all impaired driving incidents, the rate increased by 43% from the previous year and was about four times higher than the rate recorded in 2009 (4.3 incidents per 100,000 population), the first full year for which police-reported data on drug-impaired driving were available. Conversely, the rate of alcohol-impaired driving has fallen by 20%Note since 2009. As a result, from 2009 to 2019, the proportion of drug-impaired driving incidents rose from less than 2% to 8% of all impaired driving incidents (Chart 3).
Chart 3 start

Data table for Chart 3
| Year | Alcohol-impaired drivingData table for chart 3 Note 1 | Drug-impaired drivingData table for chart 3 Note 2 |
|---|---|---|
| Alcohol | Drugs | |
| rate per 100,000 population | ||
| 2009 | 258 | 4 |
| 2010 | 251 | 5 |
| 2011 | 255 | 5 |
| 2012 | 237 | 6 |
| 2013 | 215 | 6 |
| 2014 | 203 | 7 |
| 2015 | 194 | 8 |
| 2016 | 189 | 9 |
| 2017 | 180 | 10 |
| 2018 | 179 | 12 |
| 2019 | 206 | 17 |
Source: Statistics Canada, Canadian Centre for Justice and Community Safety Statistics, Uniform Crime Reporting Survey. |
||
Chart 3 end
The number of incidents of drug-impaired driving causing death or drug-impaired driving causing bodily harm―40 incidents in 2019 for these two offences, combined―has remained relatively stable over the last three years. However, it was roughly double the number reported by police 10 years ago.
Among the new legislative measures enacted in 2018 were the creation a new per se offence that specifically targets driving while impaired by a combination of alcohol and drugs. The quantities of alcohol and drugs in the blood required to constitute a criminal offence are lower than when only one substance is involved. Studies have shown that even in small concentrations, the combination of alcohol and drugs significantly affects driving ability and greatly increases the risk of an accident (Downey et al. 2013; Hartman 2015).
Starting in 2018, police began to record and report incidents of impaired driving involving a combination of alcohol and drugs.Note Before that, most of these incidents were more likely to have been recorded as incidents of alcohol-impaired driving.Note As a result, incidents of impaired driving involving both alcohol and drugs were combined with alcohol-impaired driving incidents in the trend analyses in this report, including in Chart 3. In 2019, police reported 4,618 incidents of impaired driving involving a combination of alcohol and drugs, representing a rate of 12 incidents per 100,000 population. Police also reported 1,784 incidents of impaired driving involving an unspecified substance,Note resulting in a rate of 4.7 incidents per 100,000 population (Table 2).
Given the new legislative measures and the additional methods available to police to detect drug-impaired driving, it is possible that at least some of the observed increase has been caused by improved detection rather than an actual increase in drug-impaired driving. According to the results of the Police Administration Survey, 604 drug recognition experts (DREs) were trained in the 2018/2019 fiscal year, bringing the total number of these experts to just over a thousand. In addition to DREs, during that same period, more than 8,000 police officers completed training or upgrading on the standardized field sobriety test (also known as the “physical coordination test”). So, it appears evident that awareness and the ability of the police to detect drug-impaired driving have quickly evolved in recent years and may partly account for some of the increases observed.
Nevertheless, while the detection capacity has improved, studies have shown that drug-impaired driving is significantly under-detected (Brubacher et al. 2018; Solomon and Chamberlain 2014) and that drugs may be involved as often—or maybe more often—than alcohol in impaired driving incidents (Goldenbeld 2020; Brubacher et al. 2018; Beirness and Beasley 2018; Brown et al. 2017; Minaker et al. 2017). A review conducted by Public Safety Canada determined that available data pointed to an increase in the proportion of drug-impaired driving incidents compared with alcohol-impaired driving incidents (Public Safety Canada 2020).
According to data from the National Cannabis Survey, however, it does not appear that driving under the impairment of cannabis has increased since recreational cannabis was legalized. For the post-legalization period covering the first three quarters of 2019, 13.2% of cannabis users with a driver’s licence reported driving within two hours of use at least once in the three months preceding the survey, a proportion similar to what was observed in the pre-legalization period covering the first three quarters of 2018 (14.2%) (Rotermann 2020). In addition, the results of this survey revealed that the proportion of Canadians who reported being a passenger in a vehicle driven by a person who had used cannabis fell from 5.3% in the pre-legalization period to 4.2% post-legalization. Similar findings were also drawn from the Quebec Cannabis Survey (Institut de la statistique du Québec 2020).
However, these studies only concern cannabis, while police-reported drug-impaired driving data include impairment by any type of drug. Although cannabis is likely common intoxicating substance, it is responsible for only a portion of drug-impaired driving incidents. According to various studies, other drugs, including medications that may affect driving ability, may also be frequently involved (Brubacher et al. 2018; Public Safety Canada 2020; Beirness 2020).
Increase in police-reported alcohol-impaired driving
Most of the new legislative measures put into place in 2018 target drug-impaired driving, but many of them—such as the mandatory alcohol screening and the new per se limit for alcohol and drug-impaired driving—address alcohol-impaired driving. In 2019, police services across Canada reported a rate of 206 alcohol-impaired driving (or impaired driving involving a combination of alcohol and drugs) incidents per 100,000 population, up 15% from the previous year (Chart 3).Note Note
Although this may seem like a small increase compared to the 43% increase noted for drug-impaired driving, it does represent more than 11,000 additional alcohol-impaired driving incidents, while the increase in drug-impaired driving represents about 2,000 additional incidents. As a matter of a fact, despite years of increases in drug-impaired driving, alcohol-impaired driving still represents more than 90% of all police-reported impaired driving, and as such, overall trends in police-reported impaired driving are largely reflective of trends in alcohol-impaired driving.
Prince Edward Island has the highest rate of impaired driving among the provinces
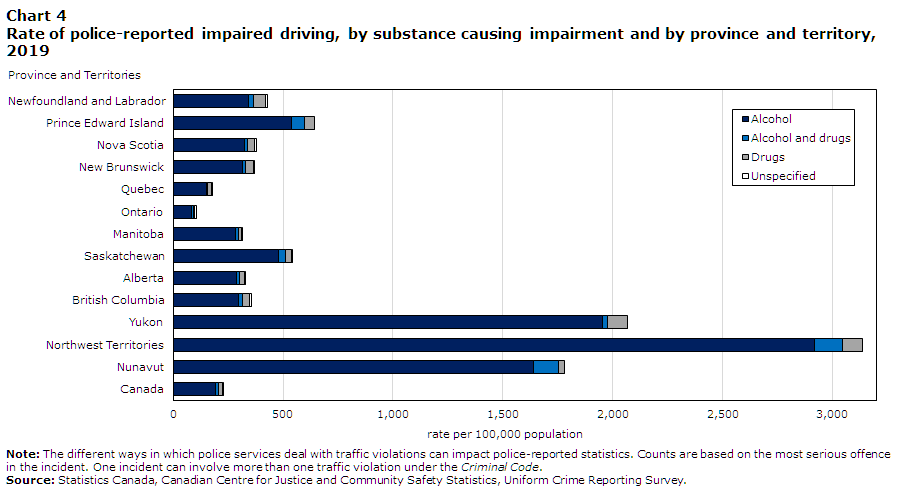
Impaired driving rates vary across the country. In 2019, Prince Edward Island had the highest police-reported rate of impaired driving incidents among the provinces, with 645 incidents per 100,000 population. This was the first time in more than 20 years that a province other than Saskatchewan recorded the highest rate. Saskatchewan posted a rate of 539 incidents per 100,000 population, the second-highest rate among the provinces (Chart 4).
Chart 4 start
Data table for Chart 4
| Province and Territories | Alcohol | Alcohol and drugs | Drugs | Unspecified |
|---|---|---|---|---|
| rate per 100,000 population | ||||
| Newfoundland and Labrador | 341 | 25 | 52 | 12 |
| Prince Edward Island | 536 | 61 | 48 | 0 |
| Nova Scotia | 322 | 17 | 31 | 8 |
| New Brunswick | 316 | 14 | 36 | 1 |
| Quebec | 151 | 7 | 17 | 1 |
| Ontario | 81 | 11 | 6 | 6 |
| Manitoba | 284 | 11 | 13 | 1 |
| Saskatchewan | 479 | 32 | 27 | 1 |
| Alberta | 290 | 12 | 22 | 2 |
| British Columbia | 297 | 16 | 32 | 11 |
| Yukon | 1956 | 22 | 91 | 0 |
| Northwest Territories | 2918 | 132 | 89 | 0 |
| Nunavut | 1640 | 114 | 26 | 0 |
| Canada | 194 | 12 | 17 | 5 |
|
Note: The different ways in which police services deal with traffic violations can impact police-reported statistics. Counts are based on the most serious offence in the incident. One incident can involve more than one traffic violation under the Criminal Code. Source: Statistics Canada, Canadian Centre for Justice and Community Safety Statistics, Uniform Crime Reporting Survey. |
||||
Chart 4 end
Conversely, Ontario had the lowest rate of police-reported impaired driving incidents among the provinces in 2019 (104 per 100,000 population), followed by Quebec (176 incidents per 100,000 population). These provinces were the only ones to post a rate lower than the national average (228 incidents per 100,000 population). However, these differences among the provinces may in part be caused by differences in how police services report impaired driving data (see Text box 3).
All provinces reported an increase in the impaired driving rate in 2019, compared with the previous year. The largest increases were in the Atlantic provinces, where the rate increased by 95% in Newfoundland and Labrador, by 56% in Prince Edward Island and by 53% in New Brunswick. At the other end of the country, British Columbia also recorded a relatively sharp increase, with the impaired driving rate going up 45%. Saskatchewan (+1%), Ontario (+5%) and Quebec (+6%) had the smallest increases. These variations are largely reflective of trends in alcohol-impaired driving - including impaired driving involving a combination of alcohol and drugs – with the exception of Ontario, where both alcohol-impaired and drug-impaired driving went down. Ontario’s overall increase was attributable to a sharp increase in the number of incidents where the impairing substance was unspecified.
Despite these increases, half of the provinces recorded rates that were lower than 10 years prior. In 2019, only the Atlantic provinces and Manitoba had higher rates of impaired driving than in they did in 2009.
In the territories, impaired driving rates were significantly higher than in the provinces. With a rate nearly three times higher than that of Prince Edward Island, Nunavut (1,779 incidents per 100,000 population) had the lowest rate among all territories in 2019. Meanwhile, Yukon and the Northwest Territories reported rates of 2,068 and 3,139 incidents per 100,000 population, respectively (Table 1).
Police-reported impaired driving rates in the territories have significantly increased in recent years, a trend that began well before the new measures implemented in 2018. Compared with the police-reported rates in 2015, rates have increased by 71% in Yukon, by 159% in the Northwest Territories, and by 238% in Nunavut.
Newfoundland and Labrador has the highest drug-impaired driving rate among the provinces
In all provinces, alcohol is still involved in the vast majority of impaired driving incidents reported by police, and alcohol-related incidents are the biggest factor in the differences between the provinces. However, differences between the provinces in drug-impaired driving were also observed.
As with impaired driving as a whole, Ontario (6 incidents per 100,000 population), Manitoba (13) and Quebec (17) posted the lowest rates of drug-impaired driving or impaired driving because of a combination of alcohol and drugs in 2019 (Table 2, Chart 4). By contrast, Newfoundland and Labrador had the highest rate of drug-impaired driving (52 incidents per 100,000 population), followed by Prince Edward Island (48), New Brunswick (36), British Columbia (32) and Nova Scotia (31). These same provinces―with the exception of Prince Edward Island―had some of the highest proportions of cannabis use, as measured by the National Cannabis Survey (Rotermann 2020). However, Prince Edward Island (61 incidents per 100,000 population) and Saskatchewan (32) saw the highest rates of impaired driving due to a combination of alcohol and drugs.
In 2019, all provinces except Ontario (-5%) reported an increase in their rate of drug-impaired driving reported by police compared with the previous year. The largest increase was in British Columbia, where the rate more than doubled. As noted above, this increase may partly be due to better detection; since 2018, police have had additional means to detect and intercept drug-impaired drivers.
Start of text box 3
Text box 3
Changes to the classification of founded incidents in the Uniform Crime Reporting
Survey
In 2018, Statistics Canada, in collaboration with police services, updated the definition of “founded” and “unfounded” criminal incidents to reflect a more victim-centred approach to recording crimes that accounts for the complexities of certain offences, such as sexual assault, family violence and intimate partner violence. The purpose of the changes to these definitions was to begin including incidents where there is no credible evidence that the incident did not take place, as well as those based on reports by third parties (e.g., a road user reporting a potentially impaired driver), in “founded criminal incidents.”
With the new definition, police may clear more incidents as founded. Since official crime statistics reflect “founded” incidents, these changes to the definitions are likely to have had an upward impact on the number of police-reported impaired driving incidents.
Police services are gradually changing their reporting practices based on these new standards, but the progress of this transition can vary from one service to another. Because of this, some of the differences observed between regions may in part be caused by differences in the practices of reporting founded and cleared incidents. The table below shows the proportion of police-reported impaired driving incidents that were not cleared, by province.
| Province or territory | Proportion of incidents not cleared | Percentage point change from 2018 | Percentage point change from 2009 |
|---|---|---|---|
| percent | percentage points | ||
| Newfoundland and Labrador | 69 | 23 | 24 |
| Prince Edward Island | 67 | 12 | 40 |
| Nova Scotia | 44 | 12 | 16 |
| New Brunswick | 57 | 22 | 37 |
| Quebec | 4 | 1 | 1 |
| Ontario | 2 | 0 | 0 |
| Manitoba | 52 | 11 | 25 |
| Saskatchewan | 53 | 2 | 32 |
| Alberta | 46 | 6 | 19 |
| British Columbia | 41 | 28 | 33 |
| Yukon | 76 | 13 | 41 |
| Northwest Territories | 79 | 10 | 56 |
| Nunavut | 80 | 14 | 47 |
| Canada | 33 | 11 | 20 |
|
Note: The different ways in which police services deal with traffic violations can impact police-reported statistics. Counts are based on the most serious offence in the incident. One incident can involve more than one traffic violation under the Criminal Code. Source: Statistics Canada, Canadian Centre for Justice and Community Safety Statistics, Uniform Crime Reporting Survey. |
|||
In addition to changes to the definitions of founded and unfounded incidents, new categories were added to the clearance status of an incident, including “open/still under investigation,” “insufficient evidence to proceed” and “victim/complainant declines to proceed.” Overall, 97% of impaired driving incidents not cleared were so because of insufficient evidence.
End of text box 3
Most census metropolitan areas had a lower rate of impaired driving than the national rate
In 2019, most census metropolitan areas (CMAs)Note recorded impaired driving rates that were lower than the national rate (228 per 100,000 population). Of the 34 CMAs, only Moncton, Abbotsford–Mission, Lethbridge, Vancouver, Victoria, Halifax and Edmonton had an impaired driving rate greater than 228 incidents per 100,000 population (Table 3, Chart 5).
Chart 5 start

Data table for Chart 5
| Census metropolitan areaData table for chart 5 Note 1 Data table for chart 5 Note 2 Data table for chart 5 Note 3 |
Alcohol | Alcohol and drugs | Drugs | Unspecified |
|---|---|---|---|---|
| rate per 100,000 population | ||||
| Moncton | 442 | 21 | 67 | 0 |
| Abbotsford–Mission | 338 | 5 | 17 | 3 |
| Lethbridge | 202 | 12 | 34 | 38 |
| Vancouver | 206 | 10 | 23 | 14 |
| Victoria | 214 | 12 | 22 | 3 |
| Halifax | 214 | 0 | 8 | 15 |
| Edmonton | 204 | 6 | 22 | 2 |
| Canada | 194 | 12 | 17.2 | 4.7 |
| St. John's | 147 | 17 | 32 | 25 |
| Kelowna | 188 | 4 | 24 | 0 |
| Sherbrooke | 167 | 11 | 35 | 2 |
| Saguenay | 188 | 2 | 16 | 1 |
| Saint John | 179 | 3 | 4 | 1 |
| Regina | 152 | 20 | 8 | 3 |
| Trois-Rivières | 156 | 6 | 17 | 0 |
| Saskatoon | 148 | 21 | 8 | 0 |
| Brantford | 138 | 7 | 27 | 4 |
| Québec | 142 | 4 | 19 | 0 |
| Barrie | 128 | 19 | 5 | 12 |
| Thunder BayData table for chart 5 Note 4 | 158 | 0 | 0 | 0 |
| Belleville | 107 | 34 | 4 | 9 |
| GatineauData table for chart 5 Note 5 | 121 | 10 | 13 | 4 |
| Montréal | 118 | 6 | 14 | 0 |
| Peterborough | 109 | 18 | 8 | 3 |
| Calgary | 114 | 4 | 6 | 0 |
| Grand Sudbury | 87 | 25 | 3 | 4 |
| St. Catharines–Niagara | 83 | 13 | 8 | 0 |
| Hamilton | 79 | 6 | 10 | 5 |
| Ottawa–Gatineau | 79 | 7 | 9 | 3 |
| London | 76 | 7 | 10 | 2 |
| Windsor | 80 | 3 | 6 | 2 |
| Guelph | 78 | 1 | 5 | 3 |
| Kitchener–Cambridge–Waterloo | 63 | 2 | 9 | 12 |
| OttawaData table for chart 5 Note 6 | 66 | 6 | 7 | 3 |
| Winnipeg | 68 | 3 | 3 | 1 |
| Toronto | 59 | 3 | 5 | 6 |
| Kingston | 36 | 6 | 2 | 5 |
Source: Statistics Canada, Canadian Centre for Justice and Community Safety Statistics, Uniform Crime Reporting Survey. |
||||
Chart 5 end
With a rate of 529 incidents per 100,000 population, the Moncton CMA had by far the highest rate of police-reported incidents of impaired driving among the CMAs. Abbotsford–Mission was second, with 364 incidents per 100,000 population. The Moncton CMA had both the highest alcohol-impaired driving rate and the highest drug-impaired driving rate. Conversely, Kingston had the lowest rate of impaired driving among CMAs (49 incidents per 100,000 population), followed by Toronto (73), Winnipeg (76) and OttawaNote (82).
A variety of factors may be behind the relatively low rates of impaired driving in the CMAs. In particular, the share of households with a vehicle in CMAs was lower than the share of households outside these areas.Note In addition, the distances to travel in rural areas are generally longer, meaning that impaired drivers are on the road longer and the risk of accidents is higher. The availability of alternative transportation may also be more limited outside CMAs (Canadian Centre on Substance Use and Addiction 2017; Robertson et al. 2016; Paré and Larochelle 2004).
Start of text box 4
Text box 4
Impaired driving during the pandemic
The COVID-19 pandemic brought upheavals that are likely to impact a wide range of social issues, including impaired driving. For example, public health restrictions may cause stress and anxiety in many people, causing them to consume substances (including medication) more often or differently. In addition, alternatives to cars may not be as readily available or people may be reluctant to use them to avoid exposure to the virus (e.g., public transit). Driving conditions may also be different (Canadian Centre on Substance Use and Addiction 2020b).
On the other hand, initial data seem to indicate that overall, there has not been a marked increase in alcohol consumption. The majority of Canadians do not appear to have changed their frequency of consumption, while the proportions of people who either increased or decreased their alcohol consumption are relatively similar (Statistics Canada 2021; Institut national de santé publique du Québec 2020). While stress and boredom were cited as reasons behind an increase in alcohol consumption, fewer opportunities to socialize led many people to consume less.
By contrast, those who increased the frequency of their consumption were more likely to report abuse, i.e., five alcoholic drinks on a single occasion. Cannabis users were also slightly more likely to report an increase in use (Statistics Canada 2021). In addition, most studies found that young adults—the group most at risk of impaired driving—were more likely to have increased their alcohol consumption or drug use since the start of the pandemic (Statistics Canada 2021; Canadian Centre on Substance Use and Addiction 2020c; Institut national de santé publique du Québec 2020).
The Canadian Centre for Justice and Community Safety Statistics at Statistics Canada conducted a special collection of survey data from a sample of police services across Canada to measure the impacts of COVID-19 on selected types of crimes and calls for service, including certain offences related to impaired driving. The police services that responded to this survey serve 71% of the Canadian population.Note
According to the data provided by the police services that responded, impaired driving was reported to have decreased during the pandemic. For the period from March 2020 to February 2021, these police services reported 57,115 incidents of impaired operation,Note down 14% from the same period a year earlier. The decrease was even more pronounced when it came to impaired driving causing death or bodily harm: the number of these incidents reported by the police services participating in the survey fell 33% over the same period (Text box 4 chart). Although alcohol consumption does not appear to have changed significantly during the pandemic, changes in drinking habits—for example, drinking at home instead of at a bar or at a friend’s house—were likely to have decreased the number of impaired drivers on the road.
Text box 4 chart start

Data table for Text box 4 chart
| Month | 2019 | 2020 |
|---|---|---|
| number | ||
| March | 5,492 | 4,247 |
| April | 5,301 | 3,735 |
| May | 5,741 | 5,194 |
| June | 6,534 | 5,823 |
| July | 6,751 | 6,673 |
| August | 6,987 | 6,251 |
| September | 5,579 | 5,533 |
| October | 5,357 | 4,986 |
| November | 5,219 | 4,296 |
| December | 5,336 | 4,110 |
| JanuaryText box table 4 Note 1 | 4,229 | 3,598 |
| FebruaryText box table 4 Note 1 | 4,653 | 3,079 |
Source: Statistics Canada, Special police-reported crime statistics - Special COVID-19 report to Statistics Canada. |
||
Text box 4 chart end
End of text box 4
Just over half of all impaired driving incidents are cleared by charge
Just over half (56%) of impaired driving incidents reported by police in 2019 were cleared by chargeNote (Chart 6). By contrast, 10% of impaired driving incidents were cleared without charge and 33% of incidents were not cleared (i.e., unresolved).
Chart 6 start

Data table for Chart 6
| Impairing substance | |||||
|---|---|---|---|---|---|
| Total impaired driving | Alcohol-impaired driving | Alcohol and drug impaired driving | Drug-impaired driving | Unspecified substance | |
| percent | |||||
| Incidents not cleared | 33 | 31 | 44 | 46 | 35 |
| Incidents cleared by charge | 56 | 57 | 53 | 49 | 64 |
| Incidents cleared otherwise | 10 | 12 | 3 | 5 | 1 |
|
Note: Counts are based on the most serious offence in the incident. One incident can involve more than one traffic violation under the Criminal Code. For an incident to be cleared by charge, at least one accused must have been identified and either a charge has been laid, or recommended to be laid, against this individual in connection with the incident. Source: Statistics Canada, Canadian Centre for Justice and Community Safety Statistics, Uniform Crime Reporting Survey. |
|||||
Chart 6 end
There are several reasons for which an incident of impaired driving may not be cleared. For example, at the time the information about the crime was submitted to Statistics Canada, police may not have completed their investigation (e.g., they may have been awaiting toxicology test results). It is also possible that, in some cases, police may not have sufficient evidence to clear the incident (e.g., when a credible source reports an impaired driver, but the driver could not be stopped).
Further, there are a number of reasons why police may choose not to lay criminal charges against an impaired driver, for example, if different blood alcohol readings give contradictory results, or if police had to interrupt the intervention to respond to a more urgent call. In certain cases, police may choose to deal with the incident under provincial laws. For example, British Columbia adopted amendments to its Motor Vehicle Act in September 2010 that allow for the immediate suspension of the licence of a driver suspected of driving with a blood alcohol level above 80 mg of alcohol per 100 ml of blood. In this province, the proportion of incidents cleared by criminal charges fell from 70% in 2009 to 18% in 2019.
Drug-impaired driving incidents were less likely to be cleared by charge
Incidents of drug-impaired driving and, to a lesser extent, impaired driving from a combination of alcohol and drugs, were slightly less likely to be cleared by charge than alcohol-impaired driving incidents or incidents of driving while impaired by an unspecified substance. To illustrate, in 2019, just under half (49%) of reported incidents of drug-impaired driving were cleared by charge.Note A similar proportion (46%) of incidents was not cleared, and 5% were cleared without charge (Chart 6).
It may be more difficult to detect and prove impairment by drugs than by alcohol. While police are quite familiar with the signs of alcohol consumption, the signs of drug use may be more unfamiliar or harder to detect (Beirness and Porath 2019; Canadian Centre on Substance Use and Addiction 2019).
Police usually have ready access to an approved screening device that can easily detect the presence and concentration of alcohol. However, drug screening devices are still relatively rare. In addition, while recent legislative amendments now permit police officers to demand a roadside breath sample in the absence of suspicion that a driver has alcohol in their body, reasonable suspicion is still required for an officer to demand a roadside sample of oral fluid. Lastly, the availability of evaluating officers can also be an issue, particularly in more remote or isolated regions (Public Safety Canada 2020; Asbridge and Ogilvie 2015).
The proportion of impaired driving incidents cleared by charge decreased in 2019
The proportion of incidents cleared by charge fell in 2019, compared with previous years (Chart 7). Overall, the proportion of incidents cleared by charge decreased from 64% to 56%, a 12% decline compared with 2018. The drop was even more pronounced (-27%) compared with 2009, when 78% of impaired driving incidents were cleared by charge.
This trend was observed for both alcohol-impaired driving and drug-impaired driving, for which rates of clearance by charge fell by 27%Note and 11%, respectively), compared with 2009. In the case of drug-impaired driving, the overall trend prior to 2018 revealed a slow increase in the rate of incidents cleared by charge.
Chart 7 start

Data table for Chart 7
| Year | Cleared by charge (drugs) | Cleared otherwise (drugs) | Clearedby charge (alcohol)Data table for chart 7 Note 1 | Cleared otherwise (alcohol)Data table for chart 7 Note 1 |
|---|---|---|---|---|
| percent | ||||
| 2009 | 55 | 19 | 78 | 9 |
| 2010 | 52 | 22 | 75 | 12 |
| 2011 | 53 | 24 | 68 | 19 |
| 2012 | 58 | 18 | 71 | 14 |
| 2013 | 60 | 16 | 70 | 16 |
| 2014 | 56 | 15 | 70 | 15 |
| 2015 | 60 | 15 | 71 | 14 |
| 2016 | 62 | 13 | 70 | 14 |
| 2017 | 61 | 13 | 67 | 14 |
| 2018 | 61 | 10 | 64 | 14 |
| 2019 | 49 | 5 | 57 | 11 |
Source: Statistics Canada, Canadian Centre for Justice and Community Safety Statistics, Uniform Crime Reporting Survey. |
||||
Chart 7 end
A decline in the proportion of incidents cleared by charge does not, however, translate into an equivalent increase in incidents cleared without charge. The proportion of incidents cleared without charge also fell, from 14% of police-reported impaired driving incidents in 2018 to 10% in 2019.
The decrease in the proportion of incidents either cleared by charge or without charge is mainly because of an increase in the proportion of incidents not cleared, which rose from 22% in 2018 to 33% of all police-reported incidents of impaired driving in 2019. Of these uncleared incidents, the vast majority (97%) could not be cleared because of insufficient evidence. Incidents that were still under investigation when the data were submitted to Statistics Canada represented 2% of impaired driving incidents that were not cleared. Changes to the definitions of founded and unfounded criminal incidents may have led to an increase in the number of uncleared incidents, which could, in large part, account for the decrease in the relative proportion of cleared incidents (see Text box 3).
Drug-impaired driving incidents take longer to be cleared
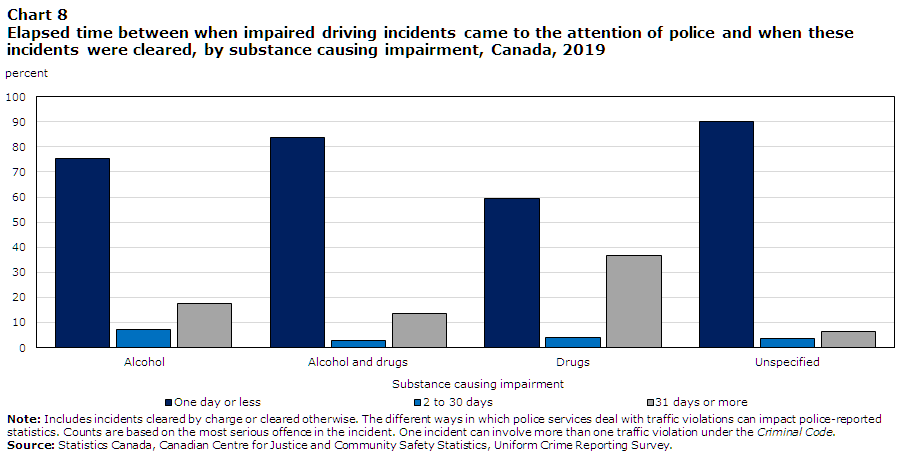
In addition to being slightly less likely to be cleared by charge, drug-impaired driving incidents are more likely to take a longer time to clear. While 76% of incidents of alcohol-impaired driving and 84% of impaired driving involving a combination of alcohol and drugs were cleared in one day or less in 2019, the same was true for the majority (59%) of drug impaired driving incidents (Chart 8).
Chart 8 start
Data table for Chart 8
| Substance causing impairment | ||||
|---|---|---|---|---|
| Alcohol | Alcohol and drugs | Drugs | Unspecified | |
| percent | ||||
| One day or less | 76 | 84 | 59 | 90 |
| 2 to 30 days | 7 | 3 | 4 | 3 |
| 31 days or more | 17 | 14 | 37 | 6 |
|
Note: Includes incidents cleared by charge or cleared otherwise. The different ways in which police services deal with traffic violations can impact police-reported statistics. Counts are based on the most serious offence in the incident. One incident can involve more than one traffic violation under the Criminal Code. Source: Statistics Canada, Canadian Centre for Justice and Community Safety Statistics, Uniform Crime Reporting Survey. |
||||
Chart 8 end
By contrast, nearly 4 in 10 incidents (37%) of drug-impaired driving that were cleared took 31 or more days. By comparison, 17% of alcohol-impaired driving incidents and 14% of impaired driving incidents involving a combination of alcohol and drugs required 31 or more days to be cleared (Chart 8).
The time required to clear certain incidents may be an indicator of their complexity. It is generally accepted that it is harder to detect and prove impairment by drugs than by alcohol (Public Safety Canada 2020; Beirness and Porath 2019; Canadian Centre on Substance Use and Addiction 2019). In addition, police sometimes encounter delays with toxicology tests. The laboratory of the Royal Canadian Mounted Police responsible for conducting toxicology tests saw an increase in funding in order to increase its capacity (Public Safety Canada 2020).
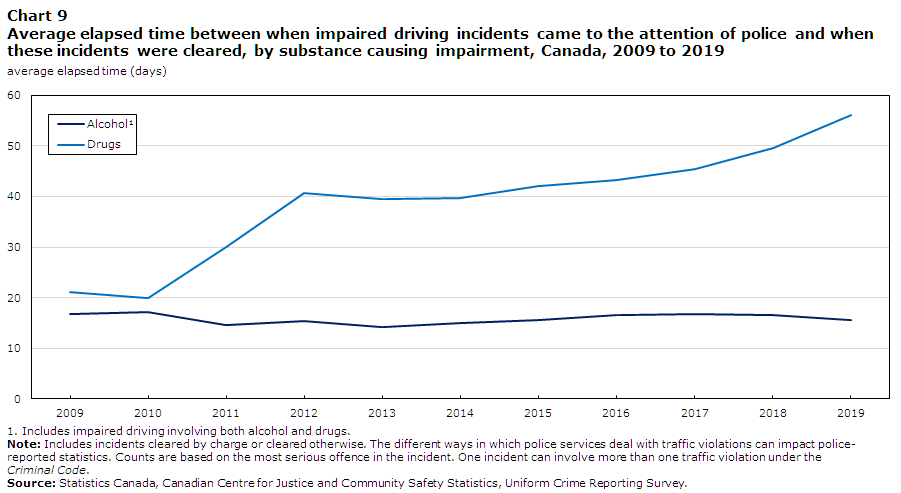
In addition to requiring more time to be cleared than other impaired driving incidents, the length of time required to clear drug-impaired driving incidents has increased since 2009. The average time required to clear a drug-impaired driving incident has nearly tripled since 2009, while it has remained almost unchanged for alcohol-impaired driving (Chart 9). During this period, the proportion of drug-impaired driving incidents that were cleared in one day or less fell from 75% to 59%. Meanwhile, the proportion of incidents that required at least 90 days to clear tripled over the same period, from 10% to 29%.
Chart 9 start
Data table for Chart 9
| Year | AlcoholData table for chart 9 Note 1 | Drugs |
|---|---|---|
| average elapsed time (days) | ||
| 2009 | 16.7 | 21.2 |
| 2010 | 17.1 | 19.9 |
| 2011 | 14.6 | 30.1 |
| 2012 | 15.3 | 40.7 |
| 2013 | 14.2 | 39.4 |
| 2014 | 14.9 | 39.8 |
| 2015 | 15.5 | 42.0 |
| 2016 | 16.5 | 43.3 |
| 2017 | 16.8 | 45.5 |
| 2018 | 16.6 | 49.7 |
| 2019 | 15.6 | 56.2 |
Source: Statistics Canada, Canadian Centre for Justice and Community Safety Statistics, Uniform Crime Reporting Survey. |
||
Chart 9 end
Few charges laid under new per se limits for drug-impaired driving
One of the new legislative measures enacted in 2018 involved the addition of offences to the Criminal Code that established per se limits for certain drugs (see Text box 1 and Text box 2). A per se limit allows charges to be laid without proof of impairment of driving ability being necessary, when it has been established that an amount of an intoxicating substance is present in the body beyond a predetermined limit. A well-known per se limit (80 mg/100 ml of blood, or more commonly .08) has been in force for alcohol since 1969.
However, data from 2019 show that these new provisions were rarely used to lay or recommend charges. In 2019, charges under section 320.14(1)(c) of the Criminal Code—the paragraph dealing with the per se limits of drugs—were laid against about 1 in 6 alleged drug-impaired drivers (17%). This proportion was even lower with respect to section 320.14(1)(d), which deals with the per se limits for impaired driving incidents involving a combination of alcohol and drugs: charges under this section were laid against 1% of drivers accused of impairment by a combination of alcohol and drugs. By comparison, section 320.14(1)(b) on the per se limit for alcohol (80 mg/100 ml of blood) was invoked for 75% of alcohol-impaired drivers (Chart 10).
Chart 10 start

Data table for Chart 10
| Sections of the Criminal Code of Canada (CCC) or Acts under which charges were laidData table for chart 10 Note 1 |
Alcohol | Alcohol and drugs | Drugs |
|---|---|---|---|
| percent | |||
| CCC 320.14 (1)(a) | 68 | 86 | 67 |
| CCC 320.14 (1)(b) | 75 | 24 | 1 |
| CCC 320.14 (1)(c) | 0 | 1 | 17 |
| CCC 320.14 (1)(d) | 0 | 1 | 0 |
| CCC 320.14 (2) (3) | 1 | 0 | 1 |
| CCC 320.14 (4) | 0 | 0 | 0 |
| CCC 320.14 n.s.Data table for chart 10 Note 2 | 0 | 0 | 1 |
| CCC 320.15 | 12 | 25 | 10 |
| CCC - Other traffic violationsData table for chart 10 Note 3 | 8 | 7 | 11 |
| CCC - Other violationsData table for chart 10 Note 4 | 7 | 13 | 17 |
| Legislation specific to drugsData table for chart 10 Note 5 | 1 | 8 | 12 |
| Provincial statuteData table for chart 10 Note 6 | 20 | 20 | 18 |
| Other federal statute | 0 | 0 | 0 |
Source: Statistics Canada, Canadian Centre for Justice and Community Safety Statistics, Uniform Crime Reporting Survey. |
|||
Chart 10 end
The majority (between 67% and 86%, depending on the substance) of impaired drivers were charged under section 320.14(1)(a), the paragraph that deals with impaired driving in general without setting a per se limit. Also, many drug-impaired drivers were charged with a Criminal Code offence other than a traffic violation (17%), a federal drug offence (12%), such as the Cannabis Act, or a provincial offence (18%).
Although charges under per se limits are rare in drug-impaired driving incidents, these charges are likely to become more frequent as detection capabilities are improved and deployed.
Start of text box 5
Text box 5
Drug
Evaluation and Classification Program
The Drug Evaluation and Classification Program (DECP) is a 12-step systematic, standardized procedure used in the United States and Canada to reliably evaluate drug-impaired drivers. In Canada, the DECP was implemented in 2008 along with other legislative amendments to provide new tools to facilitate investigations into drug-impaired driving. From that point on, police could administer a Standardized Field Sobriety Test to drivers suspected of impairment, as well as an evaluation by a drug recognition expert. The latter conduct the DECP evaluation, which provides the results that can be used as evidence of impaired driving.
Along with the legislative amendments to impaired driving in 2018, the government announced an investment of $161 million over five years to address impaired driving, part of which is for police training. During the 2018/2019 fiscal year, 4,725 police officers received training on the physical coordination test, 3,439 completed refresher training, and an additional 604 drug recognition experts were trained (see Text box table).
| Province | Police officers who successfully completed Standardized Field Sobriety Test training | Police officers who successfully completed Standardized Field Sobriety Test refresher training | Police officers who successfully completed Drug Recognition Expert training |
|---|---|---|---|
| number | |||
| Newfoundland and LabradorText box 5 table Note 1 | 50 | 12 | 5 |
| Prince Edward Island | 39 | 5 | 5 |
| Nova Scotia | 31 | 11 | 16 |
| New Brunswick | 119 | 24 | 8 |
| QuebecText box 5 table Note 2 | 438 | 2,282 | 52 |
| OntarioText box 5 table Note 3 | 3,401 | 1,000 | 419 |
| Manitoba | 76 | 6 | 11 |
| Saskatchewan | 33 | 6 | 17 |
| Alberta | 394 | 15 | 47 |
| British Columbia | 144 | 78 | 24 |
| CanadaText box 5 table Note 4 | 4,725 | 3,439 | 604 |
|
|||
End of text box 5
Rate of alcohol-impaired driving among young drivers falls sharply
Most drivers accused of impaired driving are men and young adults. In 2019, men represented 77% of those charged with alcohol-impaired driving or impaired driving involving a combination of alcohol and drugs. However, this proportion has decreased since 2009, when men accounted for 84% of persons charged. In 1986, 92% of persons charged with impaired driving were men.
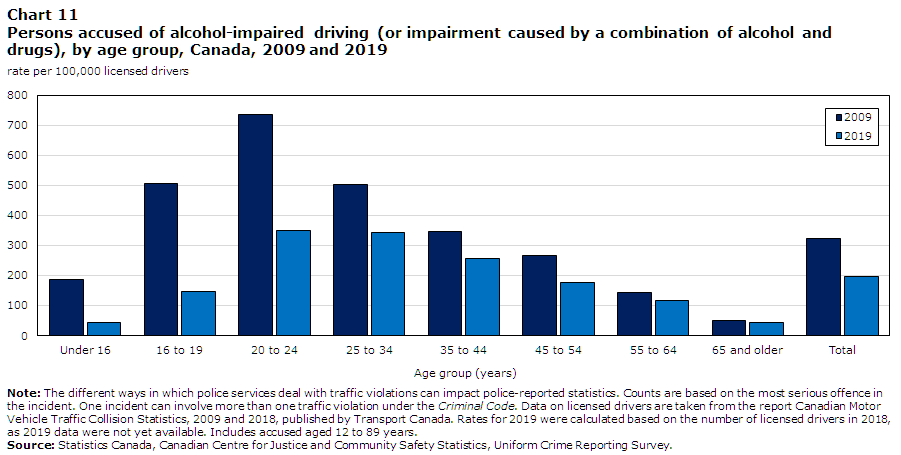
The situation is similar among young drivers. While drivers aged 20 to 34 represent only about a quarter of licensed drivers, in 2019 they accounted for 44% of drivers accused of alcohol impairment or impairment caused by a combination of alcohol and drugs. However, it was among young drivers that the biggest decreases were observed, compared with 2009. Although the rate of alcohol-impaired driving has been falling in all age groups since 2009 (-39% overall), the declines have been the greatest among licensed drivers under 20 years (-71%), and between 20 and 24 years (-53%) (Chart 11).
Chart 11 start
Data table for Chart 11
| Age group (years) | Year | |
|---|---|---|
| 2009 | 2019 | |
| rate per 100,000 licensed drivers | ||
| Under 16 | 186 | 44 |
| 16 to 19 | 505 | 145 |
| 20 to 24 | 738 | 349 |
| 25 to 34 | 502 | 342 |
| 35 to 44 | 346 | 257 |
| 45 to 54 | 267 | 176 |
| 55 to 64 | 142 | 118 |
| 65 and older | 52 | 43 |
| Total | 322 | 195 |
|
Note: The different ways in which police services deal with traffic violations can impact police-reported statistics. Counts are based on the most serious offence in the incident. One incident can involve more than one traffic violation under the Criminal Code. Data on licensed drivers are taken from the report Canadian Motor Vehicle Traffic Collision Statistics, 2009 and 2018, published by Transport Canada. Rates for 2019 were calculated based on the number of licensed drivers in 2018, as 2019 data were not yet available. Includes accused aged 12 to 89 years Source: Statistics Canada, Canadian Centre for Justice and Community Safety Statistics, Uniform Crime Reporting Survey. |
||
Chart 11 end
Awareness campaigns, which often target the groups most at risk, may have contributed to the decrease in impaired driving rates. Moreover, with respect to the declines observed among young drivers, it should be noted that all provinces now have zero tolerance for drinking and driving among young and new drivers (Canadian Centre on Substance Use and Addiction 2020a).
Drug-impaired driving increases in all age groups
The majority of alcohol-impaired drivers are men and young adults, and the same is true for drug-impaired driving. In 2019, men represented 77% of those charged with drug-impaired driving, a proportion nevertheless lower than 81% in 2009.
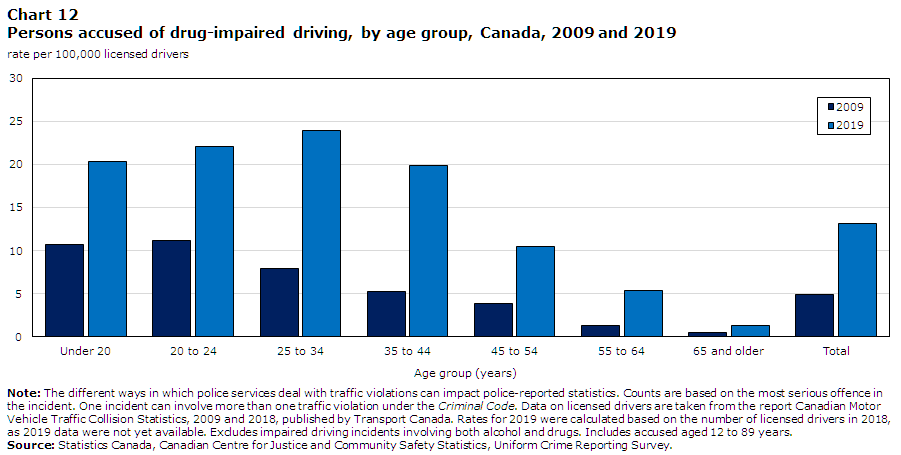
Additionally, young drivers aged 20 to 34 had the highest rates of drug-impaired driving. Although they account for about one-quarter of licensed drivers, they made up just under half (44%) of those accused of drug-impaired driving. These data corroborate the results of the National Cannabis Survey, which indicate that men and young people aged 15 to 24 are more likely to use cannabis than women or older Canadians. Moreover, among cannabis users, men were more likely than women to report driving within two hours of using cannabis. Similarly, young people and men were more likely to report being a passenger in a vehicle driven by a person who had used cannabis (Rotermann 2020).
From 2009 to 2019, the drug-impaired driving rate doubled among drivers aged 20 to 24 (from 11 to 22 incidents per 100,000 licensed drivers) and tripled among those aged 25 to 34 (from 8 to 24 incidents per 100,000 licensed drivers) (Chart 12). However, the rate of drug-impaired driving increased in all age groups, with the largest increases observed among drivers aged 35 to 44 (+281%) and 55 to 64 (+292%).
Chart 12 start
Data table for Chart 12
| Age group (years) | Year | |
|---|---|---|
| 2009 | 2019 | |
| rate per 100,000 licensed drivers | ||
| Under 20 | 11 | 20 |
| 20 to 24 | 11 | 22 |
| 25 to 34 | 8 | 24 |
| 35 to 44 | 5 | 20 |
| 45 to 54 | 4 | 10 |
| 55 to 64 | 1 | 5 |
| 65 and older | 1 | 1 |
| Total | 5 | 13 |
|
Note: The different ways in which police services deal with traffic violations can impact police-reported statistics. Counts are based on the most serious offence in the incident. One incident can involve more than one traffic violation under the Criminal Code. Data on licensed drivers are taken from the report Canadian Motor Vehicle Traffic Collision Statistics, 2009 and 2018, published by Transport Canada. Rates for 2019 were calculated based on the number of licensed drivers in 2018, as 2019 data were not yet available. Excludes impaired driving incidents involving both alcohol and drugs. Includes accused aged 12 to 89 years. Source: Statistics Canada, Canadian Centre for Justice and Community Safety Statistics, Uniform Crime Reporting Survey. |
||
Chart 12 end
Conversely, the smallest increase was noted among drivers under the age of 20 (+90%). Most provinces expanded their zero-tolerance policy for young and new drivers to include drugs. In addition, a significant portion of the preventive measures brought in with the legalization of cannabis was directed at social media-based awareness campaigns and education campaigns in high schools (Public Safety Canada 2020).
Alcohol-impaired driving peaks at night on weekends, but not drug-impaired driving
The number of alcohol-impaired driving incidents peaks on weekends between 2:00 a.m. and 3:00 a.m. In 2019, close to half (44%) of incidents of alcohol-impaired driving occurred on a Saturday or Sunday and nearly one-third (32%) occurred between 11:00 p.m. and 3:00 a.m., regardless of the day (Chart 13).
Chart 13 start

Data table for Chart 13
| Alcohol | Drugs | Alcohol and drugs | ||
|---|---|---|---|---|
| percent | ||||
| Monday | 12 a.m. | 0.8 | 0.5 | 0.8 |
| 1 a.m. | 0.6 | 0.5 | 0.7 | |
| 2 a.m. | 0.6 | 0.4 | 0.6 | |
| 3 a.m. | 0.4 | 0.4 | 0.2 | |
| 4 a.m. | 0.2 | 0.3 | 0.3 | |
| 5 a.m. | 0.1 | 0.2 | 0.1 | |
| 6 a.m. | 0.1 | 0.3 | 0.2 | |
| 7 a.m. | 0.1 | 0.4 | 0.2 | |
| 8 a.m. | 0.1 | 0.4 | 0.2 | |
| 9 a.m. | 0.2 | 0.4 | 0.2 | |
| 10 a.m. | 0.2 | 0.4 | 0.3 | |
| 11 a.m. | 0.2 | 0.6 | 0.2 | |
| 12 p.m. | 0.2 | 0.8 | 0.4 | |
| 1 p.m. | 0.3 | 0.5 | 0.4 | |
| 2 p.m. | 0.3 | 0.5 | 0.6 | |
| 3 p.m. | 0.4 | 0.8 | 0.6 | |
| 4 p.m. | 0.5 | 0.8 | 0.6 | |
| 5 p.m. | 0.5 | 0.6 | 0.6 | |
| 6 p.m. | 0.5 | 0.6 | 0.6 | |
| 7 p.m. | 0.5 | 0.5 | 0.6 | |
| 8 p.m. | 0.6 | 0.8 | 0.9 | |
| 9 p.m. | 0.7 | 0.7 | 0.8 | |
| 10 p.m. | 0.6 | 0.6 | 0.7 | |
| 11 p.m. | 0.6 | 0.7 | 0.6 | |
| Tuesday | 12:00 a.m. | 0.6 | 0.3 | 0.6 |
| 1 a.m. | 0.6 | 0.5 | 0.6 | |
| 2 a.m. | 0.5 | 0.3 | 0.3 | |
| 3 a.m. | 0.4 | 0.3 | 0.4 | |
| 4 a.m. | 0.2 | 0.2 | 0.2 | |
| 5 a.m. | 0.1 | 0.1 | 0.1 | |
| 6 a.m. | 0.1 | 0.3 | 0.1 | |
| 7 a.m. | 0.1 | 0.2 | 0.3 | |
| 8 a.m. | 0.1 | 0.5 | 0.2 | |
| 9 a.m. | 0.1 | 0.4 | 0.3 | |
| 10 a.m. | 0.2 | 0.4 | 0.3 | |
| 11 a.m. | 0.2 | 0.7 | 0.2 | |
| 12 p.m. | 0.2 | 0.5 | 0.3 | |
| 1 p.m. | 0.3 | 0.8 | 0.4 | |
| 2 p.m. | 0.3 | 0.5 | 0.4 | |
| 3 p.m. | 0.4 | 0.8 | 0.5 | |
| 4 p.m. | 0.4 | 0.9 | 0.8 | |
| 5 p.m. | 0.5 | 0.8 | 0.7 | |
| 6 p.m. | 0.5 | 0.6 | 0.7 | |
| 7 p.m. | 0.6 | 0.6 | 0.6 | |
| 8 p.m. | 0.7 | 0.6 | 0.7 | |
| 9 p.m. | 0.7 | 0.7 | 0.8 | |
| 10 p.m. | 0.7 | 0.7 | 0.8 | |
| 11 p.m. | 0.7 | 0.5 | 0.7 | |
| Wednesday | 12 a.m. | 0.6 | 0.5 | 0.6 |
| 1 a.m. | 0.6 | 0.5 | 0.4 | |
| 2 a.m. | 0.5 | 0.4 | 0.5 | |
| 3 a.m. | 0.3 | 0.3 | 0.3 | |
| 4 a.m. | 0.2 | 0.3 | 0.1 | |
| 5 a.m. | 0.1 | 0.2 | 0.1 | |
| 6 a.m. | 0.1 | 0.2 | 0.1 | |
| 7 a.m. | 0.1 | 0.5 | 0.3 | |
| 8 a.m. | 0.1 | 0.6 | 0.3 | |
| 9 a.m. | 0.2 | 0.4 | 0.1 | |
| 10 a.m. | 0.2 | 0.4 | 0.4 | |
| 11 a.m. | 0.2 | 0.5 | 0.3 | |
| 12 p.m. | 0.2 | 0.9 | 0.4 | |
| 1 p.m. | 0.3 | 0.5 | 0.4 | |
| 2 p.m. | 0.3 | 0.9 | 0.6 | |
| 3 p.m. | 0.4 | 0.6 | 0.4 | |
| 4 p.m. | 0.4 | 1.0 | 0.6 | |
| 5 p.m. | 0.5 | 0.9 | 0.5 | |
| 6 p.m. | 0.5 | 0.6 | 0.7 | |
| 7 p.m. | 0.6 | 0.8 | 0.7 | |
| 8 p.m. | 0.7 | 0.6 | 0.8 | |
| 9 p.m. | 0.8 | 0.6 | 0.7 | |
| 10 p.m. | 0.8 | 0.7 | 0.8 | |
| 11 p.m. | 0.8 | 0.8 | 0.8 | |
| Thursday | 12 a.m. | 0.8 | 0.6 | 0.5 |
| 1 a.m. | 0.7 | 0.7 | 0.6 | |
| 2 a.m. | 0.7 | 0.5 | 0.6 | |
| 3 a.m. | 0.5 | 0.3 | 0.5 | |
| 4 a.m. | 0.2 | 0.2 | 0.3 | |
| 5 a.m. | 0.1 | 0.2 | 0.2 | |
| 6 a.m. | 0.1 | 0.2 | 0.2 | |
| 7 a.m. | 0.1 | 0.4 | 0.2 | |
| 8 a.m. | 0.1 | 0.6 | 0.2 | |
| 9 a.m. | 0.2 | 0.5 | 0.4 | |
| 10 a.m. | 0.2 | 0.7 | 0.4 | |
| 11 a.m. | 0.2 | 0.7 | 0.4 | |
| 12 p.m. | 0.2 | 0.7 | 0.4 | |
| 1 p.m. | 0.3 | 0.7 | 0.6 | |
| 2 p.m. | 0.3 | 0.8 | 0.5 | |
| 3 p.m. | 0.5 | 0.9 | 0.6 | |
| 4 p.m. | 0.5 | 0.8 | 0.6 | |
| 5 p.m. | 0.6 | 0.9 | 0.8 | |
| 6 p.m. | 0.6 | 0.8 | 0.6 | |
| 7 p.m. | 0.7 | 0.7 | 0.8 | |
| 8 p.m. | 0.8 | 0.7 | 0.9 | |
| 9 p.m. | 0.9 | 0.8 | 1.1 | |
| 10 p.m. | 1.0 | 0.8 | 0.9 | |
| 11 p.m. | 1.1 | 0.5 | 0.9 | |
| Friday | 12 a.m. | 1.0 | 0.5 | 0.8 |
| 1 a.m. | 1.1 | 0.5 | 0.8 | |
| 2 a.m. | 1.0 | 0.3 | 0.9 | |
| 3 a.m. | 0.8 | 0.5 | 0.5 | |
| 4 a.m. | 0.3 | 0.1 | 0.3 | |
| 5 a.m. | 0.2 | 0.2 | 0.3 | |
| 6 a.m. | 0.2 | 0.3 | 0.3 | |
| 7 a.m. | 0.1 | 0.3 | 0.3 | |
| 8 a.m. | 0.1 | 0.5 | 0.2 | |
| 9 a.m. | 0.2 | 0.4 | 0.3 | |
| 10 a.m. | 0.2 | 0.7 | 0.4 | |
| 11 a.m. | 0.2 | 0.6 | 0.3 | |
| 12 p.m. | 0.3 | 0.7 | 0.3 | |
| 1 p.m. | 0.3 | 0.7 | 0.5 | |
| 2 p.m. | 0.4 | 0.7 | 0.5 | |
| 3 p.m. | 0.5 | 0.9 | 0.8 | |
| 4 p.m. | 0.6 | 1.0 | 0.8 | |
| 5 p.m. | 0.7 | 0.8 | 0.8 | |
| 6 p.m. | 0.8 | 0.7 | 1.0 | |
| 7 p.m. | 0.9 | 0.9 | 1.0 | |
| 8 p.m. | 1.2 | 1.0 | 1.1 | |
| 9 p.m. | 1.4 | 0.9 | 1.1 | |
| 10 p.m. | 1.7 | 1.0 | 1.4 | |
| 11 p.m. | 1.8 | 1.2 | 1.3 | |
| Saturday | 12 a.m. | 2.0 | 0.9 | 1.4 |
| 1 a.m. | 2.4 | 0.7 | 1.6 | |
| 2 a.m. | 2.5 | 0.8 | 1.6 | |
| 3 a.m. | 1.9 | 0.7 | 1.6 | |
| 4 a.m. | 0.9 | 0.5 | 0.7 | |
| 5 a.m. | 0.5 | 0.4 | 0.6 | |
| 6 a.m. | 0.3 | 0.3 | 0.2 | |
| 7 a.m. | 0.3 | 0.4 | 0.3 | |
| 8 a.m. | 0.3 | 0.4 | 0.6 | |
| 9 a.m. | 0.3 | 0.6 | 0.6 | |
| 10 a.m. | 0.3 | 0.6 | 0.4 | |
| 11 a.m. | 0.4 | 0.6 | 0.4 | |
| 12 p.m. | 0.4 | 0.6 | 0.4 | |
| 1 p.m. | 0.5 | 0.7 | 0.6 | |
| 2 p.m. | 0.5 | 0.7 | 0.6 | |
| 3 p.m. | 0.6 | 0.9 | 0.7 | |
| 4 p.m. | 0.7 | 1.2 | 0.7 | |
| 5 p.m. | 0.9 | 0.8 | 1.0 | |
| 6 p.m. | 0.9 | 0.9 | 0.9 | |
| 7 p.m. | 1.1 | 0.8 | 0.9 | |
| 8 p.m. | 1.2 | 0.9 | 1.0 | |
| 9 p.m. | 1.6 | 0.9 | 1.3 | |
| 10 p.m. | 1.7 | 1.1 | 1.6 | |
| 11 p.m. | 1.9 | 0.8 | 1.2 | |
| Sunday | 12 a.m. | 1.9 | 0.9 | 1.3 |
| 1 a.m. | 2.3 | 0.6 | 1.4 | |
| 2 a.m. | 2.5 | 0.8 | 1.6 | |
| 3 a.m. | 1.9 | 0.6 | 1.2 | |
| 4 a.m. | 0.9 | 0.4 | 0.5 | |
| 5 a.m. | 0.5 | 0.2 | 0.5 | |
| 6 a.m. | 0.3 | 0.3 | 0.5 | |
| 7 a.m. | 0.3 | 0.4 | 0.3 | |
| 8 a.m. | 0.2 | 0.4 | 0.3 | |
| 9 a.m. | 0.3 | 0.4 | 0.2 | |
| 10 a.m. | 0.3 | 0.4 | 0.2 | |
| 11 a.m. | 0.3 | 0.6 | 0.4 | |
| 12 p.m. | 0.3 | 0.7 | 0.3 | |
| 1 p.m. | 0.4 | 0.5 | 0.5 | |
| 2 p.m. | 0.5 | 0.6 | 0.4 | |
| 3 p.m. | 0.6 | 0.6 | 0.8 | |
| 4 p.m. | 0.7 | 0.9 | 0.6 | |
| 5 p.m. | 0.7 | 0.9 | 0.8 | |
| 6 p.m. | 0.7 | 0.7 | 0.7 | |
| 7 p.m. | 0.9 | 0.7 | 1.0 | |
| 8 p.m. | 1.0 | 0.5 | 1.0 | |
| 9 p.m. | 1.0 | 0.7 | 0.9 | |
| 10 p.m. | 0.9 | 0.6 | 0.7 | |
| 11 p.m. | 0.9 | 0.6 | 0.6 | |
|
Note: The different ways in which police services deal with traffic violations can impact police-reported statistics. Counts are based on the most serious offence in the incident. One incident can involve more than one traffic violation under the Criminal Code. Source: Statistics Canada, Canadian Centre for Justice and Community Safety Statistics, Uniform Crime Reporting Survey. |
||||
Chart 13 end
Incidents of drug-impaired driving do not follow this pattern. About one in six incidents (17%) of drug-impaired driving occurred on a Saturday and 14% occurred on a Sunday, proportions relatively similar to those observed on any other day of the week. In addition, in 2019, the largest number of drug-impaired driving incidents were recorded between 4:00 p.m. and 5:00 p.m. (7%). However, the proportion of impaired driving incidents that occurred between 3:00 p.m. and 7:00 p.m. (23%) was not much higher than for incidents that occurred between 7:00 p.m. and 11:00 p.m. (21%), 11:00 a.m. and 3:00 p.m. (18%) or 11:00 p.m. and 3:00 a.m. (17%).
Targeting known peak periods has been one of the most effective ways to combat drinking and driving (Éduc’alcool 2010). However, the lack of a clear peak period for drug-impaired driving could pose an additional challenge for enforcement.
Incidents of alcohol-impaired and drug-impaired driving in criminal court
In 2018/2019, impaired driving was the second most common offence in cases completed by adult criminal courts. In addition, according to a recent study, impaired driving incidents were most likely to exceed the processing time limits imposed by the Jordan decision (Karam et al. 2020). A previous report on impaired driving prepared by Statistics Canada’s Canadian Centre for Justice and Community Safety Statistics also revealed that drug-impaired driving incidents took about twice as long to be processed as alcohol-impaired driving incidents (Perreault 2016).
Because there has been an increase in the number of drug-impaired driving incidents reported by police, and because new legislation was enacted in the wake of the legalization of recreational cannabis in 2018, tracking trends in cases of impaired driving has become increasingly relevant. As a result, the 2016 study is being updated to provide a current portrait of how criminal courts process impaired driving incidents, whether it involves alcohol- or drug-impaired driving.
Compared with the 2016 study, a category was added to enable analysis of trends in cases of impaired driving involving both alcohol and drugs. This offence category did not exist before 2018. However, police could enter more than one offence code for the same incident, including a code for alcohol-impaired driving and another for drug-impaired driving (see notes 5 and 6). Although this methodology likely resulted in an underestimation of the number of these incidents prior to 2018, the analysis of their characteristics may still inform us about the various paths these cases took through the courts.
The median time for completing drug-impaired driving cases decreased in 2018/2019
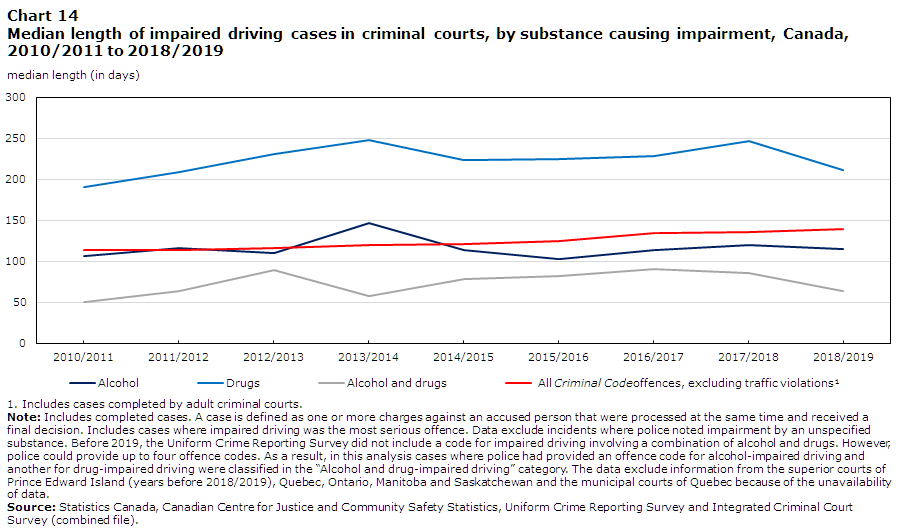
For the first time in four years, the median time for completing drug-impaired driving cases decreased in 2018/2019, falling from 246.5 days in 2017/2018 to 211 days (-14%). However, this decline follows an 8% increase observed in the previous year (Chart 14).
Chart 14 start
Data table for Chart 14
| Year | Alcohol | Alcohol and drugs | Drugs | All Criminal Code offences, excluding traffic violationsData table for chart 14 Note 1 |
|---|---|---|---|---|
| median length (in days) | ||||
| 2010/2011 | 106 | 50 | 190 | 113 |
| 2011/2012 | 116 | 64 | 208 | 113 |
| 2012/2013 | 110 | 89 | 231 | 116 |
| 2013/2014 | 146 | 57 | 247 | 120 |
| 2014/2015 | 113 | 79 | 223 | 121 |
| 2015/2016 | 103 | 82 | 224 | 125 |
| 2016/2017 | 114 | 90 | 228 | 134 |
| 2017/2018 | 119 | 85 | 247 | 135 |
| 2018/2019 | 115 | 64 | 211 | 139 |
Source: Statistics Canada, Canadian Centre for Justice and Community Safety Statistics, Uniform Crime Reporting Survey and Integrated Criminal Court Survey (combined file). |
||||
Chart 14 end
Despite the decrease, the median time for completing drug-impaired driving cases is still almost twice the median time for completing cases of alcohol-impaired driving (115 days), which also fell slightly in 2018/2019 (-3%).
The number of court appearances required to complete a drug-impaired driving case is also higher than what is required for cases involving alcohol, which may account for the longer processing times. In 2018/2019, drug-related cases required an average of 7.8 court appearances, compared with 5.5 court appearances for alcohol-related cases. Furthermore, the average number of court appearances is relatively similar when considering the entire period from 2010/2011 to 2018/2019 (7.7 court appearances for drug related cases and 5.2 court appearances for alcohol-related cases) (Table 4).
Although cases of drug-impaired driving take longer to process, it is quite different when the case involves a combination of alcohol and drugs. In 2018/2019, these cases required a median time of 64 days to be processed, also down from the previous year (-25%).
Notably, the median processing time declined for all types of impaired driving cases, while the median processing time rose 3% for all other criminal incidents (excluding traffic offences).Note However, the processing time for each type of impaired driving case remained higher than in 2010/2011.
Although the median time for processing impaired driving cases is longer when drug impairment rather than alcohol impairment is involved, drug-related cases usually include fewer charges. For the period from 2010/2011 to 2018/2019, the majority (62%) of drug-impaired driving cases included only one charge. By comparison, most alcohol-related cases had two charges.
As indicated previously, alcohol-impaired driving incidents often lead to charges under the section in the Criminal Code which deals with impaired driving in general and under the section which establishes the per se limit for alcohol, while drug-impaired driving incidents mostly lead to charges only under the first section.
In all provinces, drug-impaired driving cases take longer to be processed
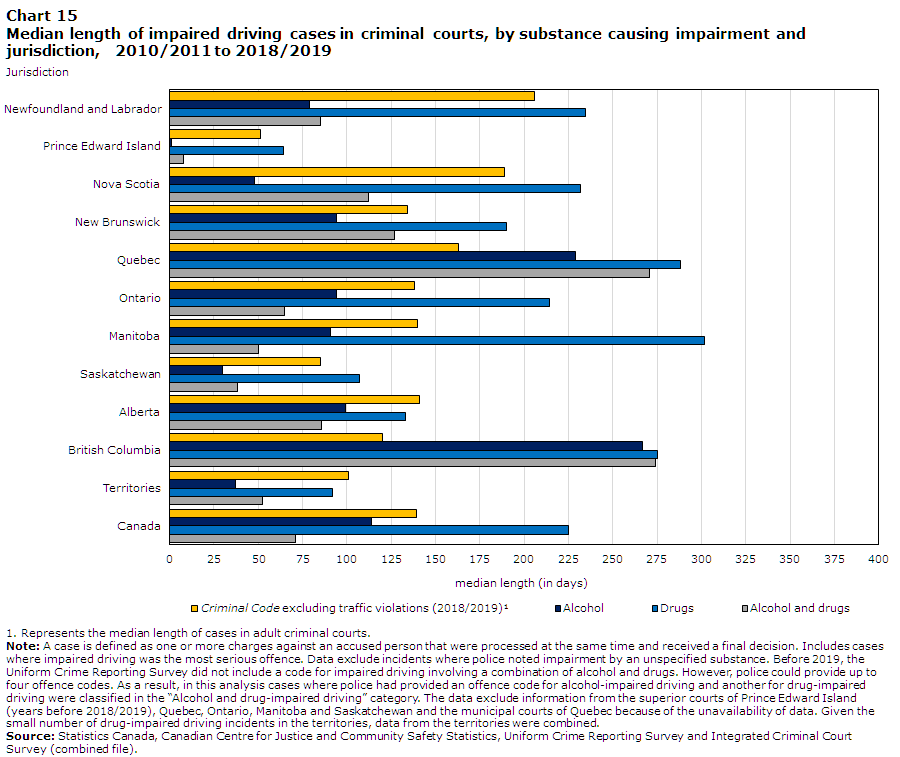
In all provinces and territories, cases of drug-impaired driving require more time to be processed than cases of alcohol-impaired driving. In all provinces except Alberta, the median time required to complete these cases surpassed the median time for all adult criminal incidents in 2018/2019. However, there are significant provincial variations in the median time required to process drug-impaired driving cases.
Prince Edward Island has the shortest median time to complete impaired driving cases (64 days for the period from 2010/2011 to 2018/2019). However, it also has the biggest gap—proportionally speaking—between the median time to process alcohol-related cases and drug-related cases. It should be noted that the median time to process a case of alcohol-impaired driving is only one day in Prince Edward Island, much less than the median of 30 days in Saskatchewan, the province with the second-shortest processing time (Chart 15).
Chart 15 start
Data table for Chart 15
| Jurisdiction |
Criminal Code, excluding traffic violations (2018/2019)Data table for chart 15 Note 1 | Alcohol | Drugs | Alcohol and drugs |
|---|---|---|---|---|
| median length (in days) | ||||
| Newfoundland and Labrador | 206 | 79 | 235 | 85 |
| Prince Edward Island | 51 | 1 | 64 | 8 |
| Nova Scotia | 189 | 48 | 232 | 112 |
| New Brunswick | 134 | 94 | 190 | 127 |
| Quebec | 163 | 229 | 288 | 271 |
| Ontario | 138 | 94 | 214 | 65 |
| Manitoba | 140 | 91 | 302 | 50 |
| Saskatchewan | 85 | 30 | 107 | 39 |
| Alberta | 141 | 99 | 133 | 86 |
| British Columbia | 120 | 267 | 275 | 274 |
| Territories | 101 | 37 | 92 | 53 |
| Canada | 139 | 114 | 225 | 71 |
Source: Statistics Canada, Canadian Centre for Justice and Community Safety Statistics, Uniform Crime Reporting Survey and Integrated Criminal Court Survey (combined file). |
||||
Chart 15 end
British Columbia, Quebec and Alberta are the only provinces where the median processing time for drug-impaired driving cases were not at least twice the time required for alcohol-related cases during the period from 2010/2011 to 2018/2019. In British Columbia and Quebec, it is not so much because the cases of drug-impaired driving were processed quickly, but rather because the median time for processing all types of impaired driving cases was well above the national average. Only Manitoba had a median time for processing drug-impaired driving cases that was greater than in Quebec or British Columbia.
Moreover, cases of impaired driving involving a combination of alcohol and drugs, as a whole, had a shorter median time than other types of impaired driving cases. However, this is mainly because of the shorter median times for these cases in Ontario, Manitoba and Alberta. In all the other provinces and territories, cases involving a combination of alcohol and drugs had a median processing time above the time required for cases involving alcohol for the period from 2010/2011 to 2018/2019.
Cases of drug-impaired driving are less likely to result in a guilty verdict than cases of alcohol-impaired driving
The greater complexity of incidents of drug-impaired driving compared with alcohol-impaired driving incidents is also reflected in the fact that drug-related cases are less likely to result in a guilty finding. During the period from 2010/2011 to 2018/2019, around 82% of alcohol-impaired driving cases resulted in a guilty finding, compared with 64% of drug-impaired driving cases (Chart 16). Moreover, this gap is observed even when only considering cases where a “not guilty” plea was entered. Among these cases, 41% of those involving alcohol resulted in a guilty finding, compared with 30% of drug-related cases (Table 4).
Chart 16 start

Data table for Chart 16
| Jurisdiction | Alcohol | Drugs | Alcohol and drugs |
|---|---|---|---|
| percent | |||
| Newfoundland and Labrador | 87 | 59 | 83 |
| Prince Edward Island | 93 | 73 | 90 |
| Nova Scotia | 88 | 52 | 76 |
| New Brunswick | 88 | 69 | 84 |
| Quebec | 89 | 81 | 85 |
| Ontario | 80 | 59 | 83 |
| Manitoba | 88 | 52 | 90 |
| Saskatchewan | 88 | 69 | 86 |
| Alberta | 70 | 52 | 67 |
| British Columbia | 85 | 68 | 100 |
| Territories | 91 | 57 | 90 |
| Canada | 82 | 64 | 78 |
|
Note: A case is defined as one or more charges against an accused person that were processed at the same time and received a final decision. Includes cases where impaired driving was the most serious offence. Data exclude incidents where police oted impairment by an unspecified substance. Before 2019, the Uniform Crime Reporting Survey did not include a code for impaired driving involving a combination of alcohol and drugs. However, police could provide up to four offence codes. As a result, in this analysis cases where police had provided an offence code for alcohol-impaired driving and another for drug-impaired driving were classified in the “Alcohol and drug-impaired driving” category. The data exclude information from the superior courts of Prince Edward Island (years before 2018/2019), Quebec, Ontario, Manitoba and Saskatchewan and the municipal courts of Quebec because of the unavailability of data. Given the small number of drug-impaired driving incidents in the territories, data from the territories were combined. Source: Statistics Canada, Canadian Centre for Justice and Community Safety Statistics, Uniform Crime Reporting Survey and Integrated Criminal Court Survey (combined file). |
|||
Chart 16 end
However, the proportion of drug-impaired driving cases resulting in a guilty finding seems to be on the rise. In 2010/2011, this proportion was 64%, compared to 70% in 2018/2019 (Table 4).
In all the provinces, drug-impaired driving cases were slightly less likely to result in a guilty finding than cases of alcohol-impaired driving. In Nova Scotia, Alberta, and Manitoba (52% each), cases of drug-impaired driving were least likely to result in a guilty finding. Quebec (81%) and Prince Edward Island (73%) had the highest proportions of drug-impaired driving cases that resulted in a guilty verdict during the period from 2010/2011 to 2018/2019 (Chart 16).
The proportion of alcohol-impaired driving cases that resulted in a guilty finding varied much less from province to province, ranging from 70% in Alberta to 93% in Prince Edward Island.
Fine, seizure order or prohibition order are the most common sentences
Over the period from 2010/2011 to 2018/2019, the sentences handed down most often in both alcohol- and drug-impaired driving cases were fines, seizure orders or prohibition orders (in about 9 in 10 guilty cases (Chart 17). Given that both of these offences carry a minimum penalty comprising a $1,000 fine and a one-year driving ban, these penalties could be expected to be handed down most often.
Chart 17 start

Data table for Chart 17
| Type of sentence | |||||
|---|---|---|---|---|---|
| Fine | Prohibition order | Probation | Imprisonment | Absolute or conditional discharge | |
| percent | |||||
| Alcohol | 89 | 90 | 11 | 9 | 1 |
| Drugs | 88 | 92 | 15 | 8 | 2 |
| Alcohol and drugs | 84 | 92 | 12 | 11 | 2 |
|
Note: A case is defined as one or more charges against an accused person that were processed at the same time and received a final decision. Includes cases where impaired driving was the most serious offence. Data exclude incidents where police noted impairment by an unspecified substance. Before 2019, the Uniform Crime Reporting Survey did not include a code for impaired driving involving a combination of alcohol and drugs. However, police could provide up to four offence codes. As a result, in this analysis cases where police had provided an offence code for alcohol-impaired driving and another for drug-impaired driving were classified in the “Alcohol and drug-impaired driving” category. The data exclude information from the superior courts of Prince Edward Island (years before 2018/2019), Quebec, Ontario, Manitoba and Saskatchewan and the municipal courts of Quebec because of the unavailability of data. Source: Statistics Canada, Canadian Centre for Justice and Community Safety Statistics, Uniform Crime Reporting Survey and Integrated Criminal Court Survey (combined file). |
|||||
Chart 17 end
Conversely, it was quite rare for a custody sentence to be handed down. Fewer than 1 in 10 cases of impaired driving—whether by alcohol or by drugs—resulted in a custody sentence. However, cases of impaired driving involving both alcohol and drugs were slightly more likely to result in a custody sentence (11%) during the period studied.
Fines for drug-impaired driving are on average slightly lower than those for alcohol-impaired driving
On average, drug-impaired driving cases resulting in a fine between 2010/2011 and 2018/2019 had slightly lower fines than alcohol-impaired driving cases. The average fine for drug-impaired driving was $1,177, compared with an average of $1,267 for alcohol-impaired driving (Table 4). More specifically, fines exceeded $1,000 in close to 6 in 10 alcohol-impaired driving cases (57%), compared with about 4 in 10 (42%) drug-impaired driving cases (Chart 18).
Chart 18 start

Data table for Chart 18
| Amount of fine | Alcohol | Drugs | Alcohol and drugs |
|---|---|---|---|
| percent | |||
| $500 or less | 1 | 3 | 1 |
| $501 to $1,000 | 42 | 55 | 39 |
| $1,001 to $1,500 | 43 | 34 | 45 |
| More than $1,500 | 14 | 9 | 16 |
|
Note: A case is defined as one or more charges against an accused person that were processed at the same time and received a final decision. Cases with more than one charge are represented by the most serious offence. The data exclude information from the superior courts of Prince Edward Island (years before 2018/2019), Quebec, Ontario, Manitoba and Saskatchewan and the municipal courts of Quebec because of the unavailability of data. Source: Statistics Canada, Canadian Centre for Justice and Community Safety Statistics, Uniform Crime Reporting Survey and Integrated Criminal Court Survey (combined file). |
|||
Chart 18 end
However, cases of impaired driving involving a combination of alcohol and drugs were most likely to result in relatively high fines. Just over 1 in 6 cases of impaired driving involving a combination of alcohol and drugs (61%) resulted in a fine of more than $1,000 during the period from 2010/2011 to 2018/2019, with an average fine of $1,299.
A number of factors can affect the sentence or sentences handed down. Judges must take into consideration the key principles for sentencing, such as the seriousness of the offence, the damage caused, and the accused’s history. The Criminal Code also sets out heavier minimum sentences in repeat cases of impaired driving, including jail time.
Summary
Over the last few decades, significant progress has been made with respect to impaired driving. Since 1986, the impaired driving rate has fallen by 60% and the rate of impaired driving causing death has dropped 77%. However, impaired driving remains the second-leading criminal cause of death—after homicide—and continues to result in hundreds of injured victims each year. It is also the second most common offence processed by adult criminal courts and the offence most likely to exceed the time limits imposed by the Jordan decision.
In 2018, the legalization of recreational cannabis raised some concerns about drug-impaired driving. At the same time as legalization, the Government of Canada began revising the provisions of the Criminal Code dealing with impaired driving, namely by creating new offences and expanding the powers of police to detect impairment.
In 2019, the rate of police-reported incidents of impaired driving (228 per 100,000 population) was up 19% from the previous year. More precisely, alcohol-impaired driving increased by 15% while drug-impaired driving increased 43%.Drug-impaired driving incidents accounted for 8% of all police-reported impaired driving incidents in 2019.
Among the provinces, Ontario saw the lowest rates of both alcohol- and drug-impaired driving. Meanwhile, Prince Edward Island had the highest rate of alcohol-impaired driving, while Newfoundland and Labrador had the highest rate of drug-impaired driving. Among the 34 census metropolitan areas (CMAs), only Moncton, Abbotsford–Mission, Lethbridge, Vancouver, Victoria, Halifax and Edmonton had impaired driving rates higher than the national average in 2019.
Compared with alcohol-impaired driving incidents, incidents of drug-impaired driving take longer to be cleared and are less likely to be cleared by charge. In addition, incidents of impaired driving processed by criminal courts take about twice as long to be completed when they involve drugs and they are less likely to result in a guilty finding. However, the median time needed to complete cases of drug-impaired driving improved, falling from 246.5 days in 2017/2018 to 211 days in 2018/2019.
Detailed data tables
Survey description
Uniform Crime Reporting Survey
The Uniform Crime Reporting (UCR) Survey was established in 1962 with the co-operation and assistance of the Canadian Association of Chiefs of Police. The UCR was designed to measure criminal incidents that have been reported to federal, provincial/territorial and municipal police services in Canada.
For an incident to be counted in the crime statistics it must be recorded as “founded” as opposed to “unfounded.” An incident is “founded” if, after police investigation it has been determined that the reported offence did occur or was attempted or there is no credible evidence to confirm that the reported incident did not take place. This includes third-party reports that fit these criteria. A criminal incident involves one or more related offences that are committed during a single criminal event and have been reported to police. Police services can report up to four violations for each incident; however, this has typically only been the practice since the late 1980s and not for all police services. In order to ensure comparability, counts presented in this article are based on the most serious offence in the incident as determined by a standard classification rule used by all police services.
Integrated Criminal Court Survey
The Integrated Criminal Court Survey (ICCS) is administered by the Canadian Centre for Justice Statistics (Statistics Canada) in collaboration with provincial and territorial government departments responsible for criminal courts in Canada. The survey collects statistical information on adult and youth court cases involving Criminal Code and other federal statute offences.
All youth courts in Canada have reported data to the youth component of the survey since the 1991/1992 fiscal year. All adult courts have reported to the adult component of the survey since the 2006/2007 fiscal year, with the exception of superior courts in Prince Edward Island (years before 2018/2019), Ontario, Manitoba and Saskatchewan as well as municipal courts in Quebec. These data were not available for extraction from the provinces' electronic reporting systems and therefore, were not reported to the survey.
The primary unit of analysis is a case. A case is defined as one or more charges against an accused person or company that were processed by the courts at the same time and received a final decision. A case combines all charges against the same person having one or more key overlapping dates (date of offence, date of initiation, date of first appearance, date of decision, or date of sentencing) into a single case.
Cases are counted according to the fiscal year in which they are completed. Each year, the ICCS database is considered final at the end of March for the production of court statistics pertaining to the preceding fiscal year.
Combined file of the Integrated Criminal Court Survey and Uniform Crime Reporting Survey
For this report, the data from the ICSS and the UCR were combined to distinguish between cases of alcohol-impaired driving and drug-impaired driving.
The first step was to identify, for 2010/2011 to 2019/2019, all cases completed by criminal courts for which the most serious charge was impaired driving. By using a process of deterministic hierarchical matching, we then tried to identify, among the incidents reported by police between 2008 and 2019, those that corresponded to impaired driving cases completed by the courts.
Police Administration Survey
The Police Administration Survey collects data on police personnel and expenditures from each municipal, provincial and federal police services in Canada. The following security agencies are excluded from the survey: the Canadian Security Intelligence Service, railway and military police, and government departments enforcing specific statutes in the areas of income tax, customs and excise, immigration, fisheries and wildlife. Additionally, private security services and private investigators are not included in the survey.
References
Asbridge, M. and R. Ogilvie. 2015. A Feasibility Study of Roadside Oral Fluid Drug Testing. MADD Canada.
Aydelotte, J. D., A. L. Mardock, C. A. Mancheski, S. M. Quamar, P. G. R. Teixeira, C. V. R. Brown and L. H. Brown. 2019. “Fatal crashes in the 5 years after recreational marijuana legalization in Colorado and Washington.” Accident Analysis and Prevention. Vol. 132.
Beirness, D.J. and E.E. Beasley. 2018. Alcohol and Drug Use Among Drivers in Ontario: Findings from the 2017 Roadside Survey. Ministry of Transportation. Toronto, Ontario,
Beirness, D J. and A. J. Porath. 2019. Clearing the Smoke on Cannabis (An Update). Canadian Centre on Substance Use and Addiction.
Beirness, D. 2020. Who Drives after Using Drugs? A review of Prominent Characteristics. Canadian Centre on Substance Use and Addiction. Ottawa, Ontario.
Brown, S., W. Van Laar and R. Robertson. 2017. Alcohol and Drug-crash Problem in Canada: 2014 Report. Canadian Council of Motor Administrators. Ottawa Ontario.
Brubacher, J. R., H. Chan, S. Erdelyi, M. Asbridge, R. E. Mann, R. A. Pursell and R. Solomon. 2018. “Police documentation of drug use in injured drivers: Implications for monitoring and preventing drug-impaired driving.” Accident Analysis and Prevention. Vol. 118. p. 200-206.
Canadian Centre on Substance Use and Addiction. 2017. “Key messages about drug-impaired driving in rural and remote areas.” Drug-impaired Driving in Canada: Educator Toolkit.
Canadian Centre on Substance Use and Addiction. 2019.”Key issues in drug-impaired driving.” Policy Brief.
Canadian Centre on Substance Use and Addiction. 2020a. “Short-term administrative sanctions for alcohol and drug use by drivers.” Policy Brief.
Canadian Centre on Substance Use and Addiction. 2020b.“COVID-19 and impaired driving risk.” Infographic. (accessed March 28, 2021).
Canadian Centre on Substance Use and Addiction. 2020c. “25% of Canadians (aged 35-54) are drinking more while at home due to covid pandemic; cite lack of regular schedule, stress and boredom as main factors.” CCSA March Omni Summary Report.
Downey, L.A., R. King, K.Papafotiou, P. Swann, E. Ogden, M. Boorman and C. Stough. 2013. “The effects of cannabis and alcohol on simulated driving: Influences of dose and experience.” Accident Analysis and Prevention. Vol. 50. p. 879-886.
Educ’alcool. 2016. Drinking, Driving, Making the Right Choice. Montréal, Quebec.
Goldenbeld, C., K.Torfs, W. Vlakveld and S. Houwing. 2020. “Impaired driving due to alcohol or drugs: International differences and determinants on E-survey of road users’ attitudes first-wave results in 32 countires.” IATSS Research. Vol. 44. p. 188-196.
Hartmann, R.L., T.L. Brown, G. Milavetz, R.S. Spurgin, D.S. Pierce, D.A. Gorelick and M.A. Huestis. 2015. “Cannabis effects on driving lateral control with and without alcohol.” Drug and Alcohol Dependence. Vol. 154. p. 25-37.
Institut national de santé publique du Québec. 2020. “Covid-19 – Pandémie et consommation d’alcool.” Sondage sur les attitudes et comportements de la population Québécoise.
Institut de la statistique du Québec. 2020. “Enquête québécoise sur le cannabis, 2019: La consommation de cannabis et les perceptions des Québécois." Portrait et Comparaison avec L’édition de 2018.
Kamer, R. S., S. Warshafsky and G. C. Kamer. 2020. “Change in traffic fatality rates in the first 4 states to legalize recreational marijuana.” JAMA Internal Medicine. Vol. 180, no. 8. p. 1119‑1120.
Karam, M., J. Lukassen, Z. Miladinovic and M. Wallace. 2020. “Measuring efficiency in the Canadian adult criminal court system: Criminal court workload and case processing indicators.” Juristat. Statistics Canada Catalogue no. 85-002-X.
Lane, T. J., and W. Hall 2019. “Traffic fatalities within US states that have legalized recreational cannabis sales and their neighbours.” Addiction. Vol. 114, no. 5. p. 847‑856.
Minaker, L. M., A. Bonham, T. Elton-Marshall, C. Leos-Toro, T. C. Wild and D. Hammond. 2017. “Under the influence: examination of prevalence and correlates of alcohol and marijuana consumption in relation to youth driving and passengers behaviours in Canada: A cross-sectional study.” CMAJ Open. Vol. 5, no. 2.
Moreau, G. 2019. “Police-reported crime statistics, 2018.” Juristat. Statistics Canada Catalogue no. 85-002-X.
Nazif‐Munoz, J. I., Y. Oulhote and M. C. Ouimet 2020. “The association between legalization of cannabis use and traffic deaths in Uruguay.” Addiction. Vol. 115, no. 9. p. 1697‑1706.
Paré, L. and M. Larochelle. 2004. “Alternatives de transport à la conduite avec facultés affaiblies en région rurale : bilan et perspectives.” Agence de Développement de Réseaux Locaux de Services de Santé et de Services Sociaux de Chaudière-Appalaches. Direction de Santé Publique.
Perreault, S. 2016. “Impaired driving in Canada, 2015.” Juristat. Statistics Canada Catalogue no. 85-002-X.
Pitel, S. and et R.Solomon. 2013. Estimating the Number and Cost of Impairment-Related Traffic Crashes in Canada: 1999 To 2010. MADD Canada.
Public Safety Canada. 2020. Annual National Data Report to Inform Trends and Patterns in Drug-Impaired Driving. Catalogue no. PS15-2E-PDF.
Robertson, R. D., Wicklund, C., Holmes, E. and P. Biderman. 2016. Impaired Driving in Rural Jurisdictions: Problems and Solutions. Traffic Injury Research Foundation. Ottawa, Ontario.
Rotermann, Michelle. 2020. “What has changed since cannabis was legalized?” Health Reports. Statistics Canada Catalogue no. 82-003-X.
Royal Canadian Mounted Police (RCMP). 2021. “Impaired driving.” Traffic Services Section. (accessed March 28, 2021).
Solomon, R. and E. Chamberlain. 2014. “Canada’s new drug-impaired driving law: The need to consider other approaches.” Traffic Injury Prevention. Vol. 15, no. 7. p. 685-693.
Solomon, R. and M. Clarizio. 2016. Total Crash Deaths Involving Alcohol and/or Drugs in Canada: 2012. MADD Canada.
Solomon, R., MacLeod L. and E. Dumschat. 2020. “The increasing role of provincial administrative sanctions in Canadian impaired driving enforcement.” Traffic Injury Prevention. Vol. 21, no. 5. p. 298-302.
Statistics Canada. 2021. “Alcohol and cannabis use during the pandemic: Canadian Perspectives Survey Series 6.” The Daily, March 4, 2021.
- Date modified: