
Intimate partner violence: Experiences of visible minority women in Canada, 2018

Archived Content
Information identified as archived is provided for reference, research or recordkeeping purposes. It is not subject to the Government of Canada Web Standards and has not been altered or updated since it was archived. Please "contact us" to request a format other than those available.
by Adam Cotter, Canadian Centre for Justice and Community Safety Statistics
Intimate partner violence (IPV)—that is, a range of behaviours including emotional, financial, psychological, physical, or sexual violence perpetrated by an intimate partner—impacts victimsNote regardless of their age, gender, background, or other characteristics. Though no one or no specific group in the Canadian population is immune to experiences of intimate partner violence, research to date has found that different population groups may have different experiences of IPV, in terms of its prevalence, characteristics, and impacts on victims (Cotter 2021). While IPV and its effects are important to consider regardless of these factors, understanding the varied experiences between groups is critical as a better understanding of them will help to develop more appropriate responses, services, programs, or prevention strategies related to IPV.
The Employment Equity Act defines visible minorities as “persons, other than Aboriginal peoples, who are non-Caucasian in race or non-white in colour”, and nearly one-quarter of Canadians belong to a population group that falls within this category. This article looks at experiences of IPV among this population—in particular, among women designated as visible minorities, as generally speaking, women were more likely than men to report IPV at some point in their lifetimes, and more commonly reported the most severe types and more negative consequences (Cotter 2021).
This article is one in a series of short reports examining intimate partner violence among members of different population groups, based on self-reported data from the 2018 Survey of Safety in Public and Private Spaces (SSPPS). It explores the lifetime and past-12 month experiences IPV of women designated as visible minorities, making comparisons to non-visible minority women.Note Experiences of IPV among the Canadian population in general (Cotter 2021), Indigenous women (Heidinger 2021), sexual minority men (Jaffray 2021a) and women (Jaffray 2021b), women with disabilities (Savage 2021a), and young women (Savage 2021b) are examined in the other reports within this series.Note
Defining the population designated as visible minority
In the SSPPS, respondents were asked to indicate the ethno-cultural group (or groups) to which they belong. Those who identify with particular groups—mainly South Asian, Chinese, Black, Filipino, Latin American, Arab, Southeast Asian, West Asian, Korean and Japanese—are designated as visible minorities based on the definition in the Employment Equity Act. In other words, respondents did not self-identify as visible minorities, but rather this is a category derived for the purposes of analysis. Where sample size allows, groups are disaggregated in the presentation of the results so as to account for the specific experiences and heterogeneity of the population groups designated as visible minorities. Notably, the non-visible minority population includes First Nations, Métis, and Inuit people.
There were some notable demographic differences between visible minority and non-visible minority women. For example, according to the 2018 SSPPS, visible minority women were younger (45% were under 35 years of age, compared with 27% of non-visible minority women), more likely to be employed (72% versus 65%), more likely to have a bachelor’s degree or higher (45% versus 31%), much more likely to be immigrants (76% versus 11%), and more likely to be single (37% versus 21%).
Start of text box 1
Text box 1
Measuring and defining intimate partner violence
The Survey of Safety in Public and Private Spaces (SSPPS) collected information on Canadians’ experiences of intimate partner violence (IPV) since the age of 15 and in the 12 months that preceded the survey. The survey asked about a broad range of behaviours committed by intimate partners, including psychological, physical, and sexual violence. The definition of partner was also broad and included current and former legally married spouses, common-law partners, dating partners, and other intimate partner relationships.
In the SSPPS, intimate partner violence is defined as any act or behaviour committed by a current or former intimate partner, regardless of whether or not these partners lived together. In this article, intimate partner violence is broadly categorized into three types: psychological violence, physical violence, and sexual violence.
Psychological violence encompasses forms of abuse that target a person’s emotional, mental, or financial well-being, or impede their personal freedom or sense of safety. This category includes 15 specific types of abuse, including jealousy, name-calling and other put-downs, stalking or harassing behaviours, manipulation, confinement, or property damage (for a complete list of items included in this category, see Table 1). It also includes being blamed for causing their partner’s behaviour, which was measured among those respondents who experienced certain forms of IPV.
Physical violence includes forms of abuse that involve physical assault or the threat of physical assault. In all, 9 types of abuse are included in this category, including items being thrown at the victim, being threatened with a weapon, being slapped, being beaten, and being choked (see Table 1).
Sexual violence includes sexual assault or threats of sexual assault and was measured using two questions: being made to perform sex acts that the victim did not want to perform, and forcing or attempting to force the victim to have sex.
The analysis presented in this article takes an inclusive approach to the broad range of behaviours that comprise IPV. For the purposes of this analysis, those with at least one response of ‘yes’ to any item on the survey measuring IPV are included as having experienced intimate partner violence, regardless of the type or the frequency.
For more information on the measures of IPV in the SSPPS and other sources of data on intimate partner violence in Canada, see Cotter (2021).
End of text box 1
Three in ten visible minority women have experienced some form of IPV in their lifetime
According to the Survey of Safety in Public and Private Spaces (SSPPS), among those who had ever been in an intimate partner relationship, 29% of women belonging to an ethno-cultural group designated as a visible minority reported experiencing some kind of psychological, physical, or sexual violence committed by an intimate partner in their lifetime (since the age of 15Note ) (Table 1, Table 2).Note This proportion was lower than that observed among non-visible minority women, nearly half (47%) of whom reported some form of intimate partner violence (IPV) in their lifetime.Note
Based on the definition of visible minority used in the Employment Equity Act, the non-visible minority population includes First Nations, Métis, and Inuit (Indigenous) people. Six in ten (61%) Indigenous women experienced some form of IPV in their lifetime, considerably higher than the proportion of non-Indigenous, non-visible minority women (44%).Note The proportion of lifetime IPV among visible minority women was significantly lower than both that among Indigenous women and non-Indigenous non-visible minority women.
Psychological abuse was the most common type of IPV, reported by 29% of visible minority women and 46% of non-visible minority women (Table 1, Table 2). This was followed by physical violence (13% of visible minority women versus 25% of non-visible minority women) and sexual violence (6% of visible minority women versus 13% of non-visible minority women).
Most victims of IPV experienced more than one type of abusive behaviour. This was the case regardless of ethno-cultural group, as similar proportions of visible minority (15%) and non-visible minority (16%) women who were victims of IPV stated that they had experienced a single type of IPV in their lifetime. In contrast, among victims of IPV, visible minority women were less likely than non-visible minority women to have experienced ten or more of the abusive behaviours measured by the survey (21% versus 30%).
Among visible minority women who experienced IPV, the most common abusive behaviours reported were their partner being jealous and not wanting them to talk to others (20%), being put down or called names (18%), being told they were crazy, stupid, or not good enough (17%), their partner demanding to know where they were and who they were with at all times (12%), and being shaken, grabbed, pushed, or thrown (9%) (Table 1).
Of note, these were also the five most common abusive behaviours reported by non-visible minority women—and, in each case, the prevalence was higher among non-visible minority women. In fact, that was the case for virtually all of the types of abusive behaviour measured by the SSPPS.Note
Visible minority women and non-visible minority women equally likely to experience physical and sexual IPV in the past 12 months
As was the case when looking at the data on lifetime prevalence, visible minority women were less likely to have experienced overall IPV (9%) or psychological IPV (9%) in the past 12 months when compared with non-visible minority women (13% and 12%, respectively) (Table 1, Table 2).
However, unlike what was seen in the lifetime data, visible minority women and non-visible minority women were equally likely to have experienced physical abuse (both 2%) or sexual abuse (both 1%) in the past 12 months.
The majority of visible minority women who had experienced intimate partner violence in the past 12 months said that it had taken place on more than one occasion. More specifically, 26% stated that it occurred monthly or more, and a further 53% reported that it happened at least a few times over the past year. About one in five (21%) visible minority women who experienced IPV said the violent or abusive behaviour(s) they experienced had happened once in the past 12 months. None of these proportions were statistically different from non-visible minority women who experienced IPV.Note
Relative to other visible minority groups, Arab, Black, and Latin American women experience higher rates of IPV
Looking at IPV among the population of visible minority women as a whole can reveal valuable information about intimate partner violence, and in some cases is necessary when analyzing data from a sample survey, as smaller groups may not have a large enough sample size to support meaningful analysis. That said, looking only at the visible minority population as a whole can also obscure differences between the distinct groups that make up this population.
The population designated as visible minorities comprises a wide range of ethno-cultural groups, and the experiences of a particular group can vary greatly from those of the overall visible minority population. In particular, Arab (44%), Black (42%), and Latin American (47%) women were more likely to have experienced IPV since the age of 15 when compared to the total visible minority population (29%) (Chart 1). There was no statistically significant difference in the prevalence of IPV between these groups of women and the non-visible minority population (47%). On the other hand, Chinese (23%) and Filipino (18%) women were less likely than visible minority women in general to have experienced IPV in their lifetime.
Chart 1 start

Data table for Chart 1
| Ethno-cultural group |
Intimate partner violence since age 15 | |
|---|---|---|
| percent | standard error | |
| Arab | 44Note * | 12.37 |
| Black | 42Note * | 7.70 |
| Chinese | 23Note *** | 4.43 |
| Filipino | 18Note *** | 5.98 |
| Japanese | Note F: too unreliable to be published | Note ...: not applicable |
| Korean | Note F: too unreliable to be published | Note ...: not applicable |
| Latin American | 47Note * | 10.19 |
| South Asian | 30Note ** | 7.49 |
| Southeast Asian | 32Note ** | 11.70 |
| West Asian | Note F: too unreliable to be published | Note ...: not applicable |
| Group not indicated elsewhere | 43 | 14.10 |
| Designated as visible minority | 29Note ** | 2.82 |
| Not designated as visible minority | 47Note * | 1.06 |
|
... not applicable F too unreliable to be published
Source: Statistics Canada, Survey of Safety in Public and Private Spaces. |
||
Chart 1 end
Many of these differences in experiences of IPV over the lifetime did not hold true when looking at the past 12 months. More than one in ten Arab (21%), Black (13%), and Latin American (12%) women reported experiencing IPV in the past 12 months, but these proportions were not statistically different from visible minority or non-visible minority women as a whole. That said, as was the case over the lifetime, Chinese (8%) and Filipino (3%) women were less likely than non-visible minority women (13%) to have experienced IPV in the past 12 months.
One in four visible minority women under 24 experienced IPV in the past 12 months
Age, which is often a significant risk factor when it comes to victimization, played a major role in the likelihood of experiencing IPV among visible minority women. One-quarter (25%) of visible minority women between the ages of 15 and 24 experienced IPV in the past 12 months. Among visible minority women, the proportion of those who experienced IPV was more than twice as high among those aged 15 to 24 than any other age group (Table 3). Furthermore, among those 15 to 24 years old, there was no statistical difference in the proportion who experienced IPV between visible minority (25%) and non-visible minority (30%) women. In contrast, the proportion of visible minority women between the ages of 25 to 34 (8%) or 35 to 44 (7%) who experienced IPV was about half that of non-visible minority women (16% and 15%, respectively).
Lower prevalence of IPV among visible minority women reflects the experiences of immigrants
Not only did age factor into differences in the prevalence of IPV among visible minority women, it also intersected with other characteristics to impact experiences of IPV among other groups. Notably, previous research in Canada has found that lower rates of victimization among the visible minority population were largely due to lower rates among immigrant visible minorities, with non-immigrant visible minorities experiencing violence at similar rates as non-visible minorities (Ibrahim 2018; Simpson 2018). In the SSPPS, the non-immigrant visible minority population was considerably younger on average than the immigrant visible minority population. Almost half (49%) of non-immigrant visible minority women were between the ages of 15 and 24, compared with 16% of immigrant visible minority women.
The lower rates of IPV among visible minority women were largely reflective of the experiences of immigrants (Chart 2).Note One in four (26%) visible minority immigrant women in Canada experienced IPV in their lifetimes, about half the proportion of non-immigrant women, whether they were visible minorities (47%) or not (48%). In other words, when looking solely at non-Indigenous women born in Canada, the prevalence of IPV is the same between visible minority and non-visible minority women.
Chart 2 start

Data table for Chart 2
| Selected characteristic of victim |
Since age 15 | Past 12 months | ||
|---|---|---|---|---|
| percent | standard error | percent | standard error | |
| First Nations, Métis, or Inuit (Indigenous) person | 61Note * | 4.81 | 17 | 4.51 |
| Immigrant, visible minority | 26Note * | 3.02 | 8 | 2.07 |
| Immigrant, non-visible minority | 38Note * | 3.42 | 12 | 3.28 |
| Non-immigrant, non-Indigenous person, visible minority | 47 | 7.36 | 12 | 4.32 |
| Non-immigrant, non-Indigenous person, non-visible minorityData table for Chart 2 Note † | 48 | 1.17 | Note F: too unreliable to be published | Note ...: not applicable |
|
F too unreliable to be published ... not applicable
Source: Statistics Canada, Survey of Safety in Public and Private Spaces. |
||||
Chart 2 end
Of note, the SSPPS was conducted in English and French only, which may have a particular impact on results for immigrant respondents. A minority (6.8%) of immigrants did not speak either English or French, compared with 0.4% of non-immigrants.Note Though the vast majority of immigrants speak at least one official language, it is important to acknowledge that, due to language of data collection, SSPPS results may not fully reflect the experiences of immigrant women in Canada.
About one-quarter (24%) of visible minority women were physically or sexually abused by an adult before the age of 15, compared with just under three in ten (29%) non-visible minority women. As is the case among the general population (Burczycka 2017; Cotter 2021), a history of physical, sexual, or emotional abuse during childhood was associated with a higher prevalence of IPV in adulthood among visible minority women (Table 3). More than half (55%) of visible minority women who were physically or sexually abused by an adult before the age of 15 reported IPV in their lifetime, almost three times higher than the proportion among visible minority women who were not abused (21%). Additionally, the prevalence of IPV was more than three times higher among visible minority women who experienced emotional abuse or neglect during their childhood (42%) when compared with visible minority women who did not (13%).
Visible minority women less likely to report experiencing fear, anxiety, and feelings of being controlled or trapped by a partner
In addition to allowing for analysis of the prevalence of IPV across different groups, the SSPPS also included questions about longer-term emotional impacts and consequences that were a result of their experiences of intimate partner violence.
Just under half (49%) of visible minority women who experienced IPV in their lifetime stated that they had felt anxious or on edge as a result of a partner’s abusive behaviour, while one in three (33%) felt controlled or trapped by an abusive partner. Meanwhile, just under three in ten (28%) experienced fear of a partner at some point since the age of 15; fear is often included in measures of IPV as a potential indication of relatively more severe or coercive forms of IPV (Johnson and Leone 2005).
In all three cases, non-visible minority women were more likely to report these consequences of IPV they experienced, with 58% having been anxious, 44% having felt controlled or trapped, and 38% having been afraid of a partner. Further analysis of the impacts by specific subpopulations is not possible due to small sample size.
In terms of the number of abusive partners, experiences were similar regardless of ethno-cultural group. Both visible minority (69%) and non-visible minority (67%) women who have experienced IPV in their lifetime said that one intimate partner was responsible for the abuse, proportions that were not statistically different.
Consequences of IPV and actions taken by victims similar between visible minority and non-visible minority women
There are many barriers to reporting IPV or accessing services, including some that are of particular relevance for visible minority women, and specifically those who are also immigrants (Tabibi et al. 2018). For example, discrimination and racism within the services or systems, geographic, social, or cultural isolation, language barriers or lack of culturally sensitive or appropriate services, fear of deportation due to precarious status, or cultural beliefs that support keeping the family together and keeping matters private have all been identified as barriers encountered by victims of IPV (Tabibi et al. 2018; McCart et al. 2010; Davis and Henderson 2003).
Though the overall prevalence of IPV in the past 12 months was slightly higher among non-visible minority women, the prevalence of physical abuse and sexual abuse was the same—and, likewise, there were no statistically significant differences in the self-reported impacts and consequences of IPV when comparing visible minority and non-visible minority women (Chart 3). For example, regardless of visible minority status, the majority of women who were victims of IPV stated that the violence had an emotional impact, with about one in ten reporting symptoms consistent with a suspicion of post-traumatic stress disorder.
Chart 3 start
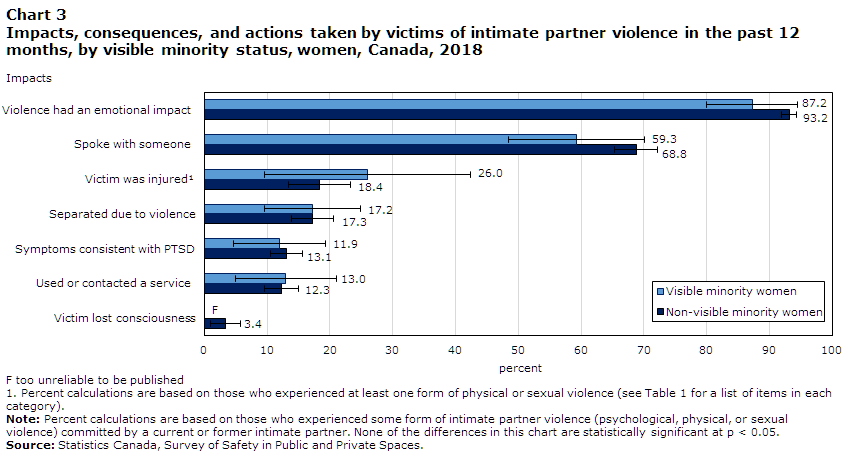
Data table for Chart 3
| Impacts |
Visible minority women | Non-visible minority women | ||
|---|---|---|---|---|
| percent | standard error | percent | standard error | |
| Violence had an emotional impact | 87.2 | 7.3 | 93.2 | 1.2 |
| Spoke with someone | 59.3 | 10.8 | 68.8 | 3.5 |
| Victim was injuredData table for Chart 3 Note 1 | 26.0 | 16.4 | 18.4 | 4.9 |
| Separated due to violence | 17.2 | 7.7 | 17.3 | 3.3 |
| Symptoms consistent with PTSD | 11.9 | 7.3 | 13.1 | 2.6 |
| Used or contacted a service | 13.0 | 8.1 | 12.3 | 2.7 |
| Victim lost consciousness | Note F: too unreliable to be published | Note ...: not applicable | 3.4 | 2.3 |
|
... not applicable F too unreliable to be published
Source: Statistics Canada, Survey of Safety in Public and Private Spaces. |
||||
Chart 3 end
In addition to these consequences, many victims of IPV chose to take some type of action following the IPV, most commonly speaking with someone about the violence. A smaller proportion used or contacted a formal service as a result of the violence they experienced. Few (4%) visible minority women who experienced IPV in the past 12 months said that the police became aware of the violence, a proportion not statistically different from that of non-visible minority women (7%).
Start of text box 2
Text box 2
Lifetime violent victimization
Nearly one-third of visible minority women have been physically or sexually assaulted in their lifetime
When considering all physical and sexual assault—that is, violence committed by intimate partners and violence committed by other perpetrators—just under one-third (31%) of women designated as visible minorities stated that they have been physically or sexually assaulted at least once since the age of 15 (Table 4, Chart 4). This compares with almost half (49%) of non-visible minority women.
Chart 4 start

Data table for Chart 4
| Physical assault | Sexual assault | Total violent victimization | ||
|---|---|---|---|---|
| percent | ||||
| Visible minority womenData table for Chart 4 Note † | Intimate partnerData table for Chart 4 Note 1 | 12.7 | 6.3 | 15.1 |
| Non-intimate partner | 18.0 | 18.8 | 26.9 | |
| Total | 22.8 | 20.9 | 30.9 | |
| Non-visible minority women | Intimate partnerData table for Chart 4 Note 1 | 25.2Note * | 12.7Note * | 28.0Note * |
| Non-intimate partner | 28.3Note * | 33.3Note * | 41.9Note * | |
| Total | 38.2Note * | 36.6Note * | 48.9Note * | |
Source: Statistics Canada, Survey of Safety in Public and Private Spaces. |
||||
Chart 4 end
Despite the differences noted in the lifetime prevalence, the proportion of those who experienced violence in the past 12 months was the same for visible minority and non-visible minority women (Table 5). This was the case regardless of the relationship to the perpetrator.
When looking at particular ethno-cultural groups, Latin American (51%) and Black (41%) women were more likely to have been physically or sexually assaulted in their lifetime than were visible minority women in general (31%). In contrast, lifetime violent victimization was lower among Filipino (21%) women when compared with visible minority (31%) or non-visible minority women (49%). Though not statistically different from visible minority women as a whole, Southeast Asian (23%), Chinese (27%), and South Asian (31%) also reported lifetime victimization at lower rates than non-visible minority women.
In nearly all regions, visible minority women less likely than non-visible minority women to be victims of physical or sexual assault
With the exception of the Atlantic Provinces, where there was no statistically significant difference in the proportion of visible minority (37%) and non-visible minority (46%) women who were physically or sexually assaulted in their lifetime, a higher proportion of non-visible minority women than visible minority women reported violent victimization in each region (Table 6). Notably, in Saskatchewan, British Columbia, and the Territories, visible minority women were about half as likely to have been victimized as non-visible minority women.
End of text box 2
Detailed data tables
Table 2 Intimate partner violence, since age 15 and in the past 12 months, Canada, 2018
Survey description
In 2018, Statistics Canada conducted the first cycle of the Survey of Safety in Public and Private Spaces (SSPPS). The purpose of the survey is to collect information on Canadians’ experiences in public, at work, online, and in their intimate partner relationships.
The target population for the SSPPS is the Canadian population aged 15 and older, living in the provinces and territories. Canadians residing in institutions are not included. This means that the survey results may not reflect the experiences of intimate partner violence among those living in shelters, institutions, or other collective dwellings. Once a household was contacted, an individual 15 years or older was randomly selected to respond to the survey.
In the provinces, data collection took place from April to December 2018 inclusively. Responses were obtained by self-administered online questionnaire or by interviewer-administered telephone questionnaire. Respondents were able to respond in the official language of their choice. The sample size for the 10 provinces was 43,296 respondents. The response rate in the provinces was 43.1%.
In the territories, data collection took place from July to December 2018 inclusively. Responses were obtained by self-administered online questionnaire or by interviewer-administered in-person questionnaire. Respondents were able to respond in the official language of their choice. The sample size for the 3 territories was 2,597 respondents. The response rate in the territories was 73.2%.
Non-respondents included people who refused to participate, could not be reached, or could not speak English or French. According to the 2016 Census of Population, 7% of the visible minority population could not speak either English or French, compared to 0.5% of the non-visible minority population. Respondents in the sample were weighted so that their responses represent the non-institutionalized Canadian population aged 15 and older.
Data limitations
As with any household survey, there are some data limitations. The results are based on a sample and are therefore subject to sampling errors. Somewhat different results might have been obtained if the entire population had been surveyed.
For the quality of estimates, the lower and upper bounds of the confidence intervals are presented. Confidence intervals should be interpreted as follows: If the survey were repeated many times, then 95% of the time (or 19 times out of 20), the confidence interval would cover the true population value.
References
Burczycka, M. 2017. "Profile of Canadian adults who experienced childhood maltreatment." In Family violence in Canada: A statistical profile, 2015. Juristat. Statistics Canada Catalogue no. 85-002-X.
Cotter, A. 2021. “Intimate partner violence in Canada, 2018: An overview.” Juristat. Statistics Canada Catalogue no. 85-002-X.
Cotter, A. and Savage, L. 2019. “Gender-based violence and inappropriate sexual behaviour in Canada, 2018: Initial findings from the Survey of Safety in Public and Private Spaces.” Juristat. Statistics Canada Catalogue no. 85-002-X.
Davis, R.C. and N.J. Henderson. 2003. "Willingness to report crimes: The role of ethnic group membership and community efficacy." NCCD News. Vol. 49, no. 4. p. 564-580.
Heidinger, L. 2021. “Intimate partner violence: Experiences of First Nations, Métis, and Inuit women in Canada, 2018.” Juristat. Statistics Canada Catalogue no. 85-002-X.
Ibrahim, D. 2018. “Violent victimization, discrimination, and perceptions of safety: An immigrant perspective, Canada, 2014.” Juristat. Statistics Canada Catalogue no. 85-002-X.
Jaffray, B. 2020. “Experiences of violent victimization and unwanted sexual behaviours among gay, lesbian, bisexual and other sexual minority people, and the transgender population, in Canada, 2018." Juristat. Statistics Canada Catalogue no. 85-002-X.
Jaffray, B. 2021a. “Intimate partner violence: Experiences of sexual minority men in Canada, 2018.” Juristat. Statistics Canada Catalogue no. 85-002-X.
Jaffray, B. 2021b. “Intimate partner violence: Experiences of sexual minority women in Canada, 2018.” Juristat. Statistics Canada Catalogue no. 85-002-X.
Johnson, M.P. and Leone, J.M. 2005. "The differential effects of intimate terrorism and situational couple violence: Findings from the National Violence Against Women Survey." Journal of Family Issues. Vol. 26, no. 3. p. 322‑349.
McCart, M.R., D.W. Smith and G.K. Sawyer. 2010. "Help seeking among victims of crime: A review of the empirical literature." Journal of Traumatic Stress. Vol. 23, no. 2. p. 198–206.
Perreault, S. 2020a. “Gender-based violence: Unwanted sexual behaviours in Canada’s territories, 2018.” Juristat. Statistics Canada Catalogue no. 85-002-X.
Perreault, S. 2020b. “Gender-based violence: Sexual and physical assault in Canada’s territories, 2018.” Juristat. Statistics Canada Catalogue no. 85-002-X.
Savage, L. 2021a. “Intimate partner violence: Experiences of women with disabilities in Canada, 2018.” Juristat. Statistics Canada Catalogue no. 85-002-X.
Savage, L. 2021b. “Intimate partner violence: Experiences of young women in Canada, 2018.” Juristat. Statistics Canada Catalogue no. 85-002-X.
Simpson, L. 2018. “Violent victimization and discrimination among visible minority populations, Canada, 2014.” Juristat. Statistics Canada Catalogue no. 85-002-X.
Statistics Canada. 2017. “Linguistic integration of immigrants and official language populations in Canada." Census in Brief. Statistics Canada Catalogue no. 98-200-X
Tabibi, J., Ahmad, S., Baker, L., and D. Lalonde. 2018. “Intimate partner violence against immigrant and refugee women.” Learning Network. Issue 26. London, Ontario. Centre for Research & Education on Violence Against Women & Children.
- Date modified: