
Intimate partner violence: Experiences of women with disabilities in Canada, 2018

Archived Content
Information identified as archived is provided for reference, research or recordkeeping purposes. It is not subject to the Government of Canada Web Standards and has not been altered or updated since it was archived. Please "contact us" to request a format other than those available.
by Laura Savage, Canadian Centre for Justice and Community Safety Statistics
Research has consistently shown that people with disabilities are more at risk of being a victim of violence than people without disabilities (Conroy and Cotter 2017; Cotter 2018; Cotter and Savage 2019; Harpur and Douglas 2014; Olofsson et al. 2015; Perreault 2015; Perreault 2020a; Platt et al. 2017). Recognizing that approximately 6.2 million Canadians—or 22% of Canadians aged 15 years and older—have one or more disabilities (Canadian Survey on Disability 2017), monitoring their experiences of violence is critical to developing policies that accurately reflect Canada’s population.
One type of violence is intimate partner violence (IPV); that is, violence perpetrated against a person by their current or former legally married spouse, common-law partner, or dating partner. IPV is a serious public health concern that encompasses a broad range of behaviours including emotional, psychological, financial, physical and sexual abuse, and has profound immediate and long-term impacts on survivors and victims (World Health Organization 2017).Note Although both women and men experience IPV, research to date has found that women experience the most severe forms of intimate partner violence (Burczycka 2019; Conroy 2021). Furthermore, homicide data have consistently shown that women victims of homicide in Canada are more likely to be killed by an intimate partner than by any other type of perpetrator, whereas men are more likely to be killed by someone other than an intimate partner (Roy and Marcellus 2019). Having a disability may increase some women’s vulnerability to intimate partner violence. For example, women with disabilities may experience an increased risk of isolation or an increased reliance on an intimate partner. The Canadian Survey on Disability (2017) found that women are consistently more likely to have a disability than men, regardless of age (Morris et al. 2018).
Using self-reported data from the 2018 Survey of Safety in Public and Private Spaces (SSPPS), this report builds on previous findings of IPV with a specific focus on the experiences of women with disabilities. Where possible, analysis will be conducted on the co-occurrence of disability across four categories: sensory (hearing or visual); physical (flexibility, mobility, dexterity, pain); cognitive (developmental, learning, memory); and mental health-related disability.Note This report explores the prevalence, nature, and impact of IPV on Canadians, taking into account experiences of IPV in one’s lifetime (since age 15), as well as in the 12 months preceding the survey.
This report is one in a series of reports highlighting the experiences of intimate partner violence among various populations based on data from the SSPPS. The other reports in this series focus on the experiences of women (Cotter 2021a), Indigenous women (Heidinger 2021), sexual minority women (Jaffray 2021a) and men (Jaffray 2021b), young women (Savage 2021b), and ethno-cultural minority women (Cotter 2021b). For other SSPPS data on violence committed outside the context of intimate partner relationships, see Cotter and Savage (2019), Perreault (2020a; 2020b), and Jaffray (2020).
Start of text box 1
Text box 1
Measuring and defining intimate partner violence
The Survey of Safety in Public and Private Spaces (SSPPS) collected information on Canadians’ experiences of intimate partner violence (IPV) since the age of 15 and in the 12 months that preceded the survey. The survey asked about a broad range of behaviours committed by intimate partners, including psychological, physical, and sexual violence. The definition of partner was also broad and included current and former legally married spouses, common-law partners, dating partners, and other intimate partner relationships.
In the SSPPS, intimate partner violence is defined as any act or behaviour committed by a current or former intimate partner, regardless of whether or not these partners lived together. In this article, intimate partner violence is broadly categorized into three types: psychological violence, physical violence, and sexual violence.
Psychological violence encompasses forms of abuse that target a person’s emotional, mental, or financial well-being, or impede their personal freedom or sense of safety. This category includes 15 specific types of abuse, including jealousy, name-calling and other put-downs, stalking or harassing behaviours, manipulation, confinement, or property damage (for a complete list of items included in this category, see Table 1A). It also includes being blamed for causing their partner’s behaviour, which was measured among those respondents who experienced certain forms of IPV.
Physical violence includes forms of abuse that involve physical assault or the threat of physical assault. In all, 9 types of abuse are included in this category, including items being thrown at the victim, being threatened with a weapon, being slapped, being beaten, and being choked (see Table 1A).
Sexual violence includes sexual assault or threats of sexual assault and was measured using two questions: being made to perform sex acts that the victim did not want to perform, and forcing or attempting to force the victim to have sex.
Physical and sexual intimate partner violence are sometimes collapsed into one category, particularly when data on IPV are combined with non-IPV data in order to derive a total prevalence of criminal victimization.
The analysis presented in this article takes an inclusive approach to the broad range of behaviours that comprise IPV. For the purposes of this analysis, those with at least one response of ‘yes’ to any item on the survey measuring IPV are included as having experienced intimate partner violence, regardless of the type or the frequency.
For more information on the measures of IPV in the SSPPS and other sources of data on intimate partner violence in Canada, see Cotter (2021a).
End of text box 1
More than half of women with disabilities have experienced some form of IPV in their lifetime
Intimate partner violence (IPV) includes violence like physical and sexual assault, as well as emotional, financial and psychological abuse. Although not all of these abusive behaviours rise to the threshold of criminal behaviour, emotional, financial and psychological abuse can cause profound emotional distress that can severely impact people’s everyday lives (Estefan et al. 2016; Sullivan et al. 2012).
According to the 2018 Survey of Safety in Public and Private Spaces (SSPPS), among people who had ever been in an intimate partnership,Note more than half (55%) of women with disabilities reported experiencing some form of IPV in their lifetime (since age 15Note ), compared to 37% of women without disabilities (Table 1A).Note Psychological abuse was by far the most commonly reported type of IPV experienced by women with disabilities (53%), followed by physical assault (32%) and sexual assault (18%). These proportions were considerably higher than those for women without disabilities (36%, 17% and 7%, respectively).
Among women with disabilities who experienced IPV in their lifetime, the most common abusive behaviours that they reported were being blamed for causing their partner’s abusive or violent behaviour (52%), being put down or called names (40%), their partner being jealous and not wanting them talking to other men or women (37%), being told they were crazy, stupid or not good enough (35%), and their partner demanding to know who they were with and where they were at all times (25%) (Table 1A). All of these behaviours were more commonly reported by women with disabilities than women without disabilities (41%, 25%, 24%, 21% and 15%, respectively).
Start of text box 2
Text box 2
Measuring disability in the Survey of Safety in Public and Private Spaces
The Survey of Safety in Public and Private Spaces (SSPPS) collects information on the general health and well-being of Canadians. Respondents are asked questions regarding any difficulties they may experience while performing daily activities. These questions—taken from the Canadian Survey on Disability—form the Disability Screening Questions module, which identifies respondents who have difficulties related to hearing, vision, mobility, flexibility, dexterity, learning, developmental, memory, pain, or mental health.
It should be noted that none of the categories of disability analyzed in this report are mutually exclusive. Respondents may have multiple types of disability and be included in more than one category. Therefore, while analyzing victimization data by type of disability is possible, direct comparisons between types of disability are not recommended. Of note, the SSPPS excludes full-time residents of institutions, such as prisons, residential care facilities, shelters, and other collective dwellings from its sampling frame. As such, findings may not be representative of the entire Canadian population with disabilities and, among other possible limitations, may be excluding those with relatively more severe disability. Further, for experiences of lifetime victimization, it is not possible to determine whether the violence took place before or after the onset of disability. It is also not possible to know whether or not the disability is a result of the violence.
For the purpose of this analysis, where possible, the different types of disabilities are grouped as follows:
Sensory disability: respondents who have difficulty seeing or hearing are considered to have a sensory disability.
Mental health disability: respondents who are sometimes, often, or always limited in their daily activities by an emotional, psychological, or mental health condition are considered to have a mental health-related disability.
Physical disability: respondents who have one or more difficulties related to dexterity, mobility, flexibility, or pain are considered to have a physical disability.
Cognitive disability: respondents who have one or more developmental, learning, or memory disability are considered to have a cognitive disability.
Unknown disability: includes all other types of disability that do not fall into any of the above categories. Due to small sample size and its limited analytical value, this category is not included in the analysis. However, it is included in the overall disabilities group.
End of text box 2
Women with disabilities nearly twice as likely to experience sexual or physical assault by an intimate partner in their lifetime
While physical and sexual assault were reported less often than psychological abuse, women with disabilities were far more likely than women without disabilities to be physically or sexually assaulted by an intimate partner during their lifetime (36% versus 19%, respectively) (Table 2).
Almost one-third (32%) of women with disabilities reported being physically assaulted by an intimate partner at least once since age 15 (Table 1A). The most common type of physical abuse reported by women with disabilities was being shaken, pushed, grabbed, or thrown (24%)—a proportion that was almost double that of women without disabilities (13%).
More than one in ten (15%) women with disabilities said that a partner had either forced or had tried to force them to have sex at some point since age 15, while 13% reported that a partner had made them perform sex acts that they did not want to perform (Table 1A). In comparison, these types of sexual assault were notably less common among women without disabilities (6% and 5%, respectively).
Women with disabilities more likely to have had more than one violent partner
While the majority (61%) of women with disabilities who had experienced intimate partner violence at some point in their lifetime said that the violence was committed by one partner, one-quarter (25%) said that they had two abusive partners since the age of 15. A small proportion of women with disabilities said that they had three (8%) or four (1%) abusive partners in their lifetime. Women without disabilities were more likely to report a single abusive partner (74%) and less likely to report two abusive partners (18%).
Almost half of women with disabilities say they have feared a partner at some point in their lifetime
The presence of disabilities can contribute to specific forms of intimate partner violence. Research has shown that women with disabilities are particularly vulnerable to IPV when their primary caregiver is an intimate partner (Harpur and Douglas 2014). An abusive partner might withhold mobility aids, medication, or restrict contact with family, friends and other external supports, leading the victim to feel trapped. In 2018, half (50%) of women with disabilities reported feeling controlled or trapped by a partner at some point in their lifetime, compared to 37% of women without disabilities. Of those who said that they had ever felt trapped or controlled by a partner, 12% of women with disabilities said that they currently felt this way, compared to 7% of women without disabilities.
Fear of a partner is an important measure of the severity of IPV. Almost half (45%) of women with disabilities reported ever being afraid of a partner, compared to 30% of women without disabilities. Of those who reported being afraid of a partner at some point during their life, 13% said that they were currently afraid of a partner, compared to 10% of women without disabilities.
Higher lifetime prevalence of IPV among women with disabilities, regardless of disability type
When looking at specific types of disability, almost seven in ten women with mental health-related (68%) or cognitive (65%) disabilities reported experiencing some form of IPV since age 15—proportions much higher than that of women without disabilities (37%). Further, half of women with sensory (51%) or physical (53%) disabilities had experienced IPV in their lifetime.
As noted, women with disabilities had a higher prevalence of each type of IPV compared to women without disabilities. This difference was most pronounced when looking at physical and sexual assault. The proportions of women with mental health-related (46%), cognitive (43%), sensory (36%), or physical (36%) disabilities who had experienced either physical or sexual IPV at least once since age 15 were much higher than that of women without disabilities (19%). Notably, three times more women with mental health-related disabilities reported experiencing either physical or sexual IPV in the 12 months preceding the survey, compared to women without disabilities (7% versus 2%).
The Disability Screening Questions module designates the severity of disability through a series of severity classes: mild, moderate, severe, and very severe. These classes are based on the number of disability types an individual has, the level of difficulty associated with the disability, and the frequency of the activity limitation.Note Women with disabilities—regardless of severity—had a higher prevalence of IPV than women without disabilities.Note Just over one-third (37%) of women without disabilities reported experiencing IPV at some point since age 15, compared to over half of women with mild (53%), moderate (57%), or severe/very severe (60%) disabilities. The mere presence of a disability impacts the risk of experiencing IPV, but there was no statistically significant difference between having moderate and severe/ very severe disabilities.
Co-occurrence of disability types associated with a higher prevalence of lifetime IPV
While direct comparisons between disability types are not recommended (see Text box 2), looking at the impact of having multiple disabilities on the risk of experiencing IPV can be examined. Although the presence of one disability increased the risk of experiencing intimate partner violence (IPV), the co-occurrence of two or more types of disability was associated with a considerably higher prevalence of lifetime IPV.
Approximately seven in ten (69%) women with either three or four types of disability reported experiencing some form of IPV since age 15. This was much higher than the proportions reported by women without disabilities (37%), women with one type of disability (51%) and women with two types of disabilities (60%).
Women with three or four types of disability were considerably more likely to experience physical assault by an intimate partner (50%) when compared to women without disabilities (18%), with one type of disability (28%) or with two types of disabilities (35%). Most notably, almost one-third (31%) of women with three or more types of disabilities had been a victim of sexual IPV—a proportion almost four times higher than that of women without disabilities (8%) and significantly higher than that of women with one disability (15%) and two disabilities (22%).
Almost two in ten women with disabilities experienced IPV in the previous year
In addition to providing a measure of experiences of IPV over the lifetime, the SSPPS also provides a more detailed look at experiences of IPV in the past year. In the 12 months preceding the survey, 16% of women with disabilities experienced some form of IPV, compared to 10% of women without disabilities (Table 1A; Table 2). Emotional, financial or psychological abuse (16%) was the most commonly reported form of IPV among women with disabilities, followed by physical abuse (4%) and sexual abuse (2%). This pattern was also seen among women without disabilities, though in all cases the prevalence was lower: women without disabilities most often experienced emotional, financial or psychological abuse (9%), followed by physical (2%) and sexual (0.5%) assault (Table 2).
Women with disabilities four times more likely to have been sexually assaulted by an intimate partner in the previous year
Women with disabilities reported experiencing physical and sexual assault more often than women without disabilities (Table 1A; Table 2). Being shaken, pushed, grabbed or thrown was the most common type of physical abuse experienced by women with disabilities (3%), followed by their partner threatening to hit them with their fist or anything that could hurt them (2%) (Table 1A). While the prevalence was lower, these were also the most common physical assault behaviours experienced by women without disabilities (0.9% and 0.7%, respectively).
Further, women with disabilities were four times more likely than women without disabilities to report experiencing sexual assault by an intimate partner in the 12 months preceding the survey (2% versus 0.5%, respectively) (Table 2).
Similar to what was seen in the lifetime prevalence data, women with disabilities most frequently reported being put down or called names (12%), being blamed for causing the abusive or violent behaviour (10%), and being told they were crazy, stupid or not good enough (9%) in the 12 months prior to the survey (Table 1A). Likewise, the most frequently reported behaviours by women without disabilities were being blamed for causing the abusive or violent behaviour (8%), being put down or called names (6%), and being told they were crazy, stupid or not good enough (6%) (Table 1A).
Majority of women with disabilities experienced IPV more than once in the previous year
The majority of women with disabilities who reported experiencing at least one form of IPV experienced it more than once in the 12 months preceding the survey (Table 1B). Most notably, seven in ten (70%) women with disabilities who were sexually assaulted by an intimate partner said that it happened more than once in the past 12 monthsNote (Table 1B).
Most (87%) women with disabilities experienced specific emotionally, financially, or psychologically abusive behaviours multiple times during the previous year. For example, over half (55%) of women with disabilities reported being harassed by phone, text, email or using social media on a monthly basis or more, along with 55% of those who were kept from seeing or talking to family or friends and 54% of those whose partner demanded to know who they were with and where they were at all times (Table 1B). Women without disabilities most commonly reported that their partner demanded to know who they were with and where they were at all times (45%), harassed them by phone, text, email, or using social media (40%), and blamed them for causing their abusive or violent behaviour (34%) on a monthly basis or more (Table 1B).
Almost six in ten (59%) women without disabilities said that their partner had damaged or destroyed their property “a few times” in the past 12 months. This was significantly higher than the proportion reported by women with disabilities (36%) (Table 1B).
Women with disabilities more likely to report emotional impacts of IPV
Intimate partner violence can have immediate and long-term emotional, psychological and physical impacts on victims, including feelings of anxiety, shock, fear, depression and suicidal thoughts (Chen and Ullman 2010; Haskell and Randall 2019). Respondents who reported experiencing IPV in the 12 months preceding the survey were asked about any emotional impacts resulting from the abuse.
Overall, the vast majority (94%) of women with disabilities said that the abuse had an emotional impact on them—a proportion similar to that of women without disabilities (91%) (Chart 1). Both women with and without disabilities often said that the abuse left them feeling hurt or disappointed (59% and 54%, respectively) and angry (53% and 52%). However, women with disabilities were far more likely than women without disabilities to say that the abuse had resulted in lowered self-esteem (44% versus 21%) and that the they were left feeling upset, confused, or frustrated (62% versus 52%).
Chart 1 start

Data table for Chart 1
| Impacts | Women with disabilitiesData table for Chart 1 Note † | Women without disabilities | ||
|---|---|---|---|---|
| percent | standard error | percent | standard error | |
| Incident had an emotional impact | 94.0 | 1.2 | 91.0 | 1.6 |
| Spoke with someone | 71.0 | 2.2 | 64.7Note * | 2.4 |
| Victim was injuredData table for Chart 1 Note 1 | 20.6 | 3.7 | 18.2 | 3.5 |
| Separated due to violence | 18.2 | 2.1 | 16.6 | 2.3 |
| Symptoms consistent with PTSD | 17.9 | 2.0 | 7.8Note * | 1.3 |
| Used or contacted a service | 16.5 | 2.1 | 8.5Note * | 1.4 |
Source: Statistics Canada, Survey of Safety in Public and Private Spaces. |
||||
Chart 1 end
People who experience physical and/or psychological trauma can develop post-traumatic stress disorderNote (PTSD) which is characterized by feelings of detachment, nightmares and avoidance behaviours.Note Research has suggested that victims of intimate partner violence are often diagnosed with PTSD (Dutton et al. 2006). According to the SSPPS, almost two in ten (18%) women with disabilities reported that they had symptoms consistent with PTSD in the past month as a result of the intimate partner violence. This proportion was more than twice as high as the proportion reported by women without disabilities (8%).
Self-reported victimization data show that violent crime often goes unreported to the police (Cotter and Savage 2019; Perreault 2015; Perreault 2020a). Consistent with previous findings, the vast majority (91%) of women with disabilities said that the violence did not come to the attention of the police—a proportion similar to that of women without disabilities (92%). Of those who said that the violence did come to the attention of the police, the majority said that they were either “very satisfied” or “somewhat satisfied” with the action that the police took (76% of women with disabilities and 69% of women without disabilities). Almost three-quarters (71%) of women with disabilities said that they spoke with someone about the incident—a proportion higher than that of women without disabilities (65%) (Chart 1).
In general, few victims of violence use or consult victim services,Note and this is also the case for the large majority of victims of IPV (Conroy and Cotter 2017; Cotter and Savage 2019; Perreault 2020a). Women with disabilities may face various barriers to using or consulting victim services, such as lack of information about available services and difficulties in accessing transportation (DAWN Canada 2014). The large majority (81%) of women with disabilities who had experienced IPV in the 12 months preceding the survey had not used or consulted a formal service in the past 12 months. The most common reasons given were that they did not need or want help (50%) or that the incident was too minor (37%). A small proportion of women with disabilities reported the fear of losing financial support (3%) as the reason why they did not use these services. However, overall, women with disabilities were more likely than women without disabilities to report using these services (16% versus 9%).
Start of text box 3
Text box 3
Experiences of intimate partner violence among men with disabilities
More than four in ten men with disabilities have experienced IPV in their lifetime
Men with disabilities are at an increased risk of experiencing intimate partner violence (IPV) compared to men without disabilities (Ballan et al. 2017; Mitra et al. 2015; Olofsson et al. 2015). Men with disabilities face many of the same barriers as women with disabilities when it comes to leaving an abusive partner. The stigma of seeking help as a male may further contribute to the barriers around leaving (Powers et al. 2008).
According to the Survey of Safety in Public and Private Spaces (SSPPS), more than four in ten (44%) men with disabilities reported experiencing some form of IPV since age 15—a proportion much higher than that of men without disabilities (32%). Mirroring what was seen among women, men with disabilities most often reported experiencing psychological abuse by an intimate partner (43%), followed by physical assault (23%) and sexual assault (4%).
In the 12 months preceding the survey, 15% of men with a disability experienced some form of IPV, compared to 10% of men without a disability. Men with disabilities were twice as likely as men without disabilities to be physically assaulted by an intimate partner in the past 12 months (4% versus 2%, respectively) and five times more likely to be sexually assaulted (1% versus 0.2%).
Men with three or more disabilities are more at risk for experiencing lifetime IPV
As was seen among women with disabilities, the co-occurrence of disability (i.e. having two or more disabilities) was associated with a higher prevalence of lifetime IPV. Men with three or more disabilities were much more likely to report experiencing IPV since age 15 than men without disabilities and men with one or two disabilities (56% versus 32%, 42% and 47%, respectively).
This was also the case for physical and sexual IPV. Almost four in ten (37%) men with three or more disabilities reported being physically or sexually assaulted by an intimate partner at least once since age 15. This proportion was significantly higher than those of men without disabilities (14%), men with one disability (20%) and men with two disabilities (27%).
When it came to IPV experienced in the past 12 months, men with three or more disabilities were just as likely as men with one disability and men with two disabilities to have been psychologically, physically or sexually abused by an intimate partner.
Large majority of men with disabilities report that the IPV had an emotional impact on them
Mirroring what was seen among women, the vast majority (90%) of men with disabilities—who had been psychologically, physically or sexually abused by an intimate partner in the past 12 months—said that the IPV had an emotional impact on them. This was slightly higher than the proportion of men without disabilities who said that they had been emotionally impacted by the IPV (83%). One in ten (10%) men with disabilities who had experienced IPV in the past 12 months reported symptoms consistent with post-traumatic stress disorder (PTSD) in the past month. This was five times more than the proportion of men without disabilities (2%).
End of text box 3
The prevalence of IPV much higher among certain populations
The risk of experiencing violent victimization is not the same for every person. Factors such as age, gender, race, disability, sexual orientation and immigrant status all intersect and can impact the likelihood of experiencing intimate partner violence. For instance, the prevalence of IPV is significantly higher among women with disabilities, sexual minority women (see Jaffray 2021a) sexual minority men (see Jaffray 2021b), young women (see Savage 2021b), and Indigenous women (see Heidinger 2021).
Women with disabilities are at a higher risk of experiencing violent victimization due to certain socioeconomic characteristics. For example, women with disabilities are less likely than women without disabilities to have some form of post-secondary education, are less likely to be participating in the labour force, and tend to have lower average personal income (Burlock 2017; Morris et al. 2018; Turcotte 2014).Note Two-thirds (66%) of women with disabilities who reported a household income of $20,000 or lower reported experiencing IPV at some point in their lifetime, compared to 44% of women without disabilities. Low socio-economic status may severely impact a person’s ability to leave a violent relationship (Kim and Gray 2008).
Indigenous (First Nations, Métis, and Inuit) women with disabilities (74%) and women without disabilities (46%) were more likely to have experienced intimate partner violence in their lifetime than their non-Indigenous counterparts (54% and 37%, respectively) (Table 3). For more information, see Heidinger (forthcoming 2021).
Among LGBTQ2 women with disabilities, almost seven in ten (71%) reported that they had experienced some form of intimate partner violence since age 15. This was significantly higher than the proportion of women with disabilities who were not LGBTQ2 (54%) and the proportion of women without disabilities who were LGBTQ2 (59%). For information specific to sexual minority women and their experiences of IPV, see Jaffray (2021a) and Ibrahim (2019).
Previous research has shown an association between childhood maltreatmentNote and an increased risk of victimization in adulthood (Burczycka and Conroy 2017; Parks et al. 2011; Widom et al. 2008). This was also the case with IPV: experiencing physical or sexual abuse before age 15 was associated with experiences of IPV in adulthood, both in the 12 months preceding the survey and since age 15. Approximately seven in ten (71%) women with disabilities who had been victims of IPV had also been victims of childhood physical or sexual abuse, compared to 61% of women without disabilities (Table 3). These proportions are significantly higher than those of women with disabilities and women without disabilities who had not experienced childhood physical or sexual abuse (45% and 30%, respectively).Note More specifically, around half of women with disabilities who were sexually (50%) or physically (48%) assaulted before age 15 reported experiencing some form of IPV in their lifetime. In contrast, lower proportions of women without disabilities who had been sexually (35%) or physically (32%) assaulted before age 15 reported experiencing IPV.
Exposure to IPV between parents and caregivers during childhood has been associated with increased risk of mental health problems, delinquency, and intergenerational violence in intimate partner relationships (Cater et al. 2009; Howell et al. 2016; Milletich et al. 2010). In the SSPPS, witnessing violence between parentsNote during childhood was linked to an increased risk of experiencing IPV in adulthood. Almost three-quarters (72%) of women with disabilities who witnessed violence between their parents or guardians during childhood reported experiencing some form of IPV since age 15, compared to 52% of women with disabilities who did not witness any violence.
Research has found that visible minority populations tend to be at a lower risk of experiencing violent victimization than non-visible minority populations (Simpson 2018). This is also the case with IPV, regardless of disability status (Table 3). Just under four in ten (38%) visible minority women with disabilities reported experiencing at least one instance of IPV since age 15, compared to almost six in ten (58%) non-visible minority women with disabilities. This was similar for women without disabilities: about one-quarter (26%) of visible minority women experienced IPV compared to 40% of non-visible minority women (Table 3). However, when looking at the prevalence of IPV in the 12 months preceding the survey, both visible minority and non-visible minority women with disabilities experienced similar levels of IPV (15% and 16%, respectively).
The lower rates of victimization among the visible minority population tends to be largely driven by the lower prevalence among immigrant visible minorities (Cotter 2021b; Ibrahim 2018). Research shows that more than half of immigrant victims of violent crime did not report the incident to police (Ibrahim 2018). Some immigrants may not feel comfortable talking to the police about their victimization for fear of being reported to immigration authorities and facing deportation, distrust of authorities, and cultural norms (Ibrahim 2018). In the SSPPS, almost four in ten (39%) immigrant women with disabilities reported experiencing some form of IPV since age 15—a proportion significantly lower than non-immigrant women with disabilities (59%) and similar to non-immigrant women without disabilities (41%) (Table 3). For information specific to visible minority immigrant women and their experiences of IPV, see Cotter (2021b).
Start of text box 4
Text box 4
Lifetime violent victimization
More than half of women with disabilities have been physically or sexually assaulted in their lifetime
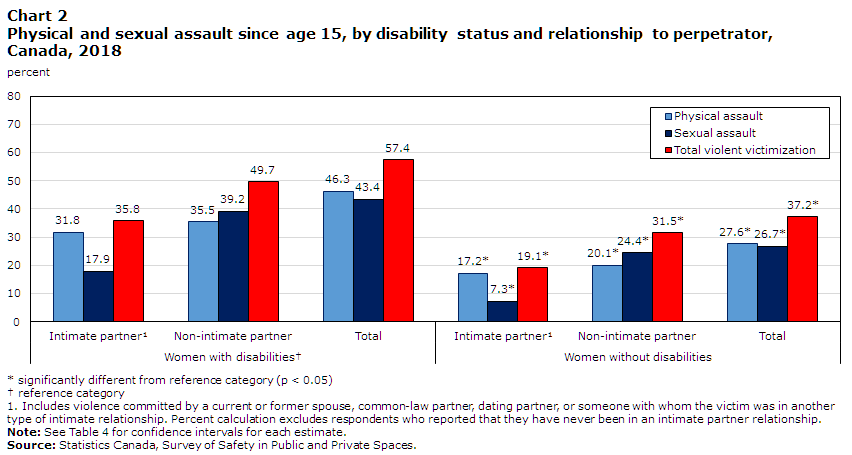
Women with disabilities were far more likely than women without disabilities to experience all types of violent victimization (Table 4; Chart 2). Including violence committed by intimate partners and violence committed by other perpetrators, 57% of women with disabilities reported that they had been physically or sexually assaulted at least once since the age of 15, compared to 37% of women without disabilities (Table 4).
Chart 2 start
Data table for Chart 2
| Physical assault | Sexual assault | Total violent victimization | ||
|---|---|---|---|---|
| percent | ||||
| Women with disabilitiesData table for Chart 2 Note † | Intimate partnerData table for Chart 2 Note 1 | 31.8 | 17.9 | 35.8 |
| Non-intimate partner | 35.5 | 39.2 | 49.7 | |
| Total | 46.3 | 43.4 | 57.4 | |
| Women without disabilities | Intimate partnerData table for Chart 2 Note 1 | 17.2Note * | 7.3Note * | 19.1Note * |
| Non-intimate partner | 20.1Note * | 24.4Note * | 31.5Note * | |
| Total | 27.6Note * | 26.7Note * | 37.2Note * | |
Source: Statistics Canada, Survey of Safety in Public and Private Spaces. |
||||
Chart 2 end
Understanding experiences of violent victimization across the life course is important when it comes to understanding the population, developing services and programs, and predicting mental and physical health needs.
Overall, almost half (46%) of women with disabilities reported being physically assaulted at least once, and more than four in ten (43%) had been sexually assaulted since age 15. In contrast, 28% of women without disabilities reported being physically assaulted, and 27% reported being sexually assaulted at least once since age 15 (Table 4; Chart 2).
The most common type of assault differed depending on the type of relationship. In the context of intimate relationships, physical assault was more common than sexual assault for both women with disabilities (32% versus 18%, respectively) and women without disabilities (17% versus 7%, respectively). However, in non-intimate relationships, sexual assault was slightly more common than physical assault (Table 4; Chart 2).
Women with disabilities twice as likely to experience sexual or physical assault in the 12 months preceding the survey
Almost one in ten (9%) women with disabilities experienced physical or sexual assault—committed by either an intimate partner or non-intimate partner—in the 12 months preceding the survey, compared to 4% of women without disabilities (Table 5).
In the context of intimate partner relationships, 4% of women with disabilities reported being physically assaulted at least once, while 2% reported being sexually assaulted at least once in the past year. In contrast, 2% of women without disabilities reported being physically assaulted by an intimate partner in the 12 months prior to the survey, while 0.5% said that they had been sexually assaulted at least once during this timeframe (Table 5).
Lifetime physical and sexual IPV more common among women with disabilities in every province and territory, except Nunavut
In almost all provinces and territories, women with disabilities were more likely to report being a victim of physical or sexual IPV at some point since age 15 than women without disabilities (Table 6).Note Nunavut was the exception—there was no statistically significant difference in the prevalence of physical or sexual IPV among women with and without disabilities.
In every province, women with disabilities were almost twice as likely as women without disabilities to report experiencing physical or sexual assault by an intimate partner at least once since age 15 (Table 6). The biggest differences were seen in Prince Edward Island (40% versus 19%), Nova Scotia (43% versus 22%), New Brunswick (38% versus 19%), Saskatchewan (41% versus 22%) and British Columbia (41% versus 22%) (Table 6).
Women with disabilities living in the territories were far more likely than women without disabilities to report experiencing physical or sexual IPV. This was especially true for women living in Yukon (57% versus 28% of women who did not have disabilities) and the Northwest Territories (54% versus 37%) (Table 6).
End of text box 4
Detailed data tables
Survey description
In 2018, Statistics Canada conducted the first cycle of the Survey of Safety in Public and Private Spaces (SSPPS). The purpose of the survey is to collect information on Canadians’ experiences in public, at work, online, and in their intimate partner relationships.
The target population for the SSPPS is the Canadian population aged 15 and older, living in the provinces and territories. Canadians residing in institutions are not included. This means that the survey results may not reflect the experiences of intimate partner violence among those living in shelters, institutions, or other collective dwellings. Once a household was contacted, an individual 15 years or older was randomly selected to respond to the survey.
In the provinces, data collection took place from April to December 2018 inclusively. Responses were obtained by self-administered online questionnaire or by interviewer-administered telephone questionnaire. Respondents were able to respond in the official language of their choice. The sample size for the 10 provinces was 43,296 respondents. The response rate in the provinces was 43.1%.
In the territories, data collection took place from July to December 2018 inclusively. Responses were obtained by self-administered online questionnaire or by interviewer-administered in-person questionnaire. Respondents were able to respond in the official language of their choice. The sample size for the 3 territories was 2,597 respondents. The response rate in the territories was 73.2%.
Non-respondents included people who refused to participate, could not be reached, or could not speak English or French. Respondents in the sample were weighted so that their responses represent the non-institutionalized Canadian population aged 15 and older.
Data limitations
As with any household survey, there are some data limitations. The results are based on a sample and are therefore subject to sampling errors. Somewhat different results might have been obtained if the entire population had been surveyed.
For the quality of estimates, the lower and upper bounds of the confidence intervals are presented. Confidence intervals should be interpreted as follows: If the survey were repeated many times, then 95% of the time (or 19 times out of 20), the confidence interval would cover the true population value.
References
Ballan, M., Burke Freyer, M. and L. Powledge. “Intimate Partner Violence Among Men With Disabilities: The Role of Health Care Providers.” American Journal of Men’s Health. Vol. 11, no. 5. p. 1436-1443.
Burczycka, M. and S. Conroy. 2017. “Family violence in Canada: A statistical profile, 2015.” Juristat. Statistics Canada Catalogue no. 85-002-X.
Burczycka, M. 2019. “Police-reported intimate partner violence in Canada, 2018.” In Family violence in Canada: A statistical profile, 2018. Juristat. Statistics Canada Catalogue no. 85-002-X.
Burczycka, M. 2018. “Violent victimization of Canadians with mental health-related disabilities, 2014.” Juristat. Statistics Canada Catalogue no. 85-002-X.
Burlock, A. 2017. “Women with disabilities.” Women in Canada: A Gender-based Statistical Report. Statistics Canada Catalogue no. 89-503-X.
Cater, A.K., Miller, L.E., Howell, K.H. and Graham-Bermann, S.A. 2015. “Childhood exposure to intimate partner violence and adult mental health problems: Relationships with gender and age of exposure.” Journal of Family Violence. Vol. 30, no. 7. p. 875.
Chen, Y. and S. E. Ullman. 2010. “Women’s reporting of sexual and physical assaults to police in the National Violence Against Women Survey.” Violence Against Women. Vol. 16, no. 3. p. 262-279.
Conroy, S. and Cotter, A. 2017. “Self-reported sexual assault in Canada, 2014.” Juristat. Statistics Canada Catalogue no. 85-002-X.
Conroy, S. 2021. “Family violence in Canada: A statistical profile, 2019.” Juristat. Statistics Canada Catalogue no. 85-002-X.
Cotter, A. and Savage, L. 2019. “Gender-based violence and inappropriate sexual behaviour in Canada, 2018: Initial findings from the Survey of Safety in Public and Private Spaces.” Juristat. Statistics Canada Catalogue no. 85-002-X.
Cotter, A. 2021a. “Intimate partner violence in Canada, 2018.” Juristat. Statistics Canada Catalogue no. 85-002-X.
Cotter, A. 2021b. “Intimate partner violence in Canada, 2018: Experiences of visible minority women.” Juristat. Statistics Canada Catalogue no. 85-002-X.
Cotter, A. 2018. “Violent victimization of women with disabilities, 2014.” Juristat. Statistics Canada Catalogue no. 85-002-X.
DAWN Canada. 2014. Women with Disabilities and Violence. (accessed 16 March 2021).
Dutton, M. A., Green, B., Kaltman, S., Roesch, D., Zeffiro, T. and Krause, E. 2006. “Intimate partner violence, PTSD, and adverse health outcomes.” Journal of Interpersonal Violence. Vol. 21, no. 7. p. 955-968.
Estefan, L. F., Coulter, M. L. and VandeWeerd, C. 2016. "Depression in women who have left violent relationships: The unique impact of frequent emotional abuse." Violence Against Women. Vol. 22, no. 11. p. 1397-1413.
Harpur, P. and Douglas, H. 2014. “Disability and domestic violence: Protecting survivors’ human rights.” Griffith Law Review. Vol. 23, no. 3. p. 405-433.
Haskell, L. and M. Randall. 2019. The Impact of Trauma on Adult Sexual Assault Victims. Department of Justice Canada.
Heidinger, L. 2021. “Intimate partner violence: Experiences of First Nations, Métis and Inuit women in Canada, 2018.” Juristat. Statistics Canada Catalogue no. 85-002-X.
Howell, K.H., Barnes, S.E., Miller, L.E. and Graham-Bermann, S.A. 2016. “Developmental variations in the impact of intimate partner violence exposure during childhood.” Journal of Injury and Violence Research. Vol. 8, no. 1. p. 43-57.
Ibrahim, D. 2018. “Violent victimization, discrimination, and perceptions of safety: An immigrant perspective, Canada, 2014.” Juristat. Statistics Canada Catalogue no. 85-002-X.
Ibrahim, D. 2019. “Police-reported violence among same-sex intimate partners in Canada, 2009 to 2017.” Juristat. Statistics Canada Catalogue no. 85-002-X.
Jaffray, B. 2021a. “Intimate partner violence: Experiences of sexual minority women in Canada, 2018.” Juristat. Statistics Canada Catalogue no. 85-002-X.
Jaffray, B. 2021b. “Intimate partner violence: Experiences of sexual minority men in Canada, 2018.” Juristat. Statistics Canada Catalogue no. 85-002-X.
Jaffray, B. 2020. “Experiences of violent victimization and unwanted sexual behaviours among sexual minority and transgender Canadians, 2018.” Juristat. Statistics Canada Catalogue no. 85-002-X.
Kim, J. and K. A. Gray. 2008. “Leave or stay? Battered women’s decision after intimate partner violence.” Journal of Interpersonal Violence. Vol. 23, no. 10. p. 1465-1482.
Miletich, R.K., Kelley, M.L., Doane, A.N., and Pearson, M.R. 2010. “Exposure to interparental violence and childhood physical and emotional abuse as related to physical aggression in undergraduate dating relationships.” Journal of Family Violence. Vol. 25, no. 7. p. 627-637.
Mitra, M., Mouradian, V.E., Fox, M.H., and Pratt, C. 2016. “Prevalence and characteristics of sexual violence against men with disabilities.” American Journal of Preventive Medicine. Vol. 50, no. 3. p. 311-317.
Morris, S., Fawcett, G., Brisebois, L. and Hughes, J. 2018. “A demographic, employment and income profile of Canadians with disabilities aged 15 years and over, 2017.” Canadian Survey on Disability Reports. Statistics Canada Catalogue no. 89-654-X.
Olofsson, N., Lindqvist, K. and Danielsson, I. 2015. “Higher risk of violence exposure in men and women with physical or sensory disabilities: Results from a public health survey.” Journal of Interpersonal Violence. Vol. 30, no. 10. p. 1671-1686.
Parks, S. E., Kim, K. H., Day, N. L., Garza, M. A. and Larkby C. A. 2011. “Lifetime self-reported victimization among low-income, urban women: The relationship between childhood maltreatment and adult violent victimization.” Journal of Interpersonal Violence. Vol. 26, no. 6. p. 1111-1128.
Perreault, S. 2015. “Criminal victimization in Canada, 2014.” Juristat. Statistics Canada Catalogue no. 85-002-X.
Perreault, S. 2020a. “Gender-based violence: Unwanted sexual behaviours in Canada’s territories, 2018.” Juristat. Statistics Canada Catalogue no. 85-002-X.
Perreault, S. 2020b. “Gender-based violence: Sexual and physical assault in Canada’s territories, 2018.” Juristat. Statistics Canada Catalogue no. 85-002-X.
Platt, L., Powers, L., Leotti, S., Hughes, R. B., Robinson-Whelen, S., Osborn, S., Ashkenazy E., Beers L., Lund E. and Nicolaidis C. 2017. “The role of gender in violence experienced by adults with developmental disabilities.” Journal of Interpersonal Violence. Vol. 32, no. 1. p. 101-129.
Powers, L.E., Curry, M.A., McNeff, E., Saxton, M., Powers, J.L., and Oschwald, M. 2008. “End the silence: A survey of abuse against men with disabilities.” Journal of Rehabilitation. Vol. 74, no. 4. p. 41-53.
Roy, J. and Marcellus, S. 2019. “Homicide in Canada, 2018.” Juristat. Statistics Canada Catalogue no. 85-002-X.
Savage, L. 2021b. “Intimate partner violence: Experiences of young women in Canada, 2018.” Juristat. Statistics Canada Catalogue no. 85-002-X.
Simpson, L. 2018. “Violent victimization and discrimination among visible minority populations, Canada, 2014.” Juristat. Statistics Canada Catalogue no. 85-002-X.
Statistics Canada. 2017. “Persons with and without disabilities aged 15 years and over, by age group and sex, Canada, provinces and territories.” Canadian Survey on Disability. Data table 13-10-0374-01. (accessed 17 December 2020).
Sullivan, T. P., McPartland, T. S., Armeli, S., Jaquier, V. and Tennen, H. 2012. “Is it the exception or the rule? Daily co-occurrence of physical, sexual and psychological partner violence in a 90-day study of substance-using, community women.” Psychology of Violence. Vol. 2, no. 2. p. 154-164.
Turcotte, M. 2014. “`Persons with disabilities and employment.” Insights on Canadian Society. Statistics Canada Catalogue no. 75-006-X.
Widom, C. S., Czaja, S. J. and M. A. Dutton. 2008. “Childhood victimization and lifetime revictimization.” Child Abuse & Neglect. Vol. 32, no. 8. p. 785-796.
World Health Organization. 2017. Violence Against Women. (accessed 24 February 2021).
- Date modified: