
Police-reported hate crime in Canada, 2018

Archived Content
Information identified as archived is provided for reference, research or recordkeeping purposes. It is not subject to the Government of Canada Web Standards and has not been altered or updated since it was archived. Please "contact us" to request a format other than those available.
by Greg Moreau
Highlights
- Canada is an increasingly multicultural and diverse country, with a growing proportion of Canadians who are members of visible minority groups, whose mother tongue is not English or French, or who are affiliated with non-Christian religions. This increase is projected to continue in the coming years.
- In 2018, police reported 1,798 criminal incidents in Canada that were motivated by hate. Hate crimes accounted for less than 0.1% of the over 2.0 million police-reported crimes in 2018 (excluding traffic offences).
- The number of police-reported hate crimes decreased by 13%, or 275 fewer incidents, compared to the previous year. With the exception of 2017, the number of hate crimes in 2018 was higher than any other year in the past 10 years.
- The decrease in the total number of incidents was largely attributable to a decrease in police-reported hate crimes motivated by hatred of a religion (-203 incidents).
- Compared with 2017, the number of police-reported hate crimes motivated by religion declined by 24% in 2018, from 842 to 639. This decrease was largely due to fewer police-reported crimes motivated by hate against the Muslim population, which declined from 349 incidents to 173 incidents in 2018 (-50%). Hate crimes against the Jewish population declined slightly in 2018 after two years of increases, from 360 to 347 incidents (-4%).
- Between 2017 and 2018, the number of police-reported crimes motivated by hatred of a race or ethnicity decreased 11%, from 878 to 780. Much of this decrease was a result of fewer hate crimes targeting the Black (-38 incidents) and Arab and West Asian populations (-31 incidents). Hate crimes targeting the Black population remained one of the most common types of hate crimes (16% of all hate crimes).
- Police-reported violent hate crimes against Indigenous and Muslim populations more likely than other hate crimes to involve female victims.
- Police-reported hate crimes targeting sexual orientation declined 15% in 2018 to 173 incidents, compared with 204 incidents in 2017.
- The provinces of Ontario (-261 incidents) and Quebec (-36 incidents), and more specifically the census metropolitan areas (CMAs) of Toronto (-155 incidents) and Montréal (-35 incidents), accounted for much of the national decrease. Changes in the Toronto CMA were driven by decreases in crimes motivated by hatred of the Muslim (-71 incidents), Jewish (-31 incidents) and Black (-18 incidents) populations. For Montréal, the decrease observed in 2018 was attributable primarily to fewer hate crimes targeting the Muslim population (-32 incidents) and gay and lesbian community (-8 incidents).
- Based on data from police services that reported characteristics of hate crimes, a 21% decrease in non-violent hate crimes accounted for much of the national decrease. Non-violent hate crimes accounted for 57% of all hate crimes in 2018. The number of non-violent hate crimes fell from 1,239 to 978 incidents, primarily driven by a decrease in general mischief (-26%). Violent hate crime decreased 2% in 2018 compared to 2017, however total assault increased 6% year-over-year.
- In 2018, a total of 31% of hate crime incidents were cleared, meaning solved. Of those incidents that were cleared, 68% resulted in charges laid against one or more individuals, and 32% were cleared otherwise, meaning an accused was identified but a charge was not laid. In comparison, among all Criminal Code violations (excluding traffic violations), 40% were solved by police, with 65% cleared by charges laid and 35% cleared otherwise.
- Police-reported hate crime targeting sexual orientation (64%), the South Asian (64%), the Arab and West Asian (63%), and the East and Southeast Asian (56%) populations was more likely to be violent than non-violent, according to data reported from 2010 to 2018. In contrast, police-reported crimes against the Catholic (92%), Jewish (84%), Black (60%) and Muslim (60%) populations were more likely to be non-violent violations, primarily mischief.
- According to data from 2010 to 2018, police-reported violent hate crime against Indigenous (45%) and Muslim (45%) populations was more likely to involve female victims relative to hate crime targeting other populations.
Canada is an increasingly multicultural and diverse country. According to the 2016 Census data, 22.3% of Canadians reported being members of a visible minority group, an increase of 3 percentage points since the 2011 National Household Survey.Note First Nations people, Métis and InuitNote comprised 4.9% of the population in 2016, up from 4.3% in 2011 (Statistics Canada 2013a). The proportion of people who reported religious affiliations other than Christianity has also grown. In 2011, 7.2% of the Canadian population identified as Muslim, Hindu, Sikh or Buddhist compared to 4.9% in 2001.Note The Jewish population has remained stable at 1% from 2001 to 2011 (Statistics Canada 2013b).
Canada's population is expected to become even more multicultural and diverse in the coming decades. The proportion of Canadians who are members of visible minority groups and the proportion who are affiliated with non-Christian religions are expected to continue to increase. In particular, by 2036, more than one in three working-age Canadians (15 to 64 years of age) are expected to be a member of a visible minority group, and the number of Canadians with a non-Christian religion is expected to almost double from 9% in 2011 to between 13% and 16% of the population in 2036 (Statistics Canada 2017a). It is also expected that over half the immigrants in Canada will be of Asian origin (Statistics Canada 2017a). South Asian and Chinese populations are expected to continue to be the largest visible minority groups in Canada, while Arab and West Asian populations are expected to grow the fastest over the next two decades (Statistics Canada 2017a).
Despite the increase in diversity in Canada, hate crimes account for a very small proportion of all crime reported by police each year, making up 0.1% of all police-reported crimes. However, the demographic evolution occurring in Canada may increase the potential for more hate crimes (Chongatera 2013; Putnam 2007). Additionally, hate crimes target the integral and visible parts of a person's identity and may affect not only the individual but also the wider community, potentially creating a community of victims (Office for Democratic Institutions and Human Rights 2018; Perry 2010). As this behaviour affects not just individuals but also their communities and society generally, hate crimes are a focus of social concern in Canada and other countries. As a member of the Office for Democratic Institutions and Human Rights of the Organization for Security and Co-operation in Europe, Canada works with other countries to monitor and combat hate crimes (Office for Democratic Institutions and Human Rights 2014).Note As such, an accurate picture of diversity in Canada may help to contextualize information on hate crimes.
This Juristat article presents the most recent trends in police-reported hate crime in Canada using data from the Uniform Crime Reporting Survey (see Text box 1). More specifically, this article examines the number of hate crime incidents reported by police in 2018 as well as the characteristics of these incidents, the victims and the accused involved.Note
This article was made possible with funding from the Department of Canadian Heritage.
Start of text box 1
Text box 1
Police-reported hate crime statistics
Definition and coverage
The Uniform Crime Reporting (UCR) Survey collects police-reported crimes, including information on hate crimes. The UCR defines police-reported hate crime as follows:
"Police-reported hate crime is defined as a criminal violation against a person or property motivated by hate, based on race, national or ethnic origin, language, colour, religion, sex, age, mental or physical disability, sexual orientation or gender identity or expression, or any other similar factor."
In addition to police-reported incidents that involve a hate crime motivation, there are four specific offences listed as hate propaganda and hate crimes in the Criminal Code of Canada: advocating genocide; incitement of hatred in a public place that is likely to lead to a breach of the peace [public incitement of hatred]; wilful promotion of hatred, all when directed against an identifiable group, and; mischief motivated by hate in relation to property primarily used for religious worship that, in late 2017, was expanded to include certain other kinds of property primarily used by an identifiable group.Note In addition, subparagraph 718.2(a)(i) of the Criminal Code allows for increased penalties when sentencing any criminal offence, such as assault or mischief, where there is evidence that the offence was motivated by bias, prejudice or hatred based on various criteria as set out in that subparagraph. These are also considered hate crimes.Note
Since 2005, Statistics Canada has collected data on hate crimes according to this standard definition from police services in Canada via the UCR. As per Bill C-16 "An Act to amend the Canadian Human Rights Act and the Criminal Code", the definition of hate crime was amended in 2017 to add gender identity or expression as a motivation. This updated definition of hate crime was endorsed by the Canadian Association of Chiefs of Police and is the standard used for data collection purposes as well as training by police services across Canada. Statistics Canada has worked closely with hate crime experts and the policing community Canada-wide to build standards and guidelines in identifying and reporting hate-motivated crimes.
Police-reported hate crimes are reported as criminal incidents. A criminal incident involves one or more related offences that are committed during a single criminal event and have been reported to police. Where there are multiple victims or accused within a single criminal event, one incident is still recorded, with multiple victim or accused records linked to it. For example, a single incident involving an assault on three victims at the same time and location is counted as one incident of assault. When analyzing victim counts, there would be a count of three victims of assault.Note
Determination of a hate crime by police
Within the UCR Survey, depending on the level of evidence at the time of the incident, police can record the incident as either a "suspected" or "confirmed" hate-motivated crime. As more information is gathered, incidents are reviewed and verified and as a result, their status may be reclassified. This analysis includes crimes that have been confirmed to be or are strongly suspected to be motivated by hate. Suspected hate crimes may include criminal incidents that cannot be confirmed as hate crimes, but for which there is sufficient evidence to suspect that they are motivated by hate, e.g., hate graffiti where no accused has been identified.
It is important to note that victims of hate crimes targeting specific populations are not necessarily members of those specific populations. For example, if someone is assaulted and there is anti-Muslim language used during the assault, the hate crime will be considered anti-Muslim whether or not the victim is Muslim. The hate crime is classified by the perception of the accused, not by the victim's characteristics.
Interpretation of police-reported numbers
Police data on hate-motivated crimes include only those incidents that come to the attention of police services and also depend on police services' level of expertise in identifying crimes motivated by hate. As a result, an increase in numbers may be related to more reporting by the public to the authorities (for example, as a result of outreach by police to communities or heightened sensitivity after high profile events), and/or a true increase in the extent of hate crimes being committed. As with other crimes, self-reported data provide another way of monitoring hate-motivated crimes. According to the 2014 General Social Survey on Canadian's Safety (Victimization), Canadians self-reported being the victim of over 330,000 criminal incidents that they perceived as being motivated by hate (5% of the total self-reported incidents) in the 12 months preceding the survey. Two-thirds of these incidents were not reported to the police (see Text box 2).
Over the past two decades, police services across Canada have continued to advance their identification and reporting of hate crime incidents. Based on publicly available information, as of January 2020, 15 of the 20 largest municipal police services in Canada had dedicated hate crime units or hate crime officers. Moreover, in an effort to try to address the under-reporting of hate crimes, a growing number of non-governmental organizations are developing innovative methods to encourage the reporting of hate. In 2017, for example, the Alberta Hate Crimes Committee (AHCC) launched the StopHateAB.ca website to encourage reporting of hate incidents in order to support strategies that foster a public social environment of justice, equity, and human rights. As such, changes in reporting practices can have an effect on hate crime statistics. It is therefore important to recognize that, according to police services, higher rates of police-reported hate crime in certain jurisdictions may reflect differences or changes in the recognition, reporting and investigation of these incidents by police and community members.
Due to the impact of changes in reporting practices and the variability of hate crime, particularly by motivation or in jurisdictions where numbers are small, changes over time should be interpreted with caution. Because of this variability, some analysis of characteristics of hate crime incidents, victims and accused in this article is based on total hate crimes reported from 2010 to 2018.
End of text box 1
Hate-motivated crimes down after peaking in 2017, but still higher than in 2016
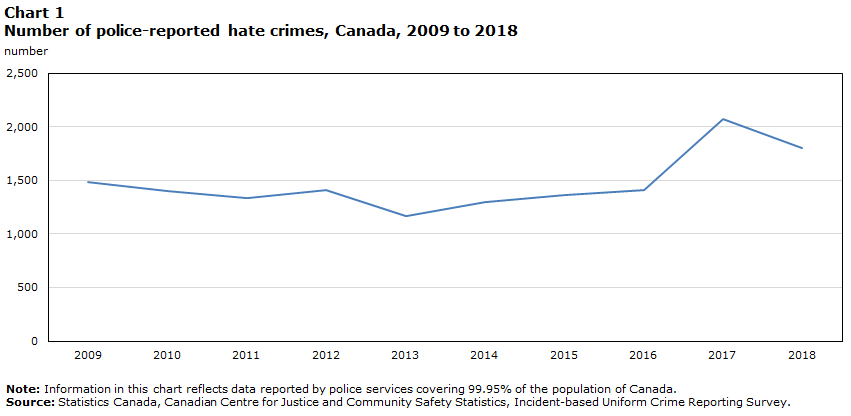
Following a 47% increase in 2017, the number of police-reported hate crimes in Canada was down 13% in 2018, from 2,073 incidents to 1,798, or 275 fewer incidents. Despite the decline, the number of hate crimes remained higher than any other year since 2009 (with the exception of 2017), and aligns with the upward trend observed beginning in 2014. The year-over-year decrease was almost entirely a result of declines in Ontario, with 261 fewer incidents marking a 26% decline from 2017. Nationally, the number of hate crimes targeting the Muslim population fell 50% after spiking in 2017 due to large increases in Ontario and Quebec. In 2018, there were also fewer police-reported hate crimes targeting Blacks (-12%) and fewer targeting sexual orientation (-15%). Hate crimes targeting the Jewish population accounted for 19% of hate crimes in 2018, down 4% from 2017. In 2018, non-violent hate crimes (-21%) declined more than violent hate crimes (-2%).
Since the availability of comparable data in 2009, the number of police-reported hate crimes has ranged from a low of 1,167 incidents in 2013 to a high of 2,073 in 2017. Following a decrease in 2013, the number of hate crimes has been trending upward. On average, there have been approximately 1,473 hate crime incidents reported annually by police since 2009 (Chart 1). Although changes over time could reflect real increases in the number of hate crimes, differences or changes in the recognition, reporting by victims and investigation of these incidents by police and community members could also have had an impact on these trends (see Text box 1).
Chart 1 start
Data table for Chart 1
| Year | Number |
|---|---|
| 2009 | 1,482 |
| 2010 | 1,401 |
| 2011 | 1,332 |
| 2012 | 1,414 |
| 2013 | 1,167 |
| 2014 | 1,295 |
| 2015 | 1,362 |
| 2016 | 1,409 |
| 2017 | 2,073 |
| 2018 | 1,798 |
|
Note: Information in this chart reflects data reported by police services covering 99.95% of the population of Canada. Source: Statistics Canada, Canadian Centre for Justice and Community Safety Statistics, Incident-based Uniform Crime Reporting Survey. |
|
Chart 1 end
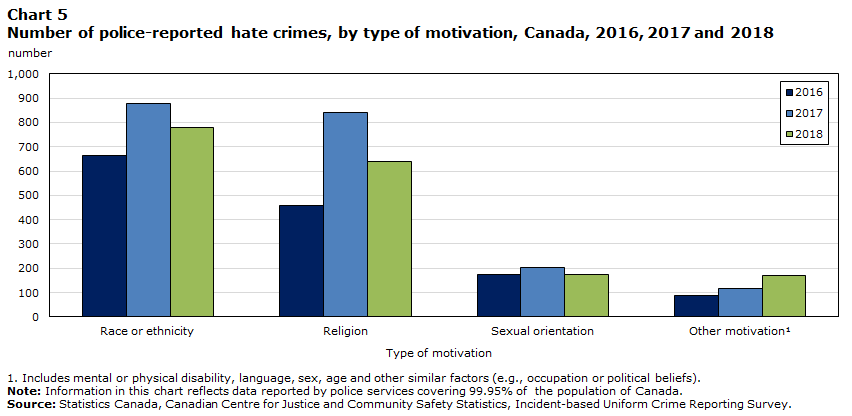
In 2018, hate crimes motivated by hatred of a race or ethnicity represented 44% of all hate crimes, followed by those targeting religion (36%) (Table 1). Crimes motivated by hatred of sexual orientation accounted for 10% of hate crimes, while those targeting other factors such as language, disability, age, and sex comprised 10%.
Non-violent hate crimes accounted for 57% of hate crime incidents in 2018, down from 62% in 2017 (Table 2). With a decrease of 21% from 2017 to 2018, non-violent crimes accounted for more of the overall decrease in hate crimes than did violent crimes (-2%). The decrease in non-violent hate crimes was primarily due to a 26% decrease in general mischief offences (excluding mischief in relation to property used primarily for worship or by an identifiable group, which saw a 43% increase), from 913 in 2017 to 679 in 2018. There was also a 40% decrease in public incitement of hatred, from 121 incidents in 2017 to 72 incidents in 2018. The 2% decline in violent hate crimes was driven by decreases in incidents of uttering threats (-11%) and criminal harassment (-21%) between 2017 and 2018. The decrease was partially offset by increases in total assault (+6%) and other violent violations (+22%). Overall in 2018, 43% of hate crimes were violent, up from 38% in 2017 (Table 2).
In 2018, the vast majority (89%) of police-reported hate crimes were offences other than the four offences explicitly defined as hate crimes under the Criminal Code. When examining these four offences specifically, 6% of hate crimes were mischief in relation to property primarily used for religious worship or by an identifiable group (103 incidents), 4% were public incitement of hatred or wilful promotion of hatred (72 incidents), and fewer than 1% involved advocating genocide (7 incidents) (Table 2).
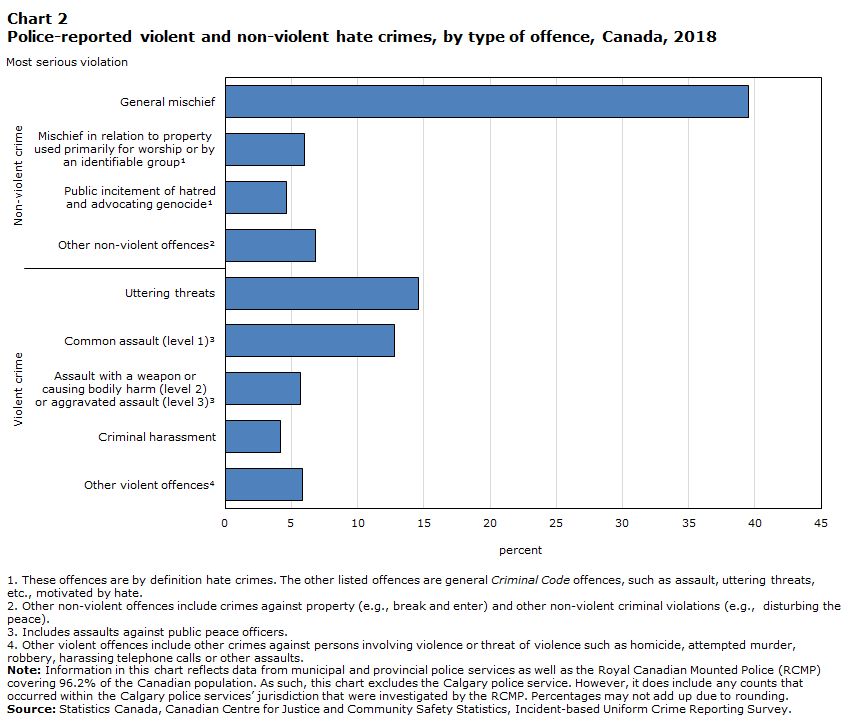
Overall, the most common type of hate crime were those related to mischief with 782 (45% of all incidents) in 2018, which has remained consistently the most common violation type since 2010 (Chart 2). Compared to other violations, mischief tends to be an important driver in changes in hate crime as fluctuations can have a relatively large impact on trends across motivations. Similar to non-hate motivated crime, the most common types of violent hate crimes were assault (318 incidents), and uttering threats (251 incidents), accounting for 18% and 15% respectively of all hate crimes in 2018 (Chart 2).
Chart 2 start
Data table for Chart 2
| Most serious violation | Percent |
|---|---|
| Non-violent crime | |
| General mischief | 39 |
| Mischief in relation to property used primarily for worship or by an identifiable groupData table Note 1 | 6 |
| Public incitement of hatred and advocating genocideData table Note 1 | 5 |
| Other non-violent offencesData table Note 2 | 7 |
| Violent crime | |
| Uttering threats | 15 |
| Common assault (level 1)Data table Note 3 | 13 |
| Assault with a weapon or causing bodily harm (level 2) or aggravated assault (level 3)Data table Note 3 | 6 |
| Criminal harassment | 4 |
| Other violent offencesData table Note 4 | 6 |
Source: Statistics Canada, Canadian Centre for Justice and Community Safety Statistics, Incident-based Uniform Crime Reporting Survey. |
|
Chart 2 end
While hate crimes decreased between 2017 and 2018, total police-reported crimes increased 4% in 2018. Hate crimes accounted for less than 0.1% of the over 2.0 million police-reported crimes in 2018 (excluding traffic offences) (Moreau 2019).
Start of text box 2
Text box 2
Self-reported victimization data on hate-motivated incidents
Information on self-reported victimization is collected by the General Social Survey (GSS) on Canadian's Safety (Victimization) every five years. This survey asks a sample of Canadians, aged 15 years and older if they had been a victim in the previous 12 months of any of the following offences: sexual assault, robbery, physical assault, break and enter, theft of motor vehicles or parts, theft of household property, theft of personal property, and vandalism. If respondents indicate that they had been victimized, they are subsequently asked if they believed that the incident had been motivated by hate and, if so, to state the motivation(s).
The latest GSS on Victimization is in collection from April 15, 2019 to March 31, 2020. Data from the latest iteration of the survey will be available in 2020/2021. One notable change made to the survey questionnaire for 2019 is the inclusion of gender identity or expression as a perceived reason for hate crime in the definition of a hate crime: "There is a growing concern in Canada about hate crimes. By this we mean crimes motivated by the offender's hatred of a person's sex, gender identity or expression, ethnicity, race, religion, sexual orientation, age, disability or language." For more detailed information on the GSS and its collection, please refer to the GSS survey information page.Note
It is important to note that data collected by the GSS differ from police-reported data. Information from the GSS is based upon the perceptions of individuals regarding whether or not a crime occurred and what the motivation for the crime may have been. Data on self-reported victimization provide information on incidents that may or may not have come to the attention of police. Information from police, on the other hand, is based on incidents that have been substantiated through investigation. The police use strict legal criteria to determine whether or not a crime is motivated by hate and to indicate the type of motivation. They also look at information gathered during the investigation and adhere to national guidelines for record classification. Police-reported data also depend on whether victims are willing to report hate crimes to an official body.
Overall, according to the GSS, about two-thirds of individuals who said they had been victims of hate-motivated incidents did not report the incidents to the police. Of the victims who did not report the hate crime targeting themselves, 64% said they did not report it because they thought the police would not have considered the incident important enough. Similarly, 62% felt that the crime was minor and not worth taking the time to report to the police. Another reason, cited by 58% of victims, was the belief that the accused would not be convicted or adequately punished.Note For more detailed analysis of GSS data as it relates to hate crimes, please refer to Text box 2 in the "Police-reported hate crime in Canada, 2017" report (Armstrong, 2019).
End of text box 2
Decrease in police-reported hate crime primarily driven by 26% decline in Ontario
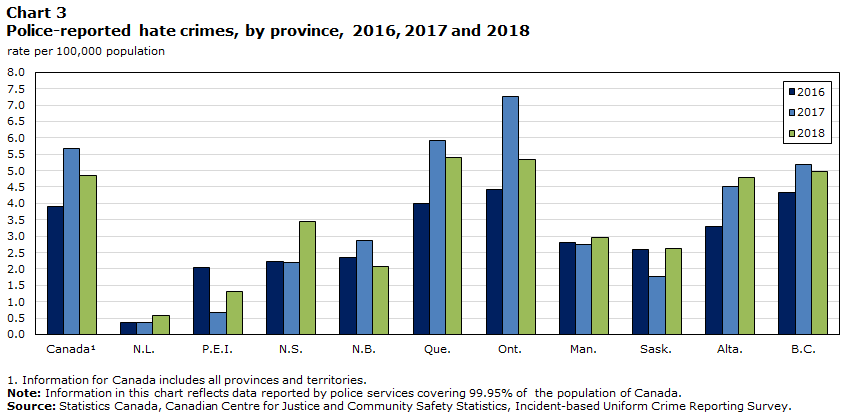
As in 2017, Ontario had the greatest contribution to the change in overall police-reported hate crimes among the provinces. Canada's most populous province had 261 fewer incidents in 2018 compared to 2017, representing a 26% decline year-over-year, from 1,023 incidents in 2017 to 762 in 2018 (Table 3). This decrease was primarily driven by fewer hate crimes targeting the Muslim (-104 incidents, -57%), Black (-48 incidents, -25%), gay and lesbian (-31 incidents, -32%), and Jewish (-28 incidents, -13%) populations.
The second largest contributor to the decrease in hate crimes was the province of Quebec,Note which reported a 7% decrease in hate crimes from 2017 to 2018 year-over-year, falling from 489 to 453 (Table 3). The decrease was largely the result of a decline in police-reported crimes against the Muslim population from 117 in 2017 to 60 in 2018. Of note, following the January 2017 mass shooting at the Islamic Cultural Centre of Québec, reports of hate crimes against Muslims in Quebec peaked in February 2017 and accounted for 26% of Quebec's annual police-reported incidents targeting Muslims that year.
While decreases in police-reported hate crime were recorded across the most populous provinces (Ontario, Quebec and British Columbia), the Prairie and Atlantic provinces (excluding New Brunswick), saw increases. Notably, Alberta increased 8% from 2017 to 2018, following a 38% increase from 2016 to 2017 (Chart 3). The increase in 2018 was primarily due to increases in hate crimes targeting the Jewish population (+26 incidents in 2018, +8 incidents in 2017) and the Black population (+9 incidents in 2018, +3 incidents in 2017). These increases were partially offset by decreases primarily in incidents targeting the Arab and West Asian populationNote (-12 incidents in 2018), and the East Asian and Southeast Asian population (-8 incidents in 2018).
Chart 3 start
Data table for Chart 3
| Province | 2016 | 2017 | 2018 |
|---|---|---|---|
| rate per 100,000 population | |||
| CanadaData table Note 1 | 3.9 | 5.7 | 4.9 |
| N.L. | 0.4 | 0.4 | 0.6 |
| P.E.I. | 2.0 | 0.7 | 1.3 |
| N.S. | 2.2 | 2.2 | 3.4 |
| N.B. | 2.4 | 2.9 | 2.1 |
| Que. | 4.0 | 5.9 | 5.4 |
| Ont. | 4.4 | 7.3 | 5.3 |
| Man. | 2.8 | 2.7 | 3.0 |
| Sask. | 2.6 | 1.8 | 2.6 |
| Alta. | 3.3 | 4.5 | 4.8 |
| B.C. | 4.3 | 5.2 | 5.0 |
Source: Statistics Canada, Canadian Centre for Justice and Community Safety Statistics, Incident-based Uniform Crime Reporting Survey. |
|||
Chart 3 end
Census data show that diversity has increased in all provinces from 2011 to 2016 and that the largest proportion of visible minority people live in the three provinces of British Columbia, Ontario, and Alberta (Table 4).
Start of text box 3
Text box 3
Canada's most diverse populations living in the three largest census metropolitan areas
According to the 2016 Census, 22.3% of the Canadian population were a member of a visible minority group, compared to 19% in the 2011 National Household Survey. Canada's visible minority population is most concentrated in the country's three largest census metropolitan areas (CMAs)—Toronto, Montréal and Vancouver, home to 36% of the total Canadian population. Of the total visible minority population in Canada, 66% lived in one of these three CMAs in 2016. In that year, about 5 in 10 people residing in Toronto (51%) and Vancouver (49%) were visible minorities, whereas the same was true for 2 in 10 people residing in Montréal (23%). Forecasts indicate that by 2036, more than 6 in 10 individuals among the working-age population living in the CMAs of Toronto and Vancouver could be members of a visible minority. In Montréal, the proportion is expected to increase to more than 4 in 10 (Statistics Canada 2017a).
Canada's three largest CMAs are also home to a great majority of Canadians who are members of religious groups that were most frequently targeted in religiously motivated hate crimes. For instance, in 2011, 1% of the Canadian population identified as Jewish, with most (82%) living in Toronto, Montréal or Vancouver. The majority (68%) of those identifying as Muslim, who made up 3% of the Canadian population, resided within Toronto, Montréal or Vancouver. Buddhists, Hindus and Sikhs represented 4% of the Canadian population, and the majority resided in the three largest CMAs (74%) (Statistics Canada 2013b). As with visible minority groups, these proportions are expected to increase over the next two decades (Statistics Canada 2017a; Statistics Canada 2010).
In 2016, same-sex couples (both married and common-law) accounted for 1% of all couples in Canada, rising 13% from 2011. Close to half (45%) of these couples resided in Toronto, Montréal, or Vancouver (Statistics Canada 2017b).
End of text box 3
Toronto and Montréal CMAs posted the largest year-over-year decreases in hate crimes
The vast majority (87%) of police-reported hate crimes in Canada in 2018 occurred in a census metropolitan area (CMA) (Table 5).Note More specifically, 50% of hate crimes occurred in the four largest CMAs (Toronto, Montréal, Vancouver, and Calgary). These CMAs were home to 38% of Canada's population, and Canada's visible minority population is also most concentrated in these CMAs (see Text box 3).Note
Overall, 15 of 35Note CMAs reported decreases in hate crimes from 2017 to 2018, and another 3 CMAs reported no change year-over-year. The CMAs with the largest decreases in total incidents were Toronto (-155 incidents) and Montréal (-35 incidents), following the largest recorded increases in 2017 (Table 5). Of the CMAs, 23 reported increases over 2016 and/or 2017 numbers, mirroring the national trend where, despite the overall decrease from a spike in 2017, hate crimes remain at their highest levels historically. The decrease in Toronto was driven by decreases in crimes motivated by hatred of the Muslim (-71 incidents), Jewish (-31) and Black (-18) populations.
For Montréal, the decrease observed in 2018 was attributable primarily to fewer hate crimes targeting the Muslim population (-32 incidents) and gay and lesbian community (-8).
In contrast, 17 of 35 CMAs reported increases in the number of hate crimes from 2017 to 2018. The top four increases were reported in the CMAs of Victoria (+14 incidents), QuébecNote (+10), Ottawa (+9) and Winnipeg (+9) (Table 5).
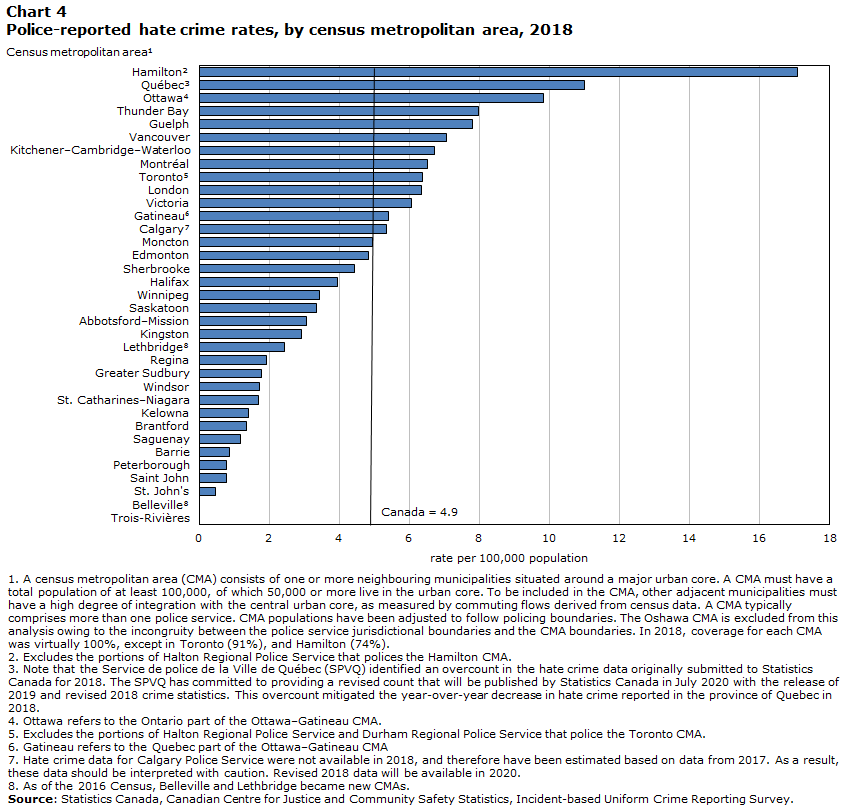
When controlling for the size of the population of each CMA, the CMAs with the highest rates of police-reported hate crime were Hamilton (17.1 hate crimes per 100,000 population), Québec (11.0), and Ottawa (9.8) (Chart 4; Table 5).Note Of note, all three of these jurisdictions reported year-over-year increases in hate crimes from 2017 to 2018.
Chart 4 start
Data table for Chart 4
| Census metropolitan areaData table Note 1 | rate per 100,000 population |
|---|---|
| Canada | 4.9 |
| HamiltonData table Note 2 | 17.1 |
| QuébecData table Note 3 | 11.0 |
| OttawaData table Note 4 | 9.8 |
| Thunder Bay | 8.0 |
| Guelph | 7.8 |
| Vancouver | 7.1 |
| Kitchener–Cambridge–Waterloo | 6.7 |
| Montréal | 6.5 |
| TorontoData table Note 5 | 6.4 |
| London | 6.4 |
| Victoria | 6.1 |
| GatineauData table Note 6 | 5.4 |
| CalgaryData table Note 7 | 5.3 |
| Moncton | 5.0 |
| Edmonton | 4.8 |
| Sherbrooke | 4.4 |
| Halifax | 3.9 |
| Winnipeg | 3.4 |
| Saskatoon | 3.4 |
| Abbotsford–Mission | 3.1 |
| Kingston | 2.9 |
| LethbridgeData table Note 8 | 2.4 |
| Regina | 1.9 |
| Greater Sudbury | 1.8 |
| Windsor | 1.7 |
| St. Catharines–Niagara | 1.7 |
| Kelowna | 1.4 |
| Brantford | 1.3 |
| Saguenay | 1.2 |
| Barrie | 0.9 |
| Peterborough | 0.8 |
| Saint John | 0.8 |
| St. John's | 0.5 |
| BellevilleData table Note 8 | 0.0 |
| Trois-Rivières | 0.0 |
|
|
Chart 4 end
Hamilton reported the highest rate of hate crimes (17.1 hate crimes per 100,000 population) among CMAs in 2018, with 97 incidents. These hate crimes tended to target the Black (31%) and Jewish (26%) populations. Ottawa had the third highest crime rate (9.8 hate crimes per 100,000 population), and the fourth highest number of hate crimes (105 incidents). Like Hamilton, hate crimes in Ottawa primarily targeted the Jewish (37%) and Black (14%) populations. The increase in hate crimes in Ottawa was primarily driven by a 17% increase in incidents of general mischief, which accounted for 71% of hate crimes there. Despite a 52% decrease from 2017, Thunder Bay reported the fourth highest rate of hate crimes (8.0 per 100,000 population) in 2018.
Similar to data at the national level, hate crimes in these CMAs tended to be made up of offences of general mischief, common assaultNote and uttering threats.
It is important to note that the number of police-reported hate crimes among individual CMAs can be relatively small and are sensitive to fluctuations. Therefore, these data are highly variable according to policing practices, shifting attitudes and reporting practices among the public. For example, some local police services, especially those serving large cities, have dedicated hate crime units or allow for online reporting. Additionally, many cities have local anti-racism or anti-hate committees that work with police to address issues of hate in their communities (see Text box 4). These practices may influence the likelihood that a hate crime is reported to police.
Police-reported hate crimes motivated by hatred of a race or ethnicity decreased
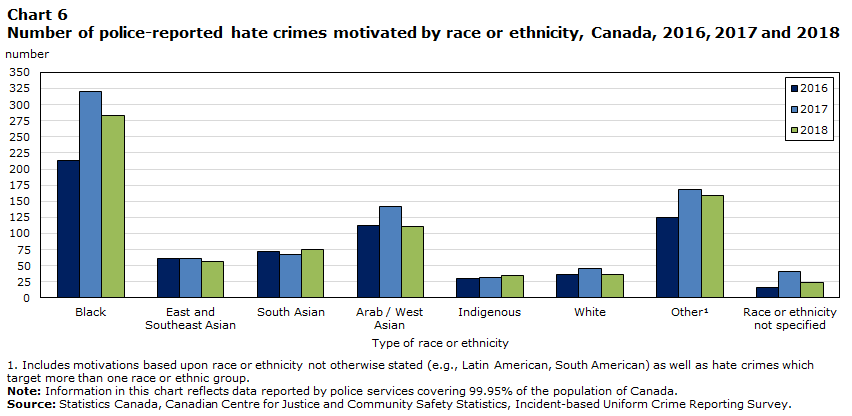
Police reported 780 criminal incidents motivated by hatred of race or ethnicity, down 11% from the previous year (Table 1; Chart 5). This decrease was the result of 38 fewer hate crimes targeting the Black population (-12%) and 31 fewer incidents targeting the Arab and West Asian population (-22%) (Table 1; Chart 6).Note Despite the decrease in incidents in 2018, 44% of all police-reported hate crime was motivated by hatred of a race or ethnicity. This proportion remained relatively stable compared to 2017, where hate crime motivated by hatred of a race or ethnicity accounted for 43% of all hate crime.
Chart 5 start
Data table for Chart 5
| Type of motivation | 2016 | 2017 | 2018 |
|---|---|---|---|
| number | |||
| Race or ethnicity | 666 | 878 | 780 |
| Religion | 460 | 842 | 639 |
| Sexual orientation | 176 | 204 | 173 |
| Other motivationData table Note 1 | 88 | 117 | 171 |
| Unknown | 19 | 32 | 35 |
Source: Statistics Canada, Canadian Centre for Justice and Community Safety Statistics, Incident-based Uniform Crime Reporting Survey. |
|||
Chart 5 end
Chart 6 start
Data table for Chart 6
| Type of race or ethnicity | 2016 | 2017 | 2018 |
|---|---|---|---|
| number | |||
| Black | 214 | 321 | 283 |
| East and Southeast Asian | 61 | 61 | 56 |
| South Asian | 72 | 67 | 75 |
| Arab / West Asian | 112 | 142 | 111 |
| Indigenous | 30 | 31 | 35 |
| White | 36 | 46 | 37 |
| OtherData table Note 1 | 125 | 169 | 159 |
| Race or ethnicity not specified | 16 | 41 | 24 |
Source: Statistics Canada, Canadian Centre for Justice and Community Safety Statistics, Incident-based Uniform Crime Reporting Survey. |
|||
Chart 6 end
In 2018, police in Canada reported 283 incidents motivated by hatred against the Black population (38 fewer than in 2017, yet 69 more than in 2016). This represented 36% of all hate crimes targeting race or ethnicity, and 16% of all hate crimes in 2018. There were approximately 23.6 incidents per 100,000 members of the Black population.Note The Black population was the second most commonly targeted group overall for 2018, behind the Jewish population. Ontario (-48 incidents) accounted for the largest decrease in crimes against the Black population, while Quebec (+18 incidents) recorded the largest increase.
Hate crimes against the Arab and West Asian population down for first year since 2013
In 2018, there were 111 hate crimes specifically targeting the Arab and West Asian population.Note This represents approximately 14.1 crimes per 100,000 members of the Arab and West Asian population in Canada.Note
The number of police-reported hate crimes against the Arab and West Asian population has declined for the first time since 2013. From 2017 to 2018, there was a 22% decrease in hate crimes targeting the Arab and West Asian population. These crimes accounted for 14% of hate crimes targeting a race or ethnicity, and 6% of all hate crimes in 2018 (Table 1).
Ontario reported 13 fewer hate crimes targeting the Arab and West Asian population (42 incidents in 2017 to 29 incidents in 2018), and Alberta reported 12 fewer (30 in 2017 to 18 in 2018). Nova Scotia and British Columbia were the only provinces or territories to record an increase in hate crimes against the Arab and West Asian population, increasing from one to four incidents and seven to nine incidents, respectively, from 2017 to 2018.
In addition, there were 56 police-reported hate crimes targeting the East or Southeast Asian population,Note amounting to 1.9 incidents per 100,000 East or Southeast Asians.Note
Hate crimes against Indigenous peoples continue to account for relatively few police-reported hate crimes, but are increasing
Police-reported hate crime incidents targeting Indigenous peoples – including those who are First Nations, Métis, or Inuit – account for a relatively small proportion of police-reported hate crimes (2%) (Table 1). The number of hate crimes targeting the Indigenous population increased for the second year in a row, from 31 in 2017 to 35 in 2018. This represented a rate of 2.1 hate crimes per 100,000 Indigenous people in Canada in 2018.Note As mentioned, police-reported hate crime data can vary according to policing practices, shifting attitudes and reporting practices among the public. According to data from the General Social Survey (GSS), Indigenous victims of non-spousal violence were more likely not to report the crime to police than their non-Indigenous counterparts. For instance, 77% of non-spousal violent incidents that were committed against Indigenous peoples went unreported to the police, compared to 66% committed against non-Indigenous people (Boyce 2016). Furthermore, Indigenous peoples rated police lower than non-Indigenous people for each of the six police performance measures in the GSS (Cotter 2015). These measures include perceptions of police's ability to promptly respond to calls and to enforce the laws.
Within the specific race/ethnic group categories included in the UCR, Indigenous peoples and the South Asian population were the only ones for which an increase in hate-motivated crime was reported by police in 2018. There were 8 more hate crimes targeting the South Asian populationNote in Canada, from 67 in 2017 to 75 in 2018, representing 3.9 hate crimes per 100,000 South Asians. Hate crimes targeting other races or ethnicities (excluding multiple races or ethnicities, but including, for example, Caribbean, Latin American, South American, Pacific Island origins etc.), also experienced an increase from 2017 to 2018.
Start of text box 4
Text box 4
Initiatives to address and prevent hate crime in Canada
In an effort to address and prevent hate crime, as well as provide reporting alternatives other than police, a number of governmental and non-governmental initiatives have been developed. These initiatives range from federal action plans to community-based outreach by police to creating websites for people to report hate crimes and non-criminal hate incidents online. These practices may influence the likelihood that a hate crime is reported to police.
In an effort to combat racism and discrimination, the Government of Canada funded Building a Foundation for Change: Canada's Anti-Racism Strategy 2019-2022 (Canadian Heritage, 2019). Part of the Anti-Racism Strategy involves the creation of an Anti-Racism Secretariat to coordinate federal action and engage with relevant communities, experts and stakeholders.
Many of the police services that serve large cities, such as Toronto or Edmonton, have specialized hate crime units. These specialized units are composed of officers and/or civilians that have special training in crimes motivated by hate. Specialized hate crime units help to provide support to front line officers, do hate crime specific investigative work, educate other police officers and the community, and provide outreach to affected communities (Edmonton Police Service 2018; York Regional Police 2018). Alongside the hate crime units, some police services, such as the Ottawa Police Service, allow hate crimes to be reported online, while other police services, such as Le Service de police de la Ville de Montréal, allow non-criminal hate incidents to be reported online.
Many cities also have local anti-racism or anti-hate committees that work with police to address issues of hate in their communities. These include, for example, the Thunder Bay Anti-Racism and Respect Advisory Committee, the Hamilton Committee against Racism, and the Peterborough Community Race Relations Committee. These groups may also help encourage the reporting of hate crime.
Non-governmental organizations (NGOs) play a role in addressing and preventing hate crime. Organizations such as the Alberta Hate Crimes Committee, and Stop Racism and Hate Canada have spaces on their websites for the public to report hate incidents including both actual crimes and non-criminal incidents that involve bias or prejudice.Note NGOs also raise awareness by providing online educational courses for secondary students and workshops for professionals to teach about multiculturalism and human rights in Canada and how to work positively in a multicultural environment.
Provincial governments have launched various initiatives and legislative actions to address hate crime and aid in combatting purveyors of hate crime. The provinces of Ontario, Quebec, and most recently British Columbia, have all enacted legislation that help to protect anti-hate groups from strategic lawsuits against public participation (SLAPP). SLAPP lawsuits are generally used to intimidate and silence critics by piling legal costs onto the defendant until they abandon their oppositional position (Ontario Ministry of the Attorney General 2010). In the context of hate motivated actions, anti-SLAPP legislation helps to shield anti-hate groups and allow them to freely confront persons espousing hateful rhetoric or producing and displaying hate-related propaganda.
British Columbia created a provincial hate crime team in the mid-1990s which is mandated to address the identification, investigation, and prosecution of hate crimes in British Columbia (British Columbia Ministry of the Attorney General 2008). The British Columbia hate crime team acts as a support for the hate crime units that exist within British Columbia's various police services. Furthermore, the provincial government of British Columbia launched a website to give residents access to information about what hate crimes are, how they can present on the internet, the consequences of hate crime, as well as how to report hate crimes in the province, all in one area (HateCrimeBC 2018).
End of text box 4
Decrease in the number of crimes targeting a religious group driven by fewer anti-Islamic crimes
According to the 2011 National Household Survey, the increased ethno-cultural diversity in Canada has been paralleled by an increase in the proportion of people who reported religious affiliations other than Christianity. In 2011, 7.2% of the Canadian population reported that they identify as Muslim, Hindu, Sikh or Buddhist, compared to 4.9% in 2001 (Statistics Canada 2013b; Table 4). The Jewish population has remained stable at 1%. Two-thirds (67.3%) of the Canadian population reported affiliation with a Christian religion. Almost one-quarter (23.9%) of Canadians reported no religious affiliation, compared to 16.5% in 2001.
The majority of Canadians who reported non-Christian religions were also members of a visible minority group, with one exception. The exception was for those who were Jewish, among whom 2% were members of a visible minority group. In 2011, 88% of Muslims and 97% of Buddhists, Hindus and Sikhs residing in Canada were also members of a visible minority group (Statistics Canada 2013b).Note The overlap between race or ethnicity and religion may have an impact on hate crime statistics, as some religious populations or communities may also be targeted in hate crimes motivated by race or ethnicity. When a hate crime incident involves or appears to involve more than one motivation (e.g., religion and race or ethnicity), the incident is reported by the police only once according to the primary motivation determined by the circumstances of the incident.
In 2018, 639 hate crimes targeting religion were reported by police, a decrease of 24% compared with 2017 (Table 1; Chart 5). These crimes were still 39% higher than in 2016. For hate crimes targeting religion in 2018, the Jewish and Muslim populations continue to be the most frequent targets, accounting for 54% and 27% of crimes against a religion, respectively.
Following an increase in hate crimes against the Muslim population in 2017, police reported 176 fewer incidents in 2018, for a total of 173, marking a decrease of 50% (Chart 7). The decrease in police-reported hate crimes against Muslims was the result of large decreases in reported incidents in Ontario (-104) and Quebec (-57), following spikes in both provinces in 2017.
In contrast, following a 63% spike in 2017, the number of incidents targeting the Jewish population decreased 4% in 2018, from 360 to 347. This remains 57% higher than in 2016.
Chart 7 start

Data table for Chart 7
| Type of religion | 2016 | 2017 | 2018 |
|---|---|---|---|
| number | |||
| Jewish | 221 | 360 | 347 |
| Muslim | 139 | 349 | 173 |
| Catholic | 27 | 39 | 35 |
| Other religionData table Note 1 | 37 | 57 | 46 |
| Unknown religion | 36 | 37 | 38 |
Source: Statistics Canada, Canadian Centre for Justice and Community Safety Statistics, Incident-based Uniform Crime Reporting Survey. |
|||
Chart 7 end
Decrease in crimes that are motivated by hatred of sexual orientation
Sexual orientation defines to whom a person is physically and romantically attracted. In the police reported data, a hate crime can be reported as being motivated by the hatred of a heterosexual, homosexual, bisexual, or other sexual orientation. This category does not include crimes motivated by hatred towards transgender individuals, as those are collected under sex or gender identity. That being said, some victims of hate crimes based on sexual orientation may be transgender individuals targeted because of their perceived sexual orientation.
In 2018, police reported 173 hate crimes targeting sexual orientation, a 15% decrease compared to the previous year (Table 1). The decrease was primarily driven by the provinces of Ontario (-35 incidents) and Quebec (-13 incidents) (Table 3). This was partially offset by 14 more hate crimes targeting sexual orientation in British Columbia, increasing from 18 incidents in 2017 to 32 incidents in 2018. There was nearly a one-to-one reversal in the number and direction of incidents reported for these three provinces compared to what was observed from 2016 to 2017.
Crimes motivated by hatred of a sexual orientation made up 10% of all police-reported hate crimes in 2018. The large majority (79%) of these crimes specifically targeted the gay and lesbian community. This proportion, however, has been trending down since 2010, with a peak of 94% in 2013.
Police-reported hate crimes motivated by hatred of a gender expression or identity
From 2010 to 2018, 45 hate crimes targeting transgender or agender people were reported by police. Of these crimes, nearly two-thirds (29 incidents) occurred in 2017 (15 incidents) and 2018 (14 incidents). Even though the overall number is small relative to other hate crimes, incidents targeting transgender or agender people were more often violent in nature, with 80% of incidents involving a violent violation.
In June 2017, Bill C-16 was adopted. This Bill formally recognizes protection for gender expression and identity under the Canadian Human Rights Act and the Criminal Code of Canada.
Overall, hate crimes targeting sex or gender have increased each of the last three years.
Nearly one-third of hate crimes were cleared
In 2018, nearly one-third (31%) of hate crime incidents were cleared (meaning solved).Note Specifically, of the incidents that were cleared, 68% resulted in charges laid against one or more individuals, and 32% were cleared otherwise, meaning an accused was identified but a charge was not laid. As has historically been the case, in most incidents cleared otherwise in 2018, charges were not laid due to the complainant having declined to proceed with charges (37%) or due to departmental discretion – including the use of warnings or cautions (33%). The clearance rate for non-violent hate crimes was far lower than the rate for violent hate crimes (15% versus 53%). This is primarily due to very low clearance rates for mischief where it is difficult to identify a perpetrator.
For hate-motivated mischief incidents in 2018, the most common type of non-violent hate crime, 9% were cleared compared to 28% of mischiefs overall (hate or non-hate motivated). Of these cleared incidents, 60% resulted in the laying of charges in hate-motivated mischief, a larger proportion compared to the 22% of mischiefs overall (hate or non-hate motivated).
Similarly, for common assault (historically one of the most frequent types of violent hate crime), clearance rates were lower for hate-motivated assaults (56%) compared to all common assaults (75%). Moreover, of those cleared incidents, 70% of hate-motivated common assaults were cleared by charge, compared to 65% of all incidents of common assault.
Hate crimes targeting religion, which are most often mischief, were least likely to be cleared. Once cleared, hate crimes based on sexual orientation were more likely to result in a charge compared with other types of hate crimes.
Given the annual counts of hate-motivated crimes can be relatively small, the following sections on police-reported hate crime are based on detailed incidents from 2010 to 2018 in order to provide information on the characteristics of incidents, victims and accused persons.
Police-reported hate crime targeting sexual orientation, the South Asian, the Arab and West Asian, and the East and Southeast Asian populations was more often violent
While the large majority (79% in 2018) of police-reported crime (excluding traffic offences) is non-violent in nature, hate crime targeting specific populations was more likely to be violent than non-violent (Moreau, 2019). Specifically, between 2010 and 2018, the majority of police-reported hate crimes targeting sexual orientation (64%), the South Asian (64%), the Arab and West Asian (63%), the East and Southeast Asian (56%) populations were violent. The proportions of violent crimes targeting these populations were similar, with common assault occurring most often (between 23% and 27% of all hate crimes), followed by uttering threats (12% to 18%) and assault with a weapon or causing bodily harm (5% to 11%).
Despite relatively few incidents during that same time frame, those targeting the Indigenous population (51%) and people with disabilities (69%) were also more likely to be violent than not.
The 2017 Canadian Survey on Disability (CSD)Note found that just over one in five (22%) Canadians aged 15 and older had at least one disability (Morris et al. 2018). Research to date has found that having a disability, and the severity of the disability, are linked to lower levels of employment and higher levels of poverty and victimization (Cotter 2018; Morris et al. 2018). A recent analysis of self-reported data on violent victimization found that women with a disability were twice as likely to be victims of violent crime, and experience repeated violence over a 12-month period, than women who do not have a disability (Cotter 2018).
Notably, for all hate crime motivations, mischief in general accounted for the largest proportion of hate crime violations (45% in 2018). Mischief plays an important role across all hate crime motivations as it may be subject to greater variation in reporting between different populations, which can affect the proportion of non-violent versus violent crimes. For example, 64% of violations targeting religion were mischief, compared to 36% targeting race/ethnicity. It is important to note the potential impact of reporting differences in general, and mischief in particular, in evaluating the propensity for violent violations between groups.
Police-reported hate crime targeting the Black population and religion more often non-violent
Non-violent crimes accounted for 60% of crimes targeting the Black population from 2010 to 2018. A significant portion (84%) of these non-violent crimes were general mischief. Non-violent crimes most often occurred in open areas like on the street or in parks or fields (33% of incidents), in a residence (27%), and in educational institutions (21%), most notably in schools outside of school hours (Table 6). Of the violent crimes targeting the Black population, common assault was the most common (38%). Nearly one quarter (24%) of violent hate crimes targeting the Black population took place on the street, with another 12% occurring in other open areas, and 27% in a residence (Table 6).
During the same period, 84% of crimes against the Jewish population were non-violent. The large majority of the non-violent hate crimes were general mischief (81%), as well as hate-motivated mischief relating to property primarily used for religious worship or by an identifiable group (7%). The most common violent offence against this population was uttering threats (42% of violent offences and 7% of all offences targeting the Jewish population). The most frequent locations of non-violent incidents were single-family homes (16%), the street (13%), other commercial or corporate places like office buildings, grocery stores or hotels (12%), and schools outside of school hours (12%). Violent crimes most often occurred in single-family homes (18%), other commercial or corporate places like office buildings, grocery stores or hotels (17%), and religious institutions (14%).
From 2010 to 2018, 60% of crimes against the Muslim population were non-violent while the other 40% were violent. The most common non-violent hate crime was general mischief (59% of non-violent offences), while the most common violent hate crimes targeting this population were uttering threats (43%) and common assault (23%). The most frequent locations of non-violent incidents were religious institutions (16%) and the street (14%). Violent crimes targeting the Muslim population occurred most often in the street (19%) and at single-family homes (16%).
Hate crimes typically occur in open areas and at residences
Where violent hate crimes occur is similar across the various types of police-reported hate crimes. Violent hate crimes targeting race or ethnicity tended to occur in open areas like parks, playgrounds or fields (36%), followed by residences (24%), commercial businesses (20%), educational institutions (7%) and other institutions (6%) (Table 6). Similarly, 39% of violent incidents motivated by hatred of sexual orientation were committed in open areas and 28% at a residence. While violent hate crimes targeting religion also occurred in these places, an additional 11% occurred at religious institutions.
Compared to violent hate crimes, non-violent hate crimes targeting race or ethnicity, and religion, which are largely mischief offences, occurred more often at educational and religious institutions. For instance, 16% of non-violent hate crimes targeting race/ethnicity occurred at an educational institution (Table 6). For non-violent hate crimes targeting religion, 21% occurred at religious institutions, 14% at educational institutions and another 11% at commercial businesses. In contrast, non-violent hate crimes targeting sexual orientation occurred far more often at a residence (42%) than anywhere else.
Uttering threats the most common type of cyber hate crime
The internet provides a platform for equal communication of beliefs and opinions by all users. It also offers a medium for the spread of hate-related content targeting various groups. According to data from the GSS, 30% of internet users aged 15 to 24 came across hate content while on the internet, with ethnic and religious minorities the most commonly targeted (Perreault, 2013). The Government of Canada recently announced Canada's Digital Charter, which outlines ten guiding principles under which the public can expect to interact with digital content or platforms (Government of Canada 2019). One of these principles includes being free from hate and violent extremism. The Digital Charter states that Canadians can expect that digital platforms will not foster or disseminate hate, violent extremism or criminal content.
Over the last five years, the proportion of police-reported hate crime incidents that were also recorded by police as cybercrimes has been fairly stable, ranging from 4.1% of all hate crime incidents in 2014 to 5.1% in 2018 (Table 7). The year-over-year increases are primarily due to more incidents of uttering threats, public incitement of hatred and criminal harassment.
Of the 456 police-reported hate crimes that were also recorded by police as cybercrimes between 2010 and 2018,Note Note these most commonly targeted the Muslim population (17%), the Jewish population (13%), sexual orientation (13%) and the Black population (10%). Over the same nine year period, uttering threats (37%) was by far the most common type of hate-motivated cybercrime, followed by public incitement of hatred (18%), criminal harassment (14%), and indecent or harassing communications (13%). In comparison, these offences accounted for a much smaller proportion of non-cyber hate crimes. Of all the hate-motivated offences of uttering threats, 12% were reported as cybercrimes.
Over half (51%) of cyber hate incidents of uttering threats were cleared by charge or cleared otherwise by police, a solve-rate that is slightly lower than non-cyber hate incidents of uttering threats (53%).
Start of text box 5
Text box 5
Hate crime and extremism
Both hate crimes and right-wing extremism are motivated by intense hate of perceived or real differences between themselves and others, be it race, religion, gender, sexual orientation, or other identity (Perry and Scrivens 2017; Stevkovski 2015). Unlike hate crime, there is no Criminal Code definition of extremism. Public Safety Canada defines violent extremism as "a term describing the beliefs and actions of people who support or use violence to achieve extreme ideological, religious or political goals" (Public Safety Canada 2018a). According to recent Canadian research, there are at minimum 130 active right-wing extremist groups across Canada (Perry and Scrivens 2016).
In December 2018, the Government of Canada announced the National Strategy on Countering Radicalization to Violence (Government of Canada 2018). The National Strategy articulates an approach toward preventing and countering expressions of intolerance, hate, and violent extremism in the public and online spheres. Part of this approach involves leveraging the Community Resilience Fund (CRF), administered through the Canada Centre for Community Engagement and Prevention of Violence. The CRF is used to fund and support initiatives that aim to prevent radicalization to violence in Canada.
One such initiative is the "Canada Redirect" project, with partnership from the company Moonshot CVE (Countering Violent Extremism). The objective of the project is to help counter radicalization and provide positive alternative content to anyone searching online for extremist topics and who may be vulnerable to radicalizationNote (Public Safety Canada 2018b). The intention is that the findings from this project will help inform local communities and practitioners about countering radicalization to violence in the online space and help expand the reach and impact of organizations in Canada that are creating positive content that provides an alternative to extremist content. During a two week period in September 2018, Moonshot found that Ontario had the highest rate of far-right related online searches in Canada, with almost 18 searches per 100,000 population (Boutilier 2018).
End of text box 5
Police-reported violent hate crimes against Indigenous and Muslim populations more likely than other hate crimes to involve female victims
For all types of hate crimes, nearly a third (32%) of victims reported by police between 2010 and 2018 were female. However, violent incidents targeting the Muslim and Indigenous populations were more likely than other types of hate crimes to involve female victims. Of all victims of violent crimes targeting the Muslim population that were reported to police, 45% were women or girls, as was the case for 45% of victims of hate crimes against the Indigenous population (Table 8).
Of note, the relatively high proportion of female victims of hate crimes targeting Muslim and Indigenous populations could be related to specific factors that may make targeting females more likely. For example, the practice of wearing head coverings may make religious identity more visible for Muslim women than for men (National Council of Canadian Muslims 2014; National Council of Canadian Muslim 2017). Additionally, the overrepresentation of Indigenous persons as victims of violence has been documented in previous research (Boyce 2016; Miladinovic and Mulligan 2015; Perreault 2015; Scrim, 2009). After controlling for other risk factors such as younger age, lower education and higher unemployment, Indigenous women were at greater risk of victimization (Perreault 2015).
It is also notable that more than any other type of hate crime, victims of violent hate crime targeting sexual orientation were predominantly male (81%).
Victims of police-reported violent hate crimes targeting sexual orientation and the Indigenous population are the youngest and have highest percentage of injury
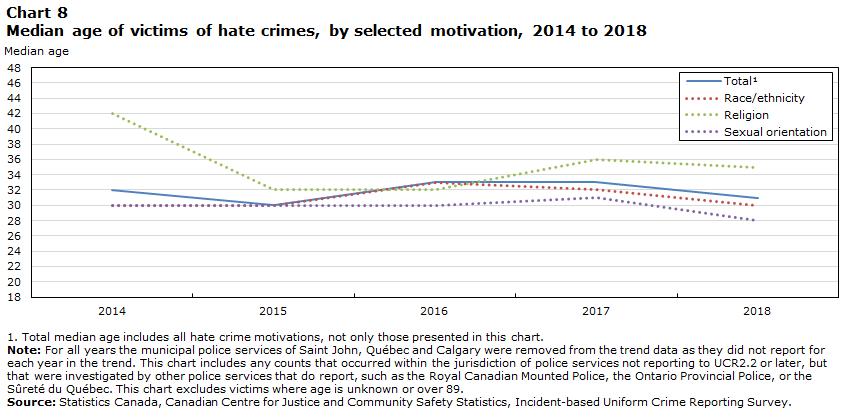
From 2010 to 2018, victims of violent hate crime targeting sexual orientation (median age of 27 years) and the Indigenous population (median age of 28 years) tend to be the youngest (Table 8). Among the victims of violent hate crimes targeting the Black population, the median age was also relatively young (29 years). The median age for victims of violent crimes targeting religion was relatively high at 37 years, compared to the median age of all victims of violent hate crimes at 31 years of age.
When looking at a five year trend from 2014 to 2018, the median age of victims of violent hate crime has been fairly stable, ranging from 30 to 33 (Chart 8). Victims of violent hate crime targeting religion tend to be oldest, while the age of victims of hate crime targeting race/ethnicity or sexual orientation have been fairly stable.
Chart 8 start
Data table for Chart 8
| Year | TotalData table Note 1 | Race/ethnicity | Religion | Sexual orientation |
|---|---|---|---|---|
| Median age | ||||
| 2014 | 32 | 30 | 42 | 30 |
| 2015 | 30 | 30 | 32 | 30 |
| 2016 | 33 | 33 | 32 | 30 |
| 2017 | 33 | 32 | 36 | 31 |
| 2018 | 31 | 30 | 35 | 28 |
Source: Statistics Canada, Canadian Centre for Justice and Community Safety Statistics, Incident-based Uniform Crime Reporting Survey. |
||||
Chart 8 end
Victims of violent hate crimes targeting sexual orientation and Indigenous peoples were also the most likely to have sustained injury. Between 2010 and 2018, 43% of victims of violent hate crimes targeting Indigenous peoples and 42% of those targeting sexual orientation, sustained injuries as a result of the incident (Table 8). Overall, victims of violent hate crimes targeting race/ethnicity were more likely to have resulted in injuries than crimes targeting religion.
It should be noted that in 2018, 62% of crimes targeting sexual orientation were violent violations, up from 53% in 2017. Meanwhile, the proportion of hate crimes targeting race/ethnicity that were violent increased from 47% in 2017 to 53% in 2018, while the proportion of violent hate crimes targeting religion remained stable at 24%.
Victims of police-reported violent hate crimes targeting East and Southeast Asian population and the Muslim population more often to be victimized by strangers
The majority (63%) of hate crime victims were victimized by a stranger, with victims of the East and Southeast Asian population (82%) and the Muslim population (81%) most likely to be victimized by a stranger (Table 8).
Compared to other types of hate crime victims, the prevalence of victimization by someone known to them was highest among victims of hate crimes targeting the Black population (43%) and sexual orientation (43%).
For all victims, where the accused was known to the victims, the vast majority were friends or acquaintancesNote (93%) rather than family.
Persons accused of hate crimes tend to be male and younger
Like crime in general, the vast majority of persons accused of hate crime tend to be male and young (Table 9). Overall, from 2010 to 2018, 84% of persons accused of hate crime targeting race/ethnicity were male, as were 89% of those targeting religion and 90% targeting sexual orientation. The median age for persons accused of hate crime was 26, and tends to be under 30 years of age, with the exception of those accused of hate crimes against the Muslim and Arab or West Asian populations (43 and 35 years of age, respectively).
Additionally, when looking at a five year trend from 2014 to 2018, the median age of those accused of hate crime has been trending up, from a low of 26 in 2014 to a high of 32 in 2017 (Chart 9). The median age of those accused of hate crime in 2018 was 32. The median age of those accused of hate crimes targeting religion is trending significantly older relative to other motivations over the previous five years (Chart 9).
Chart 9 start

Data table for Chart 9
| Year | TotalData table Note 1 | Race/ethnicity | Religion | Sexual orientation |
|---|---|---|---|---|
| Median age | ||||
| 2014 | 26 | 28 | 27 | 24 |
| 2015 | 29 | 31 | 23 | 26 |
| 2016 | 31 | 32 | 33 | 23 |
| 2017 | 32 | 29 | 42 | 27 |
| 2018 | 32 | 30 | 38 | 29 |
Source: Statistics Canada, Canadian Centre for Justice and Community Safety Statistics, Incident-based Uniform Crime Reporting Survey. |
||||
Chart 9 end
Between 2010 and 2018, youth aged 12 to 17 made up 24% of all persons accused of hate crime. Similar to all hate crimes, the vast majority of youth accused of hate crime were male (86%). Over half (54%) of the youth accused of hate crimes targeted race or ethnicity, followed by 20% targeting religion and 18% targeting sexual orientation, which was virtually identical to the distribution seen in adults accused of hate crimes.
Most hate crime cases completed in court involve public incitement and wilful promotion of hatred offences
According to Canada's Integrated Criminal Court Survey, there were 53 cases completedNote in adult criminal and youth courts where the most serious charge in the case was a hate crime related offence, over the period of 2009/2010 to 2017/2018. These were cases, processed mostly in adult criminal courts, where the most serious charge in the case was either advocating genocide; public incitement and willful promotion of hatred; or mischief relating to religious property.Note In total, 235 charges for hate crime related offences were processed in the courts between 2009/2010 and 2017/2018. Hate crime charges largely comprised public incitement and willful promotion of hatred (83%), followed by mischief relating to religious property (10%) and advocating genocide (7%).
Of the 53 completed hate crime cases from 2009/2010 to 2017/2018, 43% ended in a finding of guilt, an additional 32% were withdrawn, dismissed, or discharged by the courts, and 9% were stayed or acquitted.
In 78% of hate crime cases ending in a finding of guilt, the accused was sentenced to probation. A sentence of custody was handed down in 30% of hate crime cases.
Currently, data from courts do not allow for an analysis of the use of sentencing provisions that take hate-motivation into account as an aggravating factor. As such, court data that are available on the hate crime offences outlined in the Criminal Code suggest that there have been relatively few such cases from 2009/2010 to 2017/2018. While about four in ten cases resulted in a guilty finding, the same is true for just under one in five of all hate crime charges completed in court over this period.
Summary
Following a 47% increase in 2017, the number of police-reported hate crimes in Canada was down 13% in 2018, from 2,073 incidents to 1,798. Despite this decline, the number of hate crimes remained higher (with the exception of 2017) than any other year since 2009, and follows an upward trend starting in 2014. The decrease is mainly due to a decrease in police-reported hate crime targeting religion, specifically the Muslim population, as well as those targeting the Black population and sexual orientation. These decreases were primarily the result of a sharp decline in hate crime in Ontario, and a more moderate decline in Quebec. Overall, crimes targeting the Jewish and Black populations were the most prevalent types of police-reported hate crime in Canada.
Non-violent crimes had a larger impact on the overall decline in hate crimes than did violent crimes. The decrease in non-violent hate crimes was driven primarily by a decrease in mischief offences (excluding mischief in relation to property used primarily for worship or by an identifiable group, which recorded an increase year-over-year). Although the majority of hate crimes are non-violent, analysis of characteristics of hate crimes reported to police between 2010 and 2018 suggest that hate-motivated crimes targeting sexual orientation, the South Asian, the Arab and West Asian, and the East and Southeast Asian populations are more likely to be violent than non-violent.
This multi-year analysis provides other insights into the variations in hate crimes across various groups. For instance, victims of violent hate crimes targeting sexual orientation and the Indigenous population tend to be the youngest among hate crime victims and sustain the highest rate of injury. Further, compared to other hate crime victims, victims of crimes targeting East and Southeast Asian population and the Muslim population were most likely to be victimized by strangers. In contrast, the rate of victimization by someone known to the victim was highest among victims of hate crimes targeting Black populations and sexual orientation.
Following consultation with stakeholders, including discussions with police services, amendments to the UCR survey are planned for the coming years to ensure police-reported data remains relevant. Among the planned amendments is the expansion of categories for hate crime type and motivation, such as adding a category for Immigrants/Newcomers/Xenophobia and for Multiple Motivations. Updates to detailed hate crime motivations include the expansion of the Age, Sexual orientation (including bisexual, heterosexual, gay, lesbian, asexual, pansexual), Gender (including male, female, transgender, gender diverse) Religion, and Race/Ethnicity categories.
Detailed data tables
Table 1 Police-reported hate crimes, by detailed motivation, Canada, 2014 to 2018
Table 2 Police-reported hate crimes, by most serious violation, Canada, 2017 and 2018
Table 7 Police-reported cyber-related hate crimes, 2014 to 2018
Table 8 Characteristics of hate crime victims, by motivation, Canada, 2010 to 2018
Table 9 Characteristics of persons accused of hate crimes, Canada, 2010 to 2018
Survey description
Incident-based Uniform Crime Reporting Survey
This article uses data from the Incident-based Uniform Crime Reporting Survey (UCR2). This is a microdata survey that captures detailed information on crimes reported to and substantiated by police, comprising the characteristics of victims, accused persons and incidents. In response to changing information needs, the survey was modified in 2005 (UCR2.2) to enable identification of incidents motivated by hate based on race, national or ethnic origin, religion, sexual orientation, gender identity or expression, language, sex, age, mental or physical disability, or any other similar factor.
In the UCR Survey, police services can report up to four offences per incident. However, to conform to statistical reporting standards for this survey, only the most serious offence in an incident is used in this analysis.
In 2018, police services reporting to the UCR 2.2 version of the survey or higher served 99.5% of the population of Canada.
A supplemental survey has been conducted each year since 2006 as a means of obtaining information on hate-motivated crimes from those police services reporting microdata but which had not yet converted their electronic reporting systems to the newest UCR2 version. These respondents were asked to identify those criminal incidents that had been motivated by hate and to manually provide aggregate counts of incidents by the detailed motivation to Statistics Canada. Additional information (e.g., type of crime, weapon use, level of injury and relationship) cannot be provided by these respondents. In 2018, the municipal police service Calgary was excluded due to poor data quality.
Additionally, detailed information about the incidents, such as the type of offence, as well as the characteristics of victims (in violent offences) and accused, were not available from the municipal police service of Calgary in 2018 and the municipal police service of Saint John in 2017. As such, characteristics of hate crime incidents in 2018 were reported by police services that cover 96.2% of the Canadian population. When comparing characteristic counts for data from 2018 to 2017, the municipal police services of Calgary and Saint John were excluded from the analysis.
Combined, coverage from UCR 2.2 version of the survey or higher, and the supplemental survey in 2018 is estimated at 99.95% of the population of Canada.
The Oshawa census metropolitan area (CMA) is excluded from the analysis of hate crimes by CMA due to the incongruity between the police service jurisdictional boundaries and the CMA boundaries. For the same reason, data from the Halton and Durham police services are also excluded. The exclusion of information from Halton police affects the coverage for the Toronto and Hamilton CMAs. The exclusion of information from the Durham police affects coverage for Toronto. As a result, information for the CMA of Toronto reflects data from police serving 91% of the population of the CMA of Toronto. For Hamilton, data cover 74% of the Hamilton CMA population.
The UCR2 Survey collects information on victims of violent crimes when they are identified in an incident. In 2018, information on 733 victims of violent offences was reported in 595 hate crime incidents. In 15% of violent hate crime incidents involving victims, more than one victim was identified. Information on victims reflects data reported by police services covering 96.2% of the population of Canada. It is not provided by police services reporting to the UCR 2.2 Supplemental Survey and excluded for the municipal police service of Calgary due to poor data quality.
UCR2 also collects information about persons accused of hate crime. In 2018, there was information on 621 accused individuals associated with 532 incidents. In 11% of these incidents, more than one accused was identified. Information on accused reflects data reported by police services serving 96.2% of the population of Canada. It is not provided by police services reporting to the UCR 2.2 Supplemental Survey and excluded for the municipal police service of Calgary due to poor data quality
Data on hate crimes are also available in Tables 35-10-0066-01 (formerly CANSIM 252-0092), 35-10-0067-01 (formerly CANSIM 252-0093), and 35-10-0191-01 (formerly CANSIM 252-0094).
References
Armstrong, A. 2019. "Police-reported hate crime in Canada, 2017." Juristat. Statistics Canada Catalogue no. 85-002-X.
Boutilier, A. 2018. "CSIS sees 'significant' jump in far-right activity online." The Toronto Star.
Boyce, J. 2016. "Victimization of Aboriginal people in Canada, 2014." Juristat. Statistics Canada Catalogue no. 85-002-X.
British Columbia Ministry of the Attorney General. 2008. End Hate Crime: B.C. Hate Crime Team Roles and Responsibilities.
Canadian Heritage, 2019. "Building a foundation for change: Canada's Anti-Racism Strategy 2019-2022." Ottawa.
Chongatera, G. 2013. "Hate-crime victimization and fear of hate crime among racially visible people in Canada: The role of income as a mediating factor." Journal of Immigrant & Refugee Studies. Vol. 11. p. 44 to 64.
Cotter, A. 2018. "Violent victimization of women with disabilities, 2014." Juristat. Statistics Canada Catalogue no. 85-002-X.
Cotter, A. 2015. "Spotlight on Canadians: Results from the General Social Survey – Public Confidence in Canadian Institutions." Statistics Canada Catalogue no. 85-652-X.
Edmonton Police Service. 2018. Hate and Bias Crime.
Government of Canada. 2019. "Canada's Digital Charter." Toronto.
Government of Canada. 2018. "National Strategy on Countering Radicalization to Violence." Ottawa.
HateCrimeBC. n.d. BC Hate Crimes.
Miladinovic, Z. and L. Mulligan. 2015. "Homicide in Canada, 2014." Juristat. Statistics Canada Catalogue no. 85-002-X.
Moreau, G. 2019. "Police-reported crime statistics in Canada, 2018." Juristat. Statistics Canada Catalogue no. 85-002-X.
Morris, S., Fawcett, G., Brisebois L. and J. Hughes. 2018. "A demographic, employment and income profile of Canadians with disabilities aged 15 years and over, 2017." Canadian Survey on Disability Reports. Statistics Canada Catalogue no. 89-654-X.
National Council of Canadian Muslims. 2014. 2013 ODIHR Hate Crime Report. Ottawa.
National Council of Canadian Muslims. 2017. 2016 ODIHR Hate Crime Report. Ottawa.
Office for Democratic Institutions and Human Rights. 2014. Hate Crimes in the Organization for Security and Co-operation in Europe Region–Incidents and Responses: Annual Report for 2014.
Office for Democratic Institutions and Human Rights. 2018. Prosecuting Hate Crimes: A Practical Guide.
Ontario Ministry of the Attorney General. 2010. Anti-Slapp Advisory Panel Report to the Attorney General.
Perreault, S. 2015. "Criminal victimization in Canada, 2014." Juristat. Statistics Canada Catalogue no. 85-002-X.
Perreault, S. 2013. "Self-reported internet victimization in Canada, 2009." Juristat. Statistics Canada Catalogue no. 85-002-X.
Perry, B. and Scrivens, R. 2016. "Uneasy alliances: A look at the right-wing extremist movement in Canada". Studies in Conflict and Terrorism. Vol. 39, no. 9. p. 819 to 841.
Perry, B. and Scrivens, R. 2017. "Resisting the Right: Countering right-wing extremism in Canada." Canadian Journal of Criminology and Criminal Justice. Vol. 59, no. 4. p. 534 to 558.
Perry, B. 2010. "Policing hate crime in a Multicultural society observations from Canada." International Journal of Law, Crime and Justice. Vol. 38. p. 120 to 140.
Public Safety Canada. 2018a. Funding Project Descriptions: Canada Redirect.
Public Safety Canada. 2018b. National Strategy on Countering Radicalization to Violence.
Putnam, R. 2007. "E Pluribus Unum: Diversity and community in the Twenty-First Century." Scandinavian Political Studies. Vol. 30, no. 2. p. 137 to 174.
Scrim, K. 2009. Aboriginal Victimization in Canada: A Summary of the Literature. Department of Justice.
Statistics Canada. 2010. Projections of the Diversity of the Canadian Population: 2006 to 2031. Statistics Canada Catalogue no. 91-551-X.
Statistics Canada. 2013a. Aboriginal Peoples in Canada: First Nations People, Métis and Inuit. National Household Survey, 2011. Statistics Canada Catalogue no. 99-011-X.
Statistics Canada. 2013b. Immigration and Ethnocultural Diversity in Canada. National Household Survey, 2011. Statistics Canada Catalogue no. 99-010-X.
Statistics Canada. 2017a. Study: A Look at Immigration, Ethnocultural Diversity and Languages in Canada up to 2036, 2011 to 2036. Statistics Canada Catalogue no. 91-551-X, Ottawa.
Statistics Canada. 2017b. "Same-sex couples in Canada in 2016." Census in brief, catalogue no. 98-200-X, Ottawa.
Statistics Canada. 2019. "Police-reported data on cybercrime, hate crime and organized crime, 2016, 2017 and 2018". The Daily.
Stevkovski, L. 2015. "The rise of Right-Wing extremism in European Union." Interdisciplinary Political and Cultural Journal. Vol. 17, no. 1. p. 43 to 57.
York Regional Police. 2018. Diversity, Equity and Inclusion.
- Date modified: