
Safe Cities profile series: Key indicators by census metropolitan area
Brantford, Ontario

Satisfaction with safety

Brantford 80%, Ontario 89%, Canada 88%
proportion of people who reported being satisfied with their personal safety from crime in 2014
* significantly different from Brantford (p < 0.05)
Police-reported violent crime rate in 2018

Brantford 1,335, Ontario 899, Canada 1,143
rate per 100,000 population
Ten-year change in police-reported crime rate (2008 to 2018)
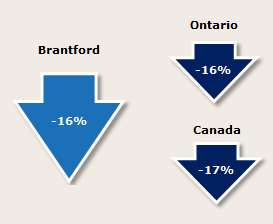
Brantford -16%, Ontario -16%, Canada, -17%
Population and demographics

Brantford, Ontario
Brantford was home to 147,548 people in 2018, and it had a population density of 137 residents per square kilometre. Three in ten (30%) residents were aged 24 and younger, on par with the distribution in Ontario (29%) and across Canada (28%).
About 4.8% of Brantford residents were part of the Indigenous population (First Nations, Métis and Inuit) in 2016, higher than in Ontario (2.8%) but similar to Canada (4.9%). Immigrants represented one in eight (13%) residents, far lower than in Ontario (29%) and Canada (22%). Less than one in ten (6.7%) immigrants in Brantford were recent immigrants (since 2011), lower than in Ontario (12.3%) and Canada (16.1%). The proportion of people who identified as a visible minority in Brantford (7.8%) was notably lower than Ontario (29.3%) and Canada overall (22.3%).
Education, employment and income
In 2016, over half (57%) of Brantford residents aged 25 to 64 had completed some form of postsecondary education, three in ten (30%) had completed high school (or equivalent) as their highest level of education, and about one in eight (13%) had completed neither.
In 2018, the unemployment rate in Brantford (6.2%) was slightly higher than in Ontario (5.6%) and Canada’s provinces (5.8%). Households in Brantford earned a median after-tax annual income of $50,940 in 2017, somewhat lower than in Ontario ($53,850) and Canada ($52,090). The percentage of families considered low-income was the same in Brantford (17%), Ontario (17%) and Canada (17%).
Housing and families
On average, there were 2.5 persons per household in Brantford in 2016, similar to Ontario (2.6) and Canada (2.4). Most (72%) households in Brantford owned their homes, slightly higher than Ontario (70%) and Canada (68%). When a household spends 30% or more of its income on shelter costs, it is considered to live in unaffordable housing: this was the case for nearly one in four (23%) Brantford households, lower than in Ontario (28%) but close to Canada (24%). A small proportion (6.8%) of occupied private dwellings in Brantford were in need of major repairs, similar to Ontario (6.1%) and Canada (6.5%). Just under one-fifth (18%) of Brantford families were lone-parent families, similar to Ontario (17%) and Canada (16%). In 2018, there was an estimated minimum of 186 homeless individuals living in Brantford.
Community safety and sense of belonging
- In 2014, one in three (32%E) Brantford residents aged 15 and older were very satisfied with their personal safety from crime, not significantly different from Ontario residents (40%) and Canadians living in the provinces overall (38%).
- More than half (56%) of Brantford residents felt very safe when walking alone after dark, which was not significantly different from the proportion of residents in Ontario (51%) and Canada’s provinces (52%).
- Women who lived in Brantford were significantly less likely than men to feel very safe when walking alone after dark (32%E versus 77%), similar to Ontario and Canada’s provinces.
- About one in five (22%E) Brantford residents thought social disorder was a big or moderate problem in their neighbourhood, on par with Ontario (21%) and Canada’s provinces (22%).
- Nearly one in four (23%E) Brantford residents said they had a very strong sense of belonging to their community, which was similar to Ontario (25%) and Canada’s provinces (25%).
- About 21%E of Brantford residents said they knew most people in their neighbourhood in 2014, on par with Ontario (20%) and Canada’s provinces (21%).
- The large majority (68%) of Brantford residents thought crime levels in their neighbourhood were lower than the rest of Canada, which was not significantly different from Ontario (76%) and Canada’s provinces (74%).
- The vast majority (88%) of Brantford residents reported having confidence in police in 2014, which was not significantly different from the proportion in Ontario (91%) and Canada’s provinces (91%).
Police-reported crime
- In 2018, Brantford police reported an overall crime rate of 6,533 incidents per 100,000 population, 59% higher than in Ontario (4,113) and 19% higher than in Canada (5,488).
- Over the past decade (2008 to 2018), police-reported crime declined by 16% in Brantford, on par with the decline in Ontario (-16%) and Canada (-17%).
- The severity of crime in Brantford increased by 6% between 2017 and 2018, mostly due to an increase in theft of motor vehicle, homicide, and breaking and entering. Over the past decade (2008 to 2018), the severity of crime in Brantford declined by 11%, compared with a 15% decline in Ontario and a 17% decline in Canada.
Property crime
- Police-reported: There were 4,157 property crimes per 100,000 population reported by police in Brantford in 2018, 59% higher than in Ontario (2,621) and 24% higher than Canada (3,339).
Violent crime
- In 2018, there were 1,335 incidents of violent crime per 100,000 population reported by police in Brantford, 49% higher than Ontario (899) and 17% higher than Canada overall (1,143).
- In Brantford, just over half (55%) of victims of violent crime were female, similar to Ontario (53%) and Canada (53%).
- Between 2008 and 2018:
- The violent crime rate in Brantford declined by 18%, somewhat larger than the decline seen in Ontario (-14%) and Canada (-14%).
- The severity of violent crime in Brantford increased by 13%, while there was a decline seen in Ontario (-11%) and Canada (-13%).
- Violent crime against girls and women in Brantford had a much smaller decline between 2009 and 2018 than violent crime against boys and men (-13% versus -28%).
Hate crime
- The police-reported hate crime rate—which depends on police services' level of expertise in identifying crimes motivated by hate—was about four times lower in Brantford (1.3 incidents per 100,000 population) than in Ontario (5.3) and Canada (4.9) in 2018.
- Between 2014 and 2018, the rate of police-reported hate crime in Brantford decreased by 39%, whereas an increase was seen in Ontario (+10%) and Canada (+33%).
Intimate partner violence
- There were 373 victims of intimate partner violence per 100,000 population aged 15 and older reported by police in Brantford in 2018, 54% higher than Ontario (243) and 16% higher than Canada (323).
- The large majority (78%) of victims of police-reported intimate partner violence in Brantford were female, similar to Ontario (81%) and Canada (79%).
- Same-sex partners accounted for 2.6% of police-reported intimate partner violence in Brantford between 2009 and 2018, lower than in Ontario (4.2%) and Canada (3.4%).
Homicide
- In 2018, Brantford had 5 homicides—a rate of 3.36 per 100,000 population—almost two times higher than Ontario (1.86) and Canada (1.76).
- Of the 5 homicide victims in Brantford, 1 was female (20%). This was a lower proportion than in Ontario (27%) and Canada (25%).
- The number of homicides in Brantford increased from 2 victims in 2008 to 5 victims in 2018.
Charts and tables
Chart 1 start
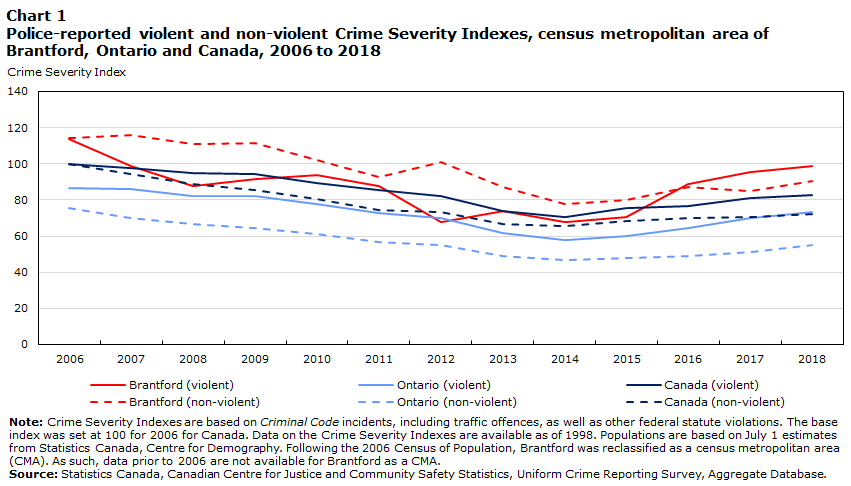
Data table for Chart 1
| Year | Violent Crime Severity Index | Non-violent Crime Severity Index | ||||
|---|---|---|---|---|---|---|
| Brantford | Ontario | Canada | Brantford | Ontario | Canada | |
| index | ||||||
| 2006 | 114 | 87 | 100 | 115 | 75 | 100 |
| 2007 | 99 | 86 | 98 | 116 | 70 | 94 |
| 2008 | 88 | 82 | 95 | 111 | 67 | 89 |
| 2009 | 91 | 82 | 94 | 112 | 64 | 85 |
| 2010 | 94 | 78 | 89 | 102 | 61 | 81 |
| 2011 | 88 | 73 | 86 | 93 | 57 | 75 |
| 2012 | 68 | 70 | 82 | 101 | 55 | 73 |
| 2013 | 74 | 62 | 74 | 87 | 49 | 67 |
| 2014 | 67 | 58 | 71 | 78 | 47 | 65 |
| 2015 | 70 | 60 | 75 | 80 | 48 | 68 |
| 2016 | 89 | 65 | 77 | 87 | 49 | 70 |
| 2017 | 96 | 70 | 81 | 85 | 51 | 71 |
| 2018 | 99 | 73 | 82 | 90 | 55 | 72 |
|
Note: Crime Severity Indexes are based on Criminal Code incidents, including traffic offences, as well as other federal statute violations. The base index was set at 100 for 2006 for Canada. Data on the Crime Severity Indexes are available as of 1998. Populations are based on July 1 estimates from Statistics Canada, Centre for Demography. Following the 2006 Census of Population, Brantford was reclassified as a census metropolitan area (CMA). As such, data prior to 2006 are not available for Brantford as a CMA. Source: Statistics Canada, Canadian Centre for Justice and Community Safety Statistics, Uniform Crime Reporting Survey, Aggregate Database. |
||||||
Chart 1 end
Chart 2 start
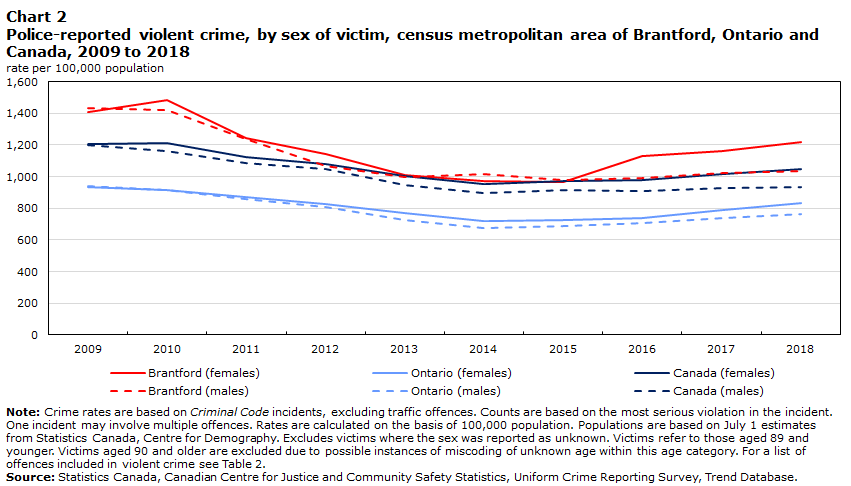
Data table for Chart 2
| Year | Female victims | Male victims | ||||
|---|---|---|---|---|---|---|
| Brantford | Ontario | Canada | Brantford | Ontario | Canada | |
| rate per 100,000 population | ||||||
| 2009 | 1,406 | 937 | 1,206 | 1,432 | 940 | 1,202 |
| 2010 | 1,486 | 917 | 1,209 | 1,420 | 913 | 1,162 |
| 2011 | 1,244 | 872 | 1,124 | 1,236 | 859 | 1,087 |
| 2012 | 1,142 | 824 | 1,079 | 1,064 | 809 | 1,048 |
| 2013 | 1,011 | 771 | 1,004 | 995 | 726 | 947 |
| 2014 | 971 | 721 | 952 | 1,019 | 675 | 898 |
| 2015 | 965 | 729 | 970 | 978 | 687 | 914 |
| 2016 | 1,129 | 741 | 978 | 994 | 708 | 910 |
| 2017 | 1,160 | 790 | 1,019 | 1,021 | 739 | 926 |
| 2018 | 1,219 | 834 | 1,048 | 1,038 | 766 | 936 |
|
Note: Crime rates are based on Criminal Code incidents, excluding traffic offences. Counts are based on the most serious violation in the incident. One incident may involve multiple offences. Rates are calculated on the basis of 100,000 population. Populations are based on July 1 estimates from Statistics Canada, Centre for Demography. Excludes victims where the sex was reported as unknown. Victims refer to those aged 89 and younger. Victims aged 90 and older are excluded due to possible instances of miscoding of unknown age within this age category. For a list of offences included in violent crime see Table 2. Source: Statistics Canada, Canadian Centre for Justice and Community Safety Statistics, Uniform Crime Reporting Survey, Trend Database. |
||||||
Chart 2 end
Chart 3 start
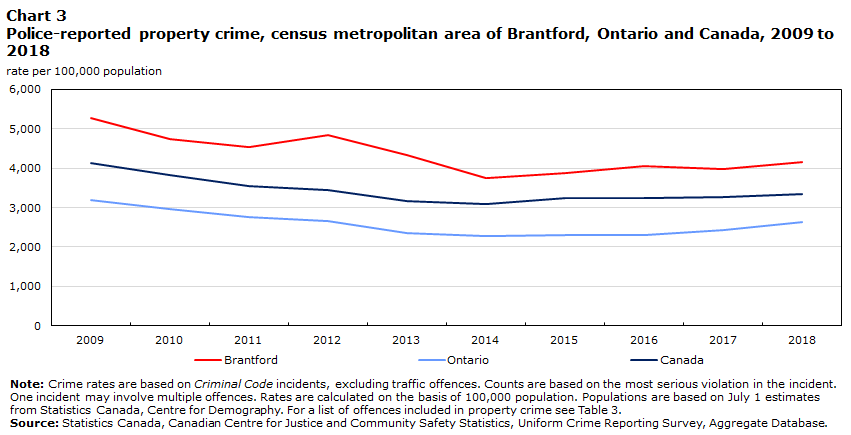
Data table for Chart 3
| Year | Brantford | Ontario | Canada |
|---|---|---|---|
| rate per 100,000 population | |||
| 2009 | 5,278 | 3,193 | 4,122 |
| 2010 | 4,736 | 2,968 | 3,838 |
| 2011 | 4,544 | 2,760 | 3,536 |
| 2012 | 4,846 | 2,648 | 3,438 |
| 2013 | 4,330 | 2,365 | 3,154 |
| 2014 | 3,748 | 2,281 | 3,100 |
| 2015 | 3,880 | 2,290 | 3,231 |
| 2016 | 4,063 | 2,315 | 3,239 |
| 2017 | 3,980 | 2,428 | 3,266 |
| 2018 | 4,157 | 2,621 | 3,339 |
|
Note: Crime rates are based on Criminal Code incidents, excluding traffic offences. Counts are based on the most serious violation in the incident. One incident may involve multiple offences. Rates are calculated on the basis of 100,000 population. Populations are based on July 1 estimates from Statistics Canada, Centre for Demography. For a list of offences included in property crime see Table 3. Source: Statistics Canada, Canadian Centre for Justice and Community Safety Statistics, Uniform Crime Reporting Survey, Aggregate Database. |
|||
Chart 3 end
Table 1 start
| Type of offence | Brantford | Ontario | Canada | Percent difference between Brantford and Ontario | Percent difference between Brantford and Canada |
|---|---|---|---|---|---|
| rate | |||||
| Total crime (excluding traffic) | 6,533 | 4,113 | 5,488 | 59 | 19 |
| Total violent crime | 1,335 | 899 | 1,143 | 49 | 17 |
| Violations causing death and attempted murder | 5 | 5 | 4 | 13 | 27 |
| Sexual assault and sexual violations against childrenTable 1 Note 1 | 136 | 91 | 101 | 50 | 35 |
| AssaultsTable 1 Note 2 | 771 | 500 | 649 | 54 | 19 |
| Other violent offences | 423 | 303 | 389 | 39 | 8 |
| Total property crime | 4,157 | 2,621 | 3,339 | 59 | 24 |
| Breaking and entering | 620 | 319 | 431 | 94 | 44 |
| TheftTable 1 Note 3 | 2,280 | 1,506 | 1,720 | 51 | 33 |
| Fraud | 476 | 381 | 402 | 25 | 18 |
| MischiefTable 1 Note 4 | 619 | 372 | 699 | 67 | -11 |
| Other property crime offences | 162 | 43 | 86 | 273 | 88 |
| Total other Criminal Code offences | 1,041 | 593 | 1,006 | 76 | 3 |
| Total Criminal Code traffic offences | 216 | 199 | 339 | 9 | -36 |
| Total alcohol-impaired drivingTable 1 Note 5 | 105 | 92 | 178 | 14 | -41 |
| Total drug-impaired drivingTable 1 Note 6 | 7 | 6 | 12 | 19 | -38 |
| Alcohol and drug-impaired drivingTable 1 Note 7 | 2 | 0.6 | 0.7 | 261 | 199 |
| Impaired driving (not specified)Table 1 Note 7 | 0 | 0.4 | 0.3 | -100 | -100 |
| Other Criminal Code traffic offences | 102 | 99 | 148 | 2 | -31 |
| Total drug offences | 222 | 146 | 225 | 52 | -1 |
| Total other federal statute offences | 58 | 29 | 70 | 97 | -18 |
| Total all offences | 7,029 | 4,487 | 6,123 | 57 | 15 |
Source: Statistics Canada, Canadian Centre for Justice and Community Safety Statistics, Uniform Crime Reporting Survey, Aggregate Database. |
|||||
Table 1 end
Table 2 start
| Type of offence | Brantford | Ontario | Canada | |||
|---|---|---|---|---|---|---|
| Female victims | Male victims | Female victims | Male victims | Female victims | Male victims | |
| rate | ||||||
| Total violent crime | 1,219 | 1,038 | 834 | 766 | 1,048 | 936 |
| Violations causing death and attempted murder | 0 | 7 | 3 | 7 | 2 | 6 |
| Homicide | 0 | 3 | 1 | 3 | 0.9 | 3 |
| Other violations causing deathTable 2 Note 1 | 0 | 0 | 0.3 | 0.4 | 0.3 | 0.3 |
| Attempted murder | 0 | 4 | 1 | 4 | 1 | 3 |
| Sexual offences | 223 | 33 | 152 | 22 | 170 | 23 |
| Sexual assault | 160 | 23 | 130 | 17 | 134 | 16 |
| Sexual assault – level 3 – aggravated | 0 | 1 | 0.4 | 0.1 | 0.7 | 0.1 |
| Sexual assault – level 2 – weapon or bodily harm | 0 | 0 | 2 | 0.5 | 2 | 0.4 |
| Sexual assault – level 1 | 160 | 21 | 128 | 17 | 131 | 16 |
| Sexual violations against childrenTable 2 Note 2 | 63 | 10 | 22 | 5 | 36 | 7 |
| Assaults | 660 | 732 | 467 | 510 | 613 | 644 |
| Physical assault | 636 | 652 | 456 | 463 | 599 | 590 |
| Assault – level 3 – aggravated | 1 | 14 | 4 | 10 | 6 | 13 |
| Assault – level 2 – weapon or bodily harm | 104 | 210 | 83 | 126 | 111 | 173 |
| Assault – level 1 | 531 | 427 | 369 | 327 | 483 | 404 |
| Assault against a peace officer | 6 | 51 | 7 | 37 | 10 | 48 |
| Other assaults | 18 | 29 | 4 | 10 | 4 | 7 |
| Other violent offences | 336 | 266 | 213 | 227 | 263 | 262 |
| Firearms – use of, discharge, pointing | 1 | 3 | 2 | 6 | 2 | 6 |
| Robbery | 22 | 64 | 27 | 83 | 31 | 75 |
| Forcible confinement or kidnapping | 14 | 1 | 12 | 2 | 15 | 3 |
| Trafficking in personsTable 2 Note 3 | 3 | 0 | 2 | 0sNote: value rounded to 0 (zero) where there is a meaningful distinction between true zero and the value that was rounded. A “0” represents a true zero value. | 1 | 0sNote: value rounded to 0 (zero) where there is a meaningful distinction between true zero and the value that was rounded. A “0” represents a true zero value. |
| Extortion | 1 | 7 | 4 | 7 | 6 | 9 |
| Criminal harassment | 110 | 23 | 52 | 16 | 53 | 17 |
| Uttering threats | 131 | 150 | 85 | 102 | 114 | 134 |
| Indecent or harassing communications | 10 | 4 | 16 | 8 | 22 | 9 |
| Non-consensual distribution of intimate images | 15 | 0 | 5 | 0.8 | 7 | 1 |
| Commodification of sexual activityTable 2 Note 4 | 0 | 0 | 0.6 | 0sNote: value rounded to 0 (zero) where there is a meaningful distinction between true zero and the value that was rounded. A “0” represents a true zero value. | 1 | 0.1 |
| Other violent offences | 28 | 13 | 6 | 3 | 10 | 8 |
| Total traffic offences | 6 | 4 | 2 | 3 | 16 | 21 |
| Traffic violations causing death | 0 | 0 | 0.3 | 0.7 | 0.4 | 0.9 |
| Traffic violations causing bodily harm | 6 | 4 | 2 | 3 | 6 | 7 |
| Traffic violations – injury unspecified or unknownTable 2 Note 5 | 0 | 0 | 0.1 | 0 | 9 | 12 |
0s value rounded to 0 (zero) where there is a meaningful distinction between true zero and the value that was rounded. A “0” represents a true zero value.
Source: Statistics Canada, Canadian Centre for Justice and Community Safety Statistics, Uniform Crime Reporting Survey, Trend Database. |
||||||
Table 2 end
Table 3 start
| Type of offence | Brantford | Ontario | Canada | |||
|---|---|---|---|---|---|---|
| number | rate | number | rate | number | rate | |
| Total non-violent crime | 8,461 | 5,694 | 513,941 | 3,588 | 1,845,269 | 4,979 |
| Total property crime | 6,177 | 4,157 | 375,402 | 2,621 | 1,237,324 | 3,339 |
| Breaking and entering | 921 | 620 | 45,736 | 319 | 159,812 | 431 |
| Possess stolen propertyTable 3 Note 1 | 113 | 76 | 4,854 | 34 | 23,898 | 64 |
| Theft of motor vehicle | 811 | 546 | 23,952 | 167 | 86,132 | 232 |
| Theft over $5,000 (non-motor vehicle) | 69 | 46 | 5,887 | 41 | 20,113 | 54 |
| Theft of $5,000 or under (non-motor vehicle) | 2,508 | 1,688 | 185,837 | 1,297 | 531,312 | 1,434 |
| Fraud | 643 | 433 | 49,193 | 343 | 129,409 | 349 |
| Identity theft | 22 | 15 | 426 | 3 | 3,745 | 10 |
| Identity fraud | 42 | 28 | 4,907 | 34 | 15,839 | 43 |
| MischiefTable 3 Note 2 | 920 | 619 | 53,236 | 372 | 259,064 | 699 |
| Arson | 128 | 86 | 1,374 | 10 | 8,000 | 22 |
| Total other offences | 1,547 | 1,041 | 84,959 | 593 | 372,834 | 1,006 |
| Weapons violations | 64 | 43 | 4,415 | 31 | 16,610 | 45 |
| Child pornographyTable 3 Note 3 | 15 | 10 | 1,669 | 12 | 5,843 | 16 |
| ProstitutionTable 3 Note 4 | 0 | 0 | 29 | 0.2 | 110 | 0.3 |
| Terrorism | 0 | 0 | 58 | 0.4 | 102 | 0.3 |
| Disturb the peace | 61 | 41 | 5,075 | 35 | 94,378 | 255 |
| Administration of justice offences | 1,267 | 853 | 66,876 | 467 | 226,864 | 612 |
| Other offences | 140 | 94 | 6,837 | 48 | 28,927 | 78 |
| Total Criminal Code traffic offences | 321 | 216 | 28,446 | 199 | 125,544 | 339 |
| Total alcohol-impaired drivingTable 3 Note 5 | 156 | 105 | 13,216 | 92 | 65,820 | 178 |
| Total drug-impaired drivingTable 3 Note 6 | 11 | 7 | 894 | 6 | 4,429 | 12 |
| Alcohol and drug-impaired drivingTable 3 Note 7 | 3 | 2 | 80 | 0.6 | 250 | 0.7 |
| Impaired driving (not specified)Table 3 Note 7 | 0 | 0 | 55 | 0.4 | 94 | 0.3 |
| Other Criminal Code traffic offences | 151 | 102 | 14,201 | 99 | 54,951 | 148 |
| Total drug offences | 330 | 222 | 20,937 | 146 | 83,483 | 225 |
| Total other federal statute offences | 86 | 58 | 4,197 | 29 | 26,084 | 70 |
| Human traffickingTable 3 Note 8 | 0 | 0 | 94 | 0.7 | 112 | 0.3 |
| Youth Criminal Justice Act | 54 | 36 | 1,076 | 8 | 4,823 | 13 |
| Other federal statute offences | 32 | 22 | 3,027 | 21 | 21,149 | 57 |
Source: Statistics Canada, Canadian Centre for Justice and Community Safety Statistics, Uniform Crime Reporting Survey, Aggregate Database. |
||||||
Table 3 end
Table 4 start
| Year | Violent crime | Property crime | Total crime | ||||||
|---|---|---|---|---|---|---|---|---|---|
| number | rate | percent change in rate from previous year | number | rate | percent change in rate from previous year | number | rate | percent change in rate from previous year | |
| 2008 | 2,246 | 1,632 | -0.9 | 7,307 | 5,309 | -5 | 10,683 | 7,762 | -5 |
| 2009 | 2,349 | 1,696 | 4 | 7,311 | 5,278 | -0.6 | 10,910 | 7,876 | 1 |
| 2010 | 2,290 | 1,643 | -3 | 6,601 | 4,736 | -10 | 10,133 | 7,270 | -8 |
| 2011 | 2,026 | 1,443 | -12 | 6,379 | 4,544 | -4 | 9,580 | 6,824 | -6 |
| 2012 | 1,869 | 1,326 | -8 | 6,829 | 4,846 | 7 | 9,779 | 6,940 | 2 |
| 2013 | 1,730 | 1,220 | -8 | 6,139 | 4,330 | -11 | 8,872 | 6,257 | -10 |
| 2014 | 1,806 | 1,267 | 4 | 5,343 | 3,748 | -13 | 8,061 | 5,655 | -10 |
| 2015 | 1,823 | 1,271 | 0.3 | 5,566 | 3,880 | 4 | 8,338 | 5,813 | 3 |
| 2016 | 1,920 | 1,326 | 4 | 5,882 | 4,063 | 5 | 9,100 | 6,286 | 8 |
| 2017 | 1,907 | 1,301 | -2 | 5,833 | 3,980 | -2 | 9,148 | 6,242 | -0.7 |
| 2018 | 1,984 | 1,335 | 3 | 6,177 | 4,157 | 4 | 9,708 | 6,533 | 5 |
| Percent change from 2008 to 2018 | -12 | -18 | Note ...: not applicable | -15 | -22 | Note ...: not applicable | -9 | -16 | Note ...: not applicable |
|
... not applicable Note: Crime rates are based on Criminal Code incidents, excluding traffic offences. Counts are based on the most serious violation in the incident. One incident may involve multiple offences. Rates are calculated on the basis of 100,000 population. Populations are based on July 1 estimates from Statistics Canada, Centre for Demography. Percent changes are based on unrounded rates. For a list of offences included in violent crime see Table 2 and for a list of offences included in property crime see Table 3. Total crime includes violent, property and other types of crimes. Source: Statistics Canada, Canadian Centre for Justice and Community Safety Statistics, Uniform Crime Reporting Survey, Aggregate Database. |
|||||||||
Table 4 end
E use with caution
Note:This fact sheet contains data that come from multiple sources across multiple reference years. Some figures may be presented differently than in other Statistics Canada publications due to rounding. For detailed information on data definitions and sources, please refer to the Safe Cities profile series: Definitions and data sources document.
- Date modified: