
Homicide in Canada, 2018

Archived Content
Information identified as archived is provided for reference, research or recordkeeping purposes. It is not subject to the Government of Canada Web Standards and has not been altered or updated since it was archived. Please "contact us" to request a format other than those available.
by Joel Roy and Sharon Marcellus
Highlights
- In 2018, police reported 651 homicides, 15 fewer than the previous year. This represents a 4% decrease in the homicide rate from 1.82 homicides per 100,000 population in 2017 to 1.76 in 2018.
- The decrease in the national number of homicides was a result of notably fewer victims in Alberta (-38 homicides), British Columbia (-30), Quebec (-10) and Nova Scotia (-10), but was offset by a record increase in Ontario due to homicides in the Toronto census metropolitan area.
- There were 266 homicides reported in Ontario in 2018, an increase of 69 from 2017. This is the highest number of homicides and the largest year over year increase reported in a single province since Statistics Canada began collecting this data in 1961. With a rate of 1.86 per 100,000 population, it is also the highest rate in Ontario since 1991 (2.36).
- With 142 victims in 2018, Toronto, Canada’s most populated census metropolitan area (CMA), had the most homicides of all CMAs as well as the most homicides ever reported in Toronto since collection at the CMA level began in 1981. This is a 53% increase in the number of victims (93 victims in 2017) and a 50% increase in the rate of homicide from 2017 (1.51 victims per 100,000 population in 2017 to 2.26 victims per 100,000 population in homicides 2018).
- The national rates for both firearm-related (-8%) and gang-related (-5%) homicides declined in 2018. This marks the first decrease in firearm-related homicides since 2013 and the first decrease in gang-related homicides since 2014.
- The national year over year decline in the number of firearm-related homicides (-18) is a result of fewer firearm-related homicides in areas outside of census metropolitan areas (-20).
- In 2018, there were 140 Indigenous victims of homicide, a decrease from 157 in 2017. Although the rate of homicide for Indigenous peoples in 2018 decreased from 2017 (7.31 per 100,000 Indigenous people in 2018 compared to 8.45 in 2017), it was still approximately five times higher than the rate for non-Indigenous people (1.44 per 100,000 non-Indigenous people in 2018). The highest rates of homicide were among Indigenous male victims, followed by Indigenous females and non-Indigenous males.
- Spousal homicide was the only category of homicide to increase in 2018 (+9 victims). In contrast, there were 31 fewer homicides committed by someone with whom the victim had a criminal relationship (e.g., drug dealers and their clients).
Representing less than 0.2% of all violent crimes in Canada in 2018, homicides account for a fraction of all police-reported violent Criminal Code offences (Moreau 2019).Note While homicide continues to be a relatively rare occurrence in Canada, homicide rates are considered benchmarks for levels of violent activity both in Canada and internationally (Ouimet and Montmagny-Grenier, 2014).
Unlike other crimes, the definition of homicide tends to be fairly consistent across nations. It is also not subject to frequent change or differences in reporting behaviour when compared to other crimes and there is more international consensus on the nature and meaning of homicide than any other criminal offence. Thus, homicide is important to examine, not only because of its severity, but also because it is considered as a comparable and reliable barometer of violence in society. Further, homicide rates may influence perceptions of safety within communities (Romer et al. 2003).
Based on the 2017 data collected by the United Nations Office on Drugs and Crime (UNODC), the most recent year available, Canada has a higher homicide rate compared to a number of other developed countries, except the United States (UNODC 2019). For example, Canada in 2017 stood at a homicide rate of 1.8 per 100,000 population, where Australia had a rate of 0.8, England a rate of 1.2, and New Zealand a rate of 0.7. However, the United States far surpassed these regions at a homicide rate of 5.3 per 100,000 population.
Prior to 2018, Canada’s homicide rate had been steadily increasing since 2013, from 1.5 to 1.8 over the 5 year period (2013 to 2017). Similarly, the United States' homicide rate increased by 0.8 homicides per 100,000 population and England’s rate also increased by 0.3 over this 5 year period. Despite many countries observing increases, both New Zealand and Australia have seen decreases in recent years. New Zealand saw a decrease of 0.4 in 2017 (when compared to 2016), and Australia’s homicide rate steadily decreased between 2013 and 2017, resulting in a 0.3 decrease over 5 years.
The worldwide homicide rate is estimated at about 6.1 per 100,000 population. The 2017 UNODC report provides data for 100 out of 240 countries worldwide. When comparing the rates of all 100 countries, Canada ranked 47 with a rate of 1.8 per 100,000.
Using data from Statistics Canada's Homicide Survey, this Juristat article examines changes in homicides in Canada over time and examines the characteristics of homicides committed in 2018. It presents information on the age and sex of homicide victims, the methods used to commit homicide (including the use of firearms), whether the homicide was determined to be gang-related, the relationship of the accused to the victim, as well as other characteristics of the accused. In addition, information is presented on homicide victims and accused who were identified as Indigenous.Note
National homicide rate decreases in 2018, but varies across provinces and territories
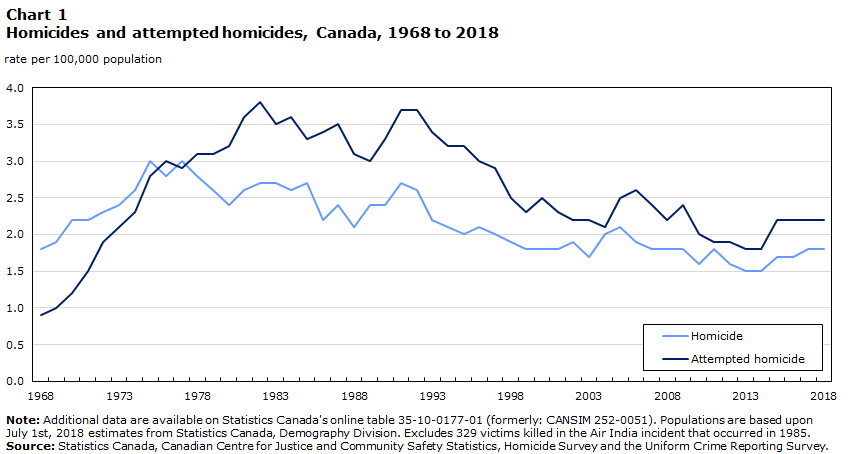
In 2018, police reported 651 homicides, 15 fewer than the previous year. This represented a 4% decreaseNote in the homicide rate, from 1.82 homicides per 100,000 population in 2017 to 1.76 in 2018 (Table 1a and Table 1b).Note It should be noted that 2017 was an exceptional year when police recorded the highest number of homicides since 1992 and the highest rate since 2008.Note Despite the year over year decrease, the 2018 homicide rate remained higher than the average for the previous decade (1.68 per 100,000 population for 2008 to 2017) (Chart 1).
Chart 1 start
Data table for Chart 1
| Year | Homicide | Attempted homicide |
|---|---|---|
| rate per 100,000 population | ||
| 1968 | 1.8 | 0.9 |
| 1969 | 1.9 | 1.0 |
| 1970 | 2.2 | 1.2 |
| 1971 | 2.2 | 1.5 |
| 1972 | 2.3 | 1.9 |
| 1973 | 2.4 | 2.1 |
| 1974 | 2.6 | 2.3 |
| 1975 | 3.0 | 2.8 |
| 1976 | 2.8 | 3.0 |
| 1977 | 3.0 | 2.9 |
| 1978 | 2.8 | 3.1 |
| 1979 | 2.6 | 3.1 |
| 1980 | 2.4 | 3.2 |
| 1981 | 2.6 | 3.6 |
| 1982 | 2.7 | 3.8 |
| 1983 | 2.7 | 3.5 |
| 1984 | 2.6 | 3.6 |
| 1985 | 2.7 | 3.3 |
| 1986 | 2.2 | 3.4 |
| 1987 | 2.4 | 3.5 |
| 1988 | 2.1 | 3.1 |
| 1989 | 2.4 | 3.0 |
| 1990 | 2.4 | 3.3 |
| 1991 | 2.7 | 3.7 |
| 1992 | 2.6 | 3.7 |
| 1993 | 2.2 | 3.4 |
| 1994 | 2.1 | 3.2 |
| 1995 | 2.0 | 3.2 |
| 1996 | 2.1 | 3.0 |
| 1997 | 2.0 | 2.9 |
| 1998 | 1.9 | 2.5 |
| 1999 | 1.8 | 2.3 |
| 2000 | 1.8 | 2.5 |
| 2001 | 1.8 | 2.3 |
| 2002 | 1.9 | 2.2 |
| 2003 | 1.7 | 2.2 |
| 2004 | 2.0 | 2.1 |
| 2005 | 2.1 | 2.5 |
| 2006 | 1.9 | 2.6 |
| 2007 | 1.8 | 2.4 |
| 2008 | 1.8 | 2.2 |
| 2009 | 1.8 | 2.4 |
| 2010 | 1.6 | 2.0 |
| 2011 | 1.8 | 1.9 |
| 2012 | 1.6 | 1.9 |
| 2013 | 1.5 | 1.8 |
| 2014 | 1.5 | 1.8 |
| 2015 | 1.7 | 2.2 |
| 2016 | 1.7 | 2.2 |
| 2017 | 1.8 | 2.2 |
| 2018 | 1.8 | 2.2 |
|
Note: Additional data are available on Statistics Canada's online table 35-10-0177-01 (formerly: CANSIM 252-0051). Populations are based upon July 1st, 2018 estimates from Statistics Canada, Demography Division. Excludes 329 victims killed in the Air India incident that occurred in 1985. Source: Statistics Canada, Canadian Centre for Justice and Community Safety Statistics, Homicide Survey and the Uniform Crime Reporting Survey. |
||
Chart 1 end
The decrease in the national number of homicides in 2018 was a result of notably fewer homicides in Alberta (-38 victims), British Columbia (-30), Quebec (-10) and Nova Scotia (-10). With the exception of Alberta, these provinces had reported notable increases in 2017 (Table 1a and Table 1b).
While there was a decline in homicide statistics at the national level, Ontario, with 69 more victims in 2018 than in 2017, reported the largest year over year increase and the highest number of homicides since homicide collection began in 1961. This resulted in the highest rate in Ontario since 1991 (1.86 per 100,000 population). The increase is mostly a result of the increase of 49 homicides in the census metropolitan area (CMA) of Toronto.
There were three uncommon events that occurred in Toronto which impacted the number of homicides reported for that CMA in 2018. These include the discovery of eight victims of serial homicide committed during a seven-year period from 2010 to 2017 (Powers 2019),Note an attack in the North York City Centre business district of Toronto, where pedestrians were deliberately struck by a van, which resulted in 10 homicide victims and 13 victims of attempted homicide (Moreau 2019) and, a shooting on Danforth Avenue in Toronto’s Greektown which left 2 homicide victims and 13 victims of attempted homicide (CBC News 2018).Note
The number of homicides reported also increased in Manitoba (+8), New Brunswick (+3), the Northwest Territories (+4) and Nunavut (+2). Notably, the murder of two police officers accounted for 2 of the 13 homicides in New Brunswick in 2018.
Rate of attempted homicides also down in 2018
The rate of attempted homicide has consistently remained higher than the rate of homicide since the 1980s, and these offences have often had similar trends over time. Accordingly, the rate of attempted homicide in Canada decreased 3% between 2017 and 2018 (2.25 attempted homicides per 100,000 population in 2017 to 2.18 in 2018) (Chart 1). Almost all provinces reported decreases in the number of attempted homicides in 2018 compared to 2017, Ontario recorded an additional 81 attempted homicides (Moreau 2019). In total, there were 807 attempted homicides reported by police in Canada in 2018, 14 fewer than the previous year.
Decrease in homicides attributable to lower numbers in the provincial south
The total decrease in Canadian homicides in 2018 is attributable to a decrease in the southern parts of Canada.Note The number of homicides in the south declined by 19 whereas homicides in northern Canada, which includes the provincial north and the territories, increased by 4.
Recent reports indicate that overall rates of violent crime in Canada, including homicide, are higher in rural areas than urban areas and that higher rates of rural crime are mainly observed in the northern areas of the provinces (Perreault 2019). This was reflected in the homicide statistics for 2018.
In 2018, homicide rates were three times higher in the northern regions of CanadaNote than the southern regions (4.9 victims per 100,000 population compared to 1.55) (Chart 2). The greatest differences were seen in Manitoba and Saskatchewan where rates for the northern region of these provinces were seven and six times higher respectively than for the southern regions. At a national level, the homicide rate was highest in the rural areas of the North (7.30 victims per 100,000 population). The lowest rate of homicide was found in rural areas of the South at 1.42 homicides per 100,000 population. These trends have been consistent since 2009, the earliest year for which data for these geographies are available.
Chart 2 start

Data table for Chart 2
| Province or territory | Northern regions | Southern regions |
|---|---|---|
| rate per 100,000 population | ||
| Newfoundland and Labrador | 3.61 | 0.20 |
| Prince Edward Island | Note ...: not applicable | 0.00 |
| Nova Scotia | Note ...: not applicable | 1.15 |
| New Brunswick | Note ...: not applicable | 1.69 |
| Quebec | 1.93 | 0.94 |
| Ontario | 4.19 | 1.72 |
| Manitoba | 19.62 | 2.80 |
| Saskatchewan | 15.36 | 2.52 |
| Alberta | 3.18 | 1.74 |
| British Columbia | 3.53 | 1.66 |
| Yukon | 7.41 | Note ...: not applicable |
| Northwest Territories | 13.47 | Note ...: not applicable |
| Nunavut | 20.84 | Note ...: not applicable |
| Canada | 4.90 | 1.55 |
|
... not applicable Note: Populations are based upon July 1st, 2018 estimates from Statistics Canada, Demography Division. Source: Statistics Canada, Canadian Centre for Justice and Community Safety Statistics, Homicide Survey. |
||
Chart 2 end
Homicides in the North more likely to occur among persons known to each other and in a residence compared to homicides in the South
Although the top 3 motives for homicide over the last 10 years (2009 to 2018) have been “argument or quarrel”, “frustration, anger or despair” and “settling of accounts” for both the northern and southern regions of the country, the distribution of these motives differ between regions. In the North, “argument or quarrel” was provided as the motive for 46% of the homicides, followed by “frustration, anger or despair” at 19% and settling of accounts at 7%.Note Comparatively, in the South, “argument or quarrel” was reported as the motive for 32% of homicides, whereas “frustration, anger or despair” and “settling of accounts” each accounted for 17%.Note
There were also differences in the relationship between the closest accusedNote and the victim. The most significant being that victims in the North were less likely to be killed by a stranger (7%) than in the South (19%).Note
Along with differences in the relationships between the closest accused and the victim, the location type in which the homicide occurred differs when comparing homicides in the North and South of Canada. On average over the last 10 years, 75%Note of the homicides in the North occurred in a residential location whereas this was the case for 60%Note of the homicides that occurred in the South.
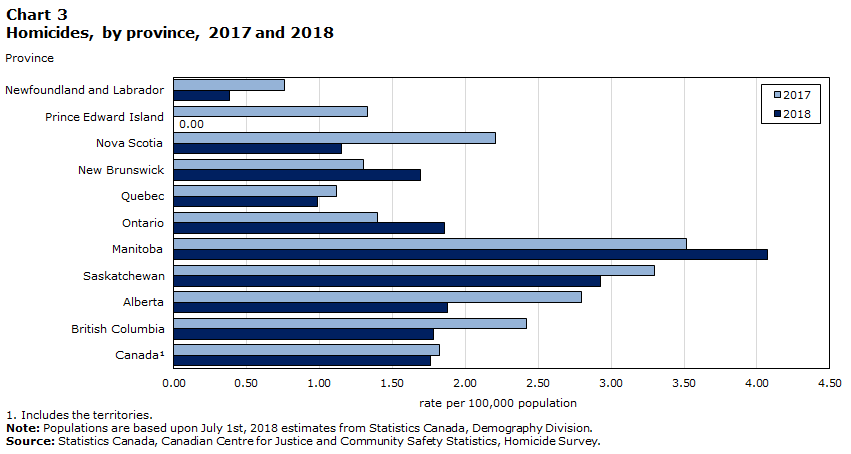
Provincial homicide rates continue to be highest in Manitoba and Saskatchewan
Like overall crime rates, homicide rates have historically been higher in the western provinces. For the second consecutive year, Manitoba reported the highest provincial homicide rate with 4.07 homicides per 100,000 population, up from 3.52 in 2017 (Chart 3).
Chart 3 start
Data table for Chart 3
| Province | 2017 | 2018 |
|---|---|---|
| rate per 100,000 population | ||
| Newfoundland and Labrador | 0.76 | 0.38 |
| Prince Edward Island | 1.33 | 0.00 |
| Nova Scotia | 2.21 | 1.15 |
| New Brunswick | 1.30 | 1.69 |
| Quebec | 1.12 | 0.99 |
| Ontario | 1.40 | 1.86 |
| Manitoba | 3.52 | 4.07 |
| Saskatchewan | 3.30 | 2.93 |
| Alberta | 2.80 | 1.88 |
| British Columbia | 2.42 | 1.78 |
| CanadaData table Note 1 | 1.82 | 1.76 |
Source: Statistics Canada, Canadian Centre for Justice and Community Safety Statistics, Homicide Survey |
||
Chart 3 end
Despite a decrease in the homicide rate, Saskatchewan had the second highest provincial rate for the second consecutive year at 2.93 homicides per 100,000 population followed by Alberta with a rate 1.88. Although Alberta had the third highest homicide rate among the provinces, this is their lowest reported rate since 1996.
Prince Edward Island reported no homicides in 2018. Newfoundland and Labrador had the lowest rate of the provinces where at least one homicide occurred with 0.38 homicide per 100,000 population.
Although Yukon, the Northwest Territories and Nunavut normally have lower numbers of homicide than the provinces, the relatively low population count translates to higher and unstable rates, making it difficult to compare the data (Table 1b). With 8 homicides in 2018, Nunavut recorded its highest number of homicides since it became a territory in 1999.
Most homicides ever reported and highest homicide rate since 1991 for Toronto census metropolitan area
With 142 victims in 2018, Toronto, Canada’s most populated census metropolitan area (CMA),Note had the most homicides of all CMAs as well as the most homicides ever reported in Toronto since collection of homicide data by CMA began in 1981. This is a 53% increase in the number of victims and a 50% increase in the rate of homicide from 2017 (1.51 victims per 100,000 population in 2017 compared to 2.26 victims per 100,000 population in 2018). Toronto surpassed the largest number of homicides ever recorded in a CMA. In comparison, the next highest number of homicides ever recorded by a CMA was in 1989 when the CMA of Montréal reported 123 homicides, a rate of 3.80 per 100,000 population.
The three high profile events in Toronto described earlier in this article represent 20 of the CMA's 142 homicides in 2018 and do not alone account for the notable increase that year. Excluding the victims from these three events, the Toronto CMA still would have had 29 more victims than in 2017, and would have reported a 29% increase.
Outside the three key events, what accounted for the rest of the increase in the Toronto CMA? The rest of the increase can be explained by more homicides by strangers, which accounted for 39%Note of the homicides outside the three events. In comparison, the previous 10-year average for stranger homicides in Toronto stands at 22%.Note In addition, the Toronto CMA recorded a relatively high number of solved homicides where the relationship was unknown—15 compared to 6 the previous year. This means the police solved the homicide, but were unable to confirm whether or not the victim knew the accused. Finally, the increase outside the three key events was largely-firearm related and occurring in non-residential areas. Still without consideration for the three major events, the year-over-year (2017 to 2018) increase would also decrease from 50% to 29%.
Number of homicides decreased or remained the same in just over half of census metropolitan areas
In 2018, the number of homicides decreased in 17 of Canada’s 35 census metropolitan areas (CMAs),Note increased in 14 and was unchanged for the remaining 5. The largest declines were reported in Edmonton, Calgary and Vancouver and the greatest increases occurred in Toronto and Windsor (Table 2).
Decreases in Edmonton in 2018 may be attributed to fewer homicides committed by strangers (-5), but it should be noted that the number of firearm and gang-related homicides in that CMA remained the same as in 2017. In Calgary, there were fewer firearm (-7) and gang-related homicides (-8), and less homicides involving victims where the relationship to the accused was criminal in nature (-9). In the CMA of Vancouver, there were 4 less homicides involving a firearm and 7 less involving a stranger. However, the number of gang-related homicides for the Vancouver CMA was unchanged from 2017.
Windsor reported 10 homicides in 2018, 7 more than 2017 and the highest number for that CMA in the last 25 years. There were 2 more gang-related homicides in 2018 than in 2017 and no change in the number of firearm-related homicides over this period. While all 3 homicides that occurred in 2017 were committed by an acquaintance, the increase in the CMA of Windsor in 2018 involved not only additional homicides by acquaintances, but also homicides by family members and strangers.
Thunder Bay, with 1 more homicide than 2017, had the highest rate of all homicides at 6.38 victims per 100,000 population. This is almost four times the national average and the average rate for all CMAs throughout the country. This marks the 3rd year in a row Thunder Bay reports the highest homicide rate. Although Thunder Bay has the 3rd smallest population of all CMAs, there were eight homicides reported in 2018 which is more victims in one year than three of the 11 CMAs with populations over 500,000. Only 1 of the homicides was reported as being firearm-related and 2 were gang-related. Of the solved homicides in 2018 (63% of all homicides that occurred in Thunder Bay), 60% of the victims were killed by an acquaintance and the remaining 40% by a family member. Sixty-three percent of victims were male and 75% were Indigenous.
About one in three homicides in Canada are firearm-related
Historically, either shooting or stabbing have been the most common method used to commit homicide in Canada. However, shooting has been the most common method used for the past three years, accounting for 37% to 41% of all homicides where the method used to commit the homicide was known (Chart 4). Throughout this period, stabbings have accounted for 29% to 31%. Homicides resulting from beatings have declined from 23%Note in 2015 to 19%Note in 2018.
Chart 4 start

Data table for Chart 4
| Year | Shooting | Stabbing | Beating |
|---|---|---|---|
| rate per 100,000 population | |||
| 1988 | 0.63 | 0.63 | 0.52 |
| 1989 | 0.79 | 0.62 | 0.47 |
| 1990 | 0.70 | 0.77 | 0.47 |
| 1991 | 0.97 | 0.80 | 0.51 |
| 1992 | 0.87 | 0.74 | 0.53 |
| 1993 | 0.68 | 0.67 | 0.40 |
| 1994 | 0.68 | 0.53 | 0.37 |
| 1995 | 0.59 | 0.62 | 0.41 |
| 1996 | 0.72 | 0.66 | 0.44 |
| 1997 | 0.65 | 0.56 | 0.38 |
| 1998 | 0.50 | 0.62 | 0.41 |
| 1999 | 0.55 | 0.47 | 0.41 |
| 2000 | 0.60 | 0.49 | 0.42 |
| 2001 | 0.55 | 0.55 | 0.39 |
| 2002 | 0.48 | 0.58 | 0.40 |
| 2003 | 0.52 | 0.45 | 0.39 |
| 2004 | 0.54 | 0.64 | 0.43 |
| 2005 | 0.69 | 0.61 | 0.44 |
| 2006 | 0.59 | 0.64 | 0.37 |
| 2007 | 0.57 | 0.57 | 0.36 |
| 2008 | 0.60 | 0.61 | 0.37 |
| 2009 | 0.54 | 0.62 | 0.35 |
| 2010 | 0.51 | 0.49 | 0.34 |
| 2011 | 0.46 | 0.61 | 0.38 |
| 2012 | 0.49 | 0.47 | 0.33 |
| 2013 | 0.38 | 0.56 | 0.29 |
| 2014 | 0.44 | 0.53 | 0.29 |
| 2015 | 0.50 | 0.60 | 0.38 |
| 2016 | 0.62 | 0.48 | 0.32 |
| 2017 | 0.73 | 0.56 | 0.30 |
| 2018 | 0.67 | 0.49 | 0.32 |
|
Note: Populations are based upon July 1st, 2018 estimates from Statistics Canada, Demography Division. Source: Statistics Canada, Canadian Centre for Justice and Community Safety Statistics, Homicide Survey |
|||
Chart 4 end
Firearm-related homicides down after four consecutive years of increases
Nationally, firearm-related homicides account for about one in five firearm-related fatalities. According to 2017 vital statistics (the latest year for which figures are available), there were a total of 769 deaths in Canada from firearm-related injuries compared to 723 in 2016. Among these, 75% were suicides, 23% were homicides and 2% were classified as accidental (Statistics Canada 2018).
In 2018, there were 249 homicides caused by a firearm (firearm-related), 18 fewer than in 2017 (Table 3a).Note The firearm-related homicide rate (0.67 per 100,000 population) decreased 8% from the previous year (0.73 per 100,000 population) (Chart 5). Prior to 2018, firearm-related homicide had been increasing since 2014, with gang-related violence being the primary driver. In 2018, 51% of firearm-related homicide were related to gang activity. Overall, in 2018, gang-related homicide committed with a firearm represented 20% of all homicides, compared to 22% the year before and 20% in 2016.
Chart 5 start

Data table for Chart 5
| Province | 2018 | 2017 |
|---|---|---|
| rate per 100,000 population | ||
| Newfoundland and Labrador | 0.19 | 0.00 |
| Prince Edward Island | 0.00 | 0.00 |
| Nova Scotia | 0.42 | 0.84 |
| New Brunswick | 0.65 | 0.65 |
| Quebec | 0.36 | 0.42 |
| Ontario | 0.84 | 0.60 |
| Manitoba | 0.44 | 0.97 |
| Saskatchewan | 1.03 | 0.87 |
| Alberta | 0.72 | 1.20 |
| British Columbia | 0.80 | 1.18 |
| CanadaData table Note 1 | 0.67 | 0.73 |
Source: Statistics Canada, Canadian Centre for Justice and Community Safety Statistics, Homicide Survey. |
||
Chart 5 end
The decrease in total firearm-related homicides in Canada is a result of the decreases in Alberta (-20), British Columbia (-18), Manitoba (-7), Quebec (-5), Nova Scotia (-4), Yukon (-2) and Nunavut (-1). Declines in areas outside of census metropolitan areas (CMAs) accounted for the decreases in Alberta and British Columbia.
In contrast, Ontario reported 36 more firearm-related homicides, with CMAs accounting for the majority of this increase. Toronto accounted for 14 of the additional 36 firearm-related homicides in the province, while other CMA’s accounted for 9 (Table 3b).
Prince Edward Island, Yukon, the Northwest Territories and Nunavut reported no firearm-related homicides in 2018.
The largest declines in firearm-related homicides among the CMAs occurred in Calgary (-7 victims) and Québec (-6 victims), while Vancouver and Winnipeg both recorded 4 fewer victims (Table 3b). Calgary’s decrease in firearm-related homicides, resulted in a decrease in the rate of 0.49 per 100,000 population (1.02 in 2017) and brought them below the 10-year average of 0.61.
Among the CMAs, the highest rate of firearm-related homicides in 2018 was in Abbotsford-Mission (2.55 per 100,000 population), followed by Regina (1.55 per 100,000 population).
Handguns remain the most widely used firearm in homicides
The type of firearm used to commit homicide in Canada has changed over the past 30 years. Prior to 1990s, rifles or shotguns were used far more frequently than handguns. However, a shift towards the use of handguns in homicides in Canada can be observed since the early 1990s (Table 4, Chart 6).
Chart 6 start

Data table for Chart 6
| Year | Sawed-off rifle/shotgun | Handgun | Rifle/shotgun |
|---|---|---|---|
| percent | |||
| 1980 | 2.1 | 32.0 | 61.3 |
| 1981 | 1.0 | 29.6 | 61.8 |
| 1982 | 3.6 | 35.7 | 58.6 |
| 1983 | 1.8 | 34.8 | 56.7 |
| 1984 | 0.9 | 29.3 | 62.0 |
| 1985 | 4.1 | 32.9 | 59.0 |
| 1986 | 0.6 | 21.7 | 65.1 |
| 1987 | 3.5 | 28.7 | 53.5 |
| 1988 | 4.1 | 27.8 | 55.6 |
| 1989 | 1.4 | 25.0 | 60.2 |
| 1990 | 0.5 | 34.9 | 50.8 |
| 1991 | 9.2 | 49.8 | 38.0 |
| 1992 | 6.1 | 52.2 | 36.8 |
| 1993 | 8.7 | 46.7 | 38.5 |
| 1994 | 13.3 | 45.9 | 33.7 |
| 1995 | 8.6 | 54.6 | 35.6 |
| 1996 | 7.5 | 50.5 | 38.3 |
| 1997 | 5.2 | 51.5 | 39.7 |
| 1998 | 9.2 | 46.7 | 33.6 |
| 1999 | 3.6 | 54.2 | 34.9 |
| 2000 | 5.5 | 59.0 | 31.1 |
| 2001 | 4.1 | 64.5 | 26.7 |
| 2002 | 3.9 | 64.5 | 26.3 |
| 2003 | 8.0 | 68.1 | 20.2 |
| 2004 | 8.7 | 64.7 | 21.4 |
| 2005 | 4.9 | 58.5 | 26.3 |
| 2006 | 13.5 | 58.3 | 19.8 |
| 2007 | 9.6 | 66.5 | 17.0 |
| 2008 | 8.5 | 63.2 | 17.4 |
| 2009 | 8.2 | 61.5 | 17.6 |
| 2010 | 8.0 | 59.4 | 21.1 |
| 2011 | 10.1 | 59.7 | 18.9 |
| 2012 | 5.3 | 62.0 | 22.8 |
| 2013 | 6.0 | 67.2 | 22.4 |
| 2014 | 3.9 | 66.5 | 21.9 |
| 2015 | 12.8 | 57.0 | 20.7 |
| 2016 | 5.8 | 58.3 | 22.4 |
| 2017 | 8.2 | 54.3 | 24.3 |
| 2018 | 7.2 | 57.4 | 22.5 |
| Source: Statistics Canada, Canadian Centre for Justice and Community Safety Statistics, Homicide Survey. | |||
Chart 6 end
Handguns continued to be the most used firearm in homicides in 2018 with 57% of all firearm-related homicides being committed with a handgun. The proportion of handguns used in firearm-related homicides was higher than other types of firearms in all regions of the country except the Atlantic provinces where a rifle or shotgun was used in 70% of firearm-related homicides. There were no firearm-related homicides in the Territories.
After increasing three years in a row, the rate of gang-related homicides declined in 2018
There were 157 gang-related homicides in 2018, 6 fewer than in 2017.Note Gang-related homicides continued to account for about one-quarter (24%) of all homicides in 2018 and the rate (0.42 per 100,000 population) decreased 5% from the previous year. This marked the first decrease after three consecutive years of increases; however, it was still the second highest rateNote recorded in Canada since comparable data was first collected in 2005 (Chart 7).
Chart 7 start

Data table for Chart 7
| Year | Gang-related homicides |
|---|---|
| rate per 100,000 population | |
| 2005 | 0.33 |
| 2006 | 0.32 |
| 2007 | 0.36 |
| 2008 | 0.42 |
| 2009 | 0.37 |
| 2010 | 0.28 |
| 2011 | 0.28 |
| 2012 | 0.27 |
| 2013 | 0.24 |
| 2014 | 0.23 |
| 2015 | 0.27 |
| 2016 | 0.39 |
| 2017 | 0.45 |
| 2018 | 0.42 |
|
Note: These data became available beginning in 1991. A homicide is classified as gang-related when police confirm or suspect that the accused person and/or the victim involved in the homicide was either a member, or a prospective member, of an organized crime group or street gang or was somehow associated with an organized crime group or street gang, and the homicide was carried out as a result of this association. Prior to 2005, police were asked if the homicide was "gang-related". Beginning in 2005, the question was amended to give police the option of specifying whether the homicide was: (a) confirmed as gang related or (b) suspected as being gang-related. As such, figures may be underestimated prior to 2005 due to suspected gang-related incidents that were excluded from the figures. Populations are based upon July 1st, 2018 estimates from Statistics Canada, Demography Division. Source: Statistics Canada, Canadian Centre for Justice and Community Safety Statistics, Homicide Survey. |
|
Chart 7 end
While gang-related homicides declined in 5 provinces, the largest decreases in gang-related homicide were reported in British Columbia (-12 homicides) and Alberta (-9) (Table 5a). In British Columbia, some of the decrease was attributable to fewer gang-related homicides in Kelowna and Abbotsford-Mission (Table 5b). The decline in Alberta (-9) was predominantly in Calgary (-8).
The number of gang-related homicides more than doubled in the province of Quebec from 15 victims in 2017 to 32 in 2018. The increase in Quebec was driven by an additional 9 homicides in Montréal and 4 in rural areas and small towns.
In 2018, Ontario reported 3 more gang-related homicides over 2017. Following two years of increases, the number of gang-related homicides in the census metropolitan area of Toronto remained unchanged in 2018 from the previous year at 36 victims. In Toronto, the proportion of gang-related homicides committed with a firearm remained relatively unchanged at 94% (compared with 92% in 2017).
In 2018, 91% of the gang-related homicides occurred in an urban area while 9% occurred in a rural area, a finding which has remained fairly consistent since 2013. In comparison, 74% of non-gang related homicides happened in an urban area and 26% in a rural area. In provinces where there were at least one gang-related homicide in 2018, all of them occurred in an urban area in Ontario, Nova Scotia and New Brunswick. At 1 gang-related homicide, Newfoundland and Labrador had the highest percentage of gang-related homicides in a rural area (100%), Manitoba, with 3 gang-related homicides, was second with 43%.
Nationally, approximately 8 out of every 10 (83%) gang-related homicides were committed with a firearmNote and, of these, 85%Note were committed with a handgun.
Homicides involving multiple victims are relatively rare
Over the last 10 years, there have been 262 incidents involving more than one victim of homicide. In all, these multiple-victim incidents resulted in 593 victims. Multiple-victim incidents account for 5% of all homicide incidents and represent 10% of all victims over that period.
Fifty-three percentNote of all multiple victim homicides were committed with a firearm compared to 31%Note for single victim homicides.
For both multiple and single-victim homicides, the relationship of the accused to the victim is similar, with about one-third being killed by a family member, another third by an acquaintance, one fifth by a stranger and the remainder by someone with whom they had a criminal relationship.
Start of text box 1
Text box 1
A look at solve rates from the Homicide Survey
Homicides may be solved months or years after they occur. The Homicide Survey collects updates for previously reported homicides to revise the solved status and to allow for the collection of additional details gathered throughout homicide investigations, if applicable. In all cases, the number of solved homicides are always reported according to the year in which they were reported by the police to the Homicide Survey (which also corresponds to the year in which the incident was deemed a homicide by the police and began being investigated as such). For instance, as of December 31, 2018, 435 of the 651 homicides that occurred in 2018 had been solved, resulting in a solve rate of 67% which is the same as the rate at the end of 2016 and 2017 but lower than the average over the previous 10 years—2008 to 2017 (79%). During the 2019 data collection cycle, some of the outstanding unsolved homicides may become solved, which would then increase the solve rate for homicides reported in 2018 or any other year prior.
- Note 1
-
The terms ‘solved’ and ‘cleared’ are used synonymously in this article to describe homicide incidents where police investigation has led to the identification of an accused person (charged/suspect-chargeable) and whether a charge has been laid or recommended, or cleared by other means. The term ‘cleared’ is widely recognized by North American and international law enforcement agencies. For further information regarding police-reported clearance rates refer to the Juristat article, “Police-reported clearance rates in Canada, 2010” (Hotton Mahony and Turner 2012).
- Note 2
-
The Homicide Survey is a police-reported source of data, therefore it does not track court-related outcomes for homicide incidents such as decisions put forth by Crown attorneys, convictions, or sentencing-related information. For further information related to court decisions for homicide charges brought before the adult criminal court system in Canada, refer to the Juristat article, “Adult criminal court statistics in Canada, 2015/2016” (Maxwell 2017) or Table 35-10-0027-01.
End of text box 1
Rate of homicide for Indigenous peoples five times higher than for non-Indigenous people
Indigenous peoples, including those police identify through investigation as First Nations, Métis and Inuit, accounted for 5% of Canada's population in 2018, but 22% of all homicide victims. Of the 140 Indigenous victims of homicide reported by police in 2018, 96 were male (69%) and 44 were female (31%) (Table 6). The number of male victims decreased for the first time since 2014 when complete data on Indigenous identity first became available. In 2018, there were 6 more Indigenous female victims of homicide than in 2017, marking a second consecutive annual increase.Note
Comparable to past years, the rate of homicide for Indigenous peoples in 2018 was five times higher than the rate for non-Indigenous people (7.31 per 100,000 population for Indigenous peoples, compared with 1.44 for non-Indigenous people)Note (Chart 8, Table 6). The highest rates were among Indigenous males, followed by Indigenous females, non-Indigenous males and the lowest homicide rates were among non-Indigenous females (Chart 8).
Chart 8 start

Data table for Chart 8
| Sex | Indigenous identity | Year | Rate per 100,000 population |
Number of victims |
|---|---|---|---|---|
| Female | IndigenousData table Note 1 | 2014 | 3.63 | 31 |
| 2015 | 4.87 | 43 | ||
| 2016 | 3.18 | 29 | ||
| 2017 | 4.04 | 38 | ||
| 2018 | 4.54 | 44 | ||
| Non-IndigenousData table Note 2 | 2014 | 0.71 | 120 | |
| 2015 | 0.78 | 133 | ||
| 2016 | 0.71 | 122 | ||
| 2017 | 0.76 | 132 | ||
| 2018 | 0.67 | 119 | ||
| Male | IndigenousData table Note 1 | 2014 | 10.87 | 90 |
| 2015 | 12.49 | 107 | ||
| 2016 | 12.74 | 113 | ||
| 2017 | 12.98 | 119 | ||
| 2018 | 10.14 | 96 | ||
| Non-IndigenousData table Note 2 | 2014 | 1.65 | 276 | |
| 2015 | 1.90 | 321 | ||
| 2016 | 2.01 | 343 | ||
| 2017 | 2.12 | 365 | ||
| 2018 | 2.23 | 388 | ||
Source: Statistics Canada, Canadian Centre for Justice and Community Safety Statistics, Homicide Survey. |
||||
Chart 8 end
The rate of homicide for Indigenous people in 2018 (7.31 per 100,000 Indigenous people) was lower than the rate in 2017 (8.45) as well as the average rate for the previous 4 years—2014 to 2017 (8.05). This was also the case for Indigenous male victims (10.14 per 100,000 Indigenous males in 2018; 12.98 in 2017; and 12.30 for the average between 2014 and 2017). However, the rate for Indigenous females in 2018 (4.54 per 100,000 Indigenous females) was higher than 2017 (4.04) as well as the previous 4-year average (3.93).
Among the provinces, the rate of Indigenous homicide victims was highest in Manitoba in 2018 (16.02 per 100,000 Indigenous population), followed by Saskatchewan (11.2) and Alberta (10.3) (Table 6). Overall, 65% of homicides of Indigenous victims (91 victims) occurred in rural areas and small towns, and 35% occurred in a census metropolitan area (CMA) (49 victims).
The proportion of Indigenous victims was greatest among the CMAs of Thunder Bay (75%), Regina (63%), Brantford (60%), Winnipeg (59%) and Saskatoon (50%).
Indigenous victims younger than non-Indigenous victims
Indigenous victims were generally younger than non-Indigenous victims in 2018. While the average age for Indigenous victims was 32 years, non-Indigenous victims were, on average, 39 years of age. Even greater age differences are seen across genders. The average age for Indigenous female victims was 30 compared to 43 for non-Indigenous females. Among males, the average age for Indigenous male victims was 33 years and 37 years for non-Indigenous male victims.
Solve rates higher for homicides involving Indigenous victims
By the end of 2018, police services had solved 79% of the 2017 homicides involving an Indigenous victim compared to 63% for non-Indigenous victims. Differences emerged, however, depending on the sex of the victim. The solved rate for Indigenous and non-Indigenous females was almost the same (86% and 88% respectively). However, for male victims, 76% of homicides involving Indigenous male victims were solved compared to 56% of homicides involving non-Indigenous male victims. The relatively low solve rate for non-Indigenous male victims may be related to the fact that 60% of these unsolved homicides were gang-related, a type of homicide that tends to be more difficult to solve (Cotter 2014; Trussler 2010). In contrast, 30% of the unsolved homicides involving Indigenous male victims were gang-related.
Victims reported as missing prior to the incident being identified as a homicide
In 2018, 54 victims of homicide were identified as missing at the time the homicide became known to police. Of these, 26% (14 victims) were Indigenous. The proportion of victims reported as missing prior to the incident being identified as a homicide was slightly higher for Indigenous victims (10%) than non-Indigenous victims (8%). This was also true for both male and female victims. Eight percent of Indigenous male victims were reported as missing before being identified as homicide victims as was the case for 6% of non-Indigenous male victims. For females, 14% of Indigenous victims were initially reported as missing compared to 12% of non-Indigenous victims.
Rate of Indigenous peoples accused of homicide nearly eight times higher than non-Indigenous accused persons
In 2018, 30% of persons accused of homicide were reported by police as Indigenous, a proportion which had been increasing, but has returned comparable to 2014 when it was 31%. The rate of Indigenous persons accused of homicide in 2018 was nearly 8 times higher compared to non-Indigenous accused persons, a difference that has been similar in previous years (Table 6).
In 2018, the rate of Indigenous males accused of homicide (12.47 per 100,000 Indigenous male population) was 7 times higher than that of non-Indigenous males (1.87 per 100,000 non-Indigenous male population) and four times higher than the rate of Indigenous female accused (3.30 per 100,000 Indigenous female population).
Indigenous accused peoples were younger than non-Indigenous accused in 2018. The average age for Indigenous accused persons was 28 years old compared to 34 years old for non-Indigenous persons. Statistics Canada began collecting complete data for Indigenous and non-Indigenous accused in 2014. Since 2014, the 4-year average for the age of accused persons, both Indigenous and non-Indigenous has remained the same, 28 for Indigenous accused and 34 for non-Indigenous.
In 2018, Indigenous accused were slightly less likely than non-Indigenous accused to be involved in a gang-related incident (11% of Indigenous accused compared to 14% of non-Indigenous accused). This differed from 2017 when Indigenous accused were more likely than non-Indigenous accused to be involved in a gang-related incident (21% and 14% of accused respectively). The 2018 data also differs from the previous four-year average where 15% of Indigenous accused were involved in a gang-related incident compared to 13% of non-Indigenous accused.
Most victims knew their killer
Consistent with previous years, approximately 4 out of 5 victims of solved homicides in 2018 knew their killer. Just about one-third (34%) of all homicide victims were killed by an acquaintance (i.e., non-family), and another third (33%) were killed by a family member, while 19% were killed by a stranger, 8% were killed by someone with whom they had a criminal relationship (e.g., drug dealers and their clients), and 6% were killed by someone with whom they had a current or former intimate relationship (Table 7).
In 2018, the proportion of Indigenous victims killed by someone they knew (96%) was higher than non-Indigenous victims (75%) (Table 8).
With the exception of spousal homicides, the number of homicides for other principal types of relationships all decreased. While the number of spousal homicides increased by 9—6 male victims and 3 female victims—in 2018, Canada saw fewer homicides committed by other family members (-16), intimate partners (-3), acquaintances (-15), criminal relationship (-31) and strangers (-7) (Table 7).
According to police reported crime statistics, women account for about 8 in 10 victims of intimate partner violence. The same is true with respect to homicide. In 2018, 77% of homicide victims killed by a current or previous spouse or an intimate partner were female (Table 9).
A criminal history is common for both persons accused of homicide and victims
In 1997, the Homicide Survey began collecting information on the criminal history of victims and accused persons. While it is possible for a person to have more than one prior conviction, police are asked only to indicate the most serious.
In 2018, just under two-thirds (63%) of adults 18 years and older accused of homicide had a criminal record in Canada, whereas just over one-third (35%) of accused persons 12 to 17 years old had a youth record. Having a criminal record was more common among males—both adults and youth—than females (65% of adult males compared to 46% of adult females, and 41% of male youths compared to no female youths).Note
Just over half (51%) of adult homicide victims had a Canadian criminal record. Of the 27 youth victims aged 12 to 17 years, 11% had a youth record.Note
Youth account for less than one in every ten persons accused of homicide
In 2018, 37 youth aged 12 to 17 years were accused of homicide, accounting for 7% of all accused. This proportion is slightly lower than the previous year’s (9%) as well as the previous 10-year average (8%).Note
Youth accused of homicide in 2018 were as likely as adults to be involved in a gang-related incident (14% of youth and 13% of adult accused). These proportions were lower than the 10-year average for both youth and adults accused (24% and 15% respectively). The fact that both youth and adults were almost as likely to be involved in gang-related incidents differs from the previous 10-year average where youths accused of homicide were approximately 1.5 times more likely than an adult to be involved in a gang-related incident.
Almost one in five accused persons suspected of having a mental or developmental disorder
Police suspected the presence of a mental or developmental disorderNote in 19%Note of persons accused of homicide in 2018. This proportion is slightly higher than the previous 10-year average (16%).Note Police suspected the presence of a mental disorder in female accused more frequently (23% of female accused)Note than when the accused was a male (19% of male accused).Note Half (51%) of the solved homicides committed by someone with suspected mental or developmental disorder were committed against family members. Moreover, homicides by someone with a suspected disorder were committed by persons aged 18 to 29 years (38%), followed by 30 to 39 years (26%). Accused persons suspected to have a mental or developmental disorder most often used a knife or other piercing or cutting instrument (42%) followed by a firearm (27%).Note
Summary
Following 2017, a year where homicide in Canada marked its highest rate in almost a decade, 2018 saw a 4% decrease in homicides. The decrease in the national number of homicides was a result of notably fewer homicides in Alberta (-38 homicides), British Columbia (-30), Quebec (-10) and Nova Scotia (-10). The decline gained at the national level by these provinces was offset by 69 more homicides in Ontario. Most notably, the majority of Ontario’s increase were due to 49 more homicides in the census metropolitan area of Toronto.
After recent years of steady growth, the rate of both gang-related and firearm-related homicides dipped in 2018. The province of Quebec, however, saw more than twice as many gang-related homicides in 2018.
As in previous years, Indigenous peoples were over-represented as both victims and persons accused of homicide. While the number of male Indigenous victims declined in 2018, there was an increase in the number of female Indigenous victims.
Also consistent with previous years, the majority of victims of solved homicides knew their killer. Homicides by spousal partners was the only type of homicide to increase in number of victims in 2018. Notable decreases were seen for homicides where the victim and the accused had a criminal relationship.
Detailed data tables
Table 1a Number of homicides, by province and territory, 1988 to 2018
Table 1b Rate of homicides, by province and territory, 1988 to 2018
Table 2 Homicides, by census metropolitan area, 2017 and 2018
Table 3a Homicides, by firearm-related status and province and territory, 2017 and 2018
Table 3b Firearm-related homicides, by census metropolitan area, 2017 and 2018
Table 4 Firearm-related homicides, by type of firearm, Canada, 1998 to 2018
Table 5a Homicides, by gang-related status and province and territory, 2017 and 2018
Table 5b Gang-related homicides, by census metropolitan area, 2017 and 2018
Table 7 Homicides by closest accused to victim relationship, Canada, 2017 and 2018
Table 9 Homicides by closest accused to victim relationship and sex, Canada, 2018
Survey description
The Homicide Survey collects police-reported data on the characteristics of all homicide incidents, victims and accused persons in Canada. The Homicide Survey began collecting information on all murders in 1961 and was expanded in 1974 to include all incidents of manslaughter and infanticide. Although details on these incidents are not available prior to 1974, counts are available from the Uniform Crime Reporting Survey (UCR) and are included in the historical aggregate totals.
Whenever a homicide becomes known to police, the investigating police service completes the survey questionnaires, which are then sent to Statistics Canada. There are cases where homicides become known to police months or years after they occurred. These incidents are counted in the year in which they become known to police (based on the report date). Information on persons accused of homicide are only available for solved incidents (i.e., where at least one accused has been identified). Accused characteristics are updated as homicide cases are solved and new information is submitted to the Homicide Survey. Information collected through the victim and incident questionnaires is also accordingly updated as a result of a case being solved. For incidents involving more than one accused, only the relationship between the victim and the closest accused is recorded.
Due to revisions to the Homicide Survey database, annual data reported by the Homicide Survey prior to 2016 may not match the annual homicide counts reported by the UCR. Data from the Homicide Survey are appended to the UCR database each year for the reporting of annual police reported crime statistics. Each reporting year, the UCR includes revised data reported by police for the previous survey year. In 2015, a review of data quality was undertaken for the Homicide Survey for all survey years from 1961 to 2014. The review included the collection of incident, victim and charged/suspect-chargeable records that were previously unreported to the Homicide Survey. In addition, the database excludes deaths, and associated accused records, which are not deemed as homicides by police any longer (i.e., occurrences of self-defence, suicide, criminal negligence causing death that had originally been deemed, but no longer considered homicides, by police). For operational reasons, these revisions were not applied to the UCR.
Defining Indigenous identity for the Homicide Survey
Aboriginal identity is reported by police to the Homicide Survey and is determined through information found with the victim or accused person, such as status cards, or through information supplied by victims' or accused persons' families, the accused persons themselves, community members, or other sources (i.e., such as band records). Forensic evidence such as genetic testing results may also be an acceptable means of determining the Aboriginal identity of victims.
For the purposes of the Homicide Survey, Aboriginal identity includes those identified as First Nations persons (either status or non-status), Métis, Inuit, or an Aboriginal identity where the Aboriginal group is not known to police. Non-Aboriginal identity refers to instances where the police have confirmed that a victim or accused person is not identified as an Aboriginal person. Aboriginal identity reported as 'unknown' by police includes instances where police are unable to determine the Aboriginal identity of the victim or accused person, where Aboriginal identity is not collected by the police service, or where the accused person has refused to disclose their Aboriginal identity to police. The term Indigenous will be used in place of Aboriginal throughout this report.
References
CBC News. 2018. “Woman and girl dead, 13 other people injured in Danforth shooting in Toronto.” CBC News. (accessed May 2, 2019).
Cotter, A. 2014. “Homicide in Canada, 2013.” Juristat. Statistics Canada Catalogue no. 85-002-X.
Globe and Mail, The. 2018. “Humboldt Broncos bus crash: What we know so far.” The Globe and Mail. Last updated April 19, 2018. (accessed May 2, 2019).
Hotton Mahony, T. and J. Turner. 2012. “Police-reported clearance rates in Canada, 2010.” Juristat. Statistics Canada Catalogue no. 85-002-X.
Maxwell, A. 2017. “Adult criminal court statistics in Canada, 2014/2015.” Juristat. Statistics Canada Catalogue no. 85-002-X.
Moreau, G. 2019. “Police-reported crime statistics in Canada, 2018.” Juristat. Statistics Canada Catalogue no. 85-002-X.
Morency, J-D., É. Caron-Malenfant, S. Coulombe and S. Langlois. 2015. Projections of the Aboriginal Population and Households in Canada, 2011 to 2036. Statistics Catalogue no. 91-552-X.
Ouimet, M. and C. Montmagny-Grenier. 2014. “Homicide and violence—International and cross-national research: The construct validity of the results generated by the World Homicide Survey.” International Criminal Justice Review. Vol. 24, no. 3. p. 222-234.
Perreault, S. 2019. “Police-reported crime in rural and urban areas in the Canadian provinces, 2017.” Juristat. Statistics Canada Catalogue no. 85-002-X.
Powers, L. 2019. “Serial killer Bruce McArthur will have a chance of parole in 25 years, when he's 91, judge rules.” CBC News. (accessed May 2, 2019).
Romer, D., K. Hall Jamieson and S. Aday. 2003. “Television, news and the cultivation of fear of crime.” Journal of Communication. Vol. 53, no. 1. p. 88-104.
Statistics Canada. 2018. Leading Causes of Death, Total Population, by Age Group [13-10-0394-01]. (accessed November, 2018; May, 2019).
Trussler, T. 2010. “Explaining the changing nature of homicide clearance in Canada.” International Criminal Justice Review. Vol. 20, no. 1. p. 366-383.
United Nations Office on Drugs and Crime. 2019. “Map of homicide in countries worldwide.” Global Study on Homicide (accessed August, 2019).
- Date modified: