
Police-reported violent crimes against young women and girls in Canada’s Provincial North and Territories, 2017

Archived Content
Information identified as archived is provided for reference, research or recordkeeping purposes. It is not subject to the Government of Canada Web Standards and has not been altered or updated since it was archived. Please "contact us" to request a format other than those available.
by Cristine Rotenberg, Canadian Centre for Justice Statistics
Highlights
- Young women and girls in northern Canada–comprising the territories and the northern parts of most provinces–were disproportionately victims of violent crimes in 2017.
- Although young women and girls aged 24 and younger in the North accounted for less than 7% of the total young Canadian female population under 25, they represented 17% of all young female victims of violent crimes across Canada.
- The violent crime rate was nearly three times higher for young women and girls aged 24 and younger in the North than for young women and girls in the South (3,643 versus 1,235 victims per 100,000 population), and nearly four times higher than for Canadians overall (968).
- Young women and girls in the North were victims of violent crime at a rate nearly twice that of young men and boys aged 24 and younger in the North (3,643 versus 2,090). This difference was larger than the gap observed between young females and males in the South (1,235 versus 954).
- Violent victimization of young women and girls in the North first peaked around age 15 and continued at consistently high rates until declining after age 30. This age victimization profile was unlike that for females in the South, whose rates peaked at age 15 but declined well before entering adulthood.
- Violent crime rates against young women and girls were highest in northern Saskatchewan (13,886 victims per 100,000 population) and northern Manitoba (9,025). Rates in these regions were between five to six times higher than their respective provincial southern areas, and both higher than each of the three territories.
- Rural areas in northern Canada had considerably higher rates of violent crime against young women and girls, at about twice the rate of urban areas in the North (5,023 versus 2,354 victims per 100,000 population).
- Violent crimes against young women and girls in the North were both more prevalent and more severe in nature than in the South: a greater proportion of young women and girls in the North had suffered a physical injury as a result of the violent crime committed against them (45% versus 32%), and they were victims of the more serious violent crimes–including homicide and level 3 physical assaults–at far greater rates.
- Young female victims in the North were most commonly victimized by a male (77%), close to half (44%) of whom were more than five years older than the young woman or girl they victimized.
- Violence against young women and girls in the North was most commonly perpetrated by an intimate partner or spouse (44%), a casual acquaintance (22%), or a family member (20%). Compared with the South, a slightly larger proportion of young female victims in the North knew their assailant (95% versus 92%), more often as someone they were dating at the time of the crime (27% versus 20%), or as an extended family member (9% versus 4%).
- Overall, four-in-five (80%) violent crimes against young women and girls in the North were reported to police on the same day the crime took place, compared with just over two-thirds (71%) in the South. Delay in reporting varied depending on the nature of the crime, with sexual assaults taking longer to come to the attention of police in both the North and the South.
Violence against young women and girls has long been established as an ongoing human rights issue and barrier to gender equality (United Nations 1993; World Health Organization 2013). Emotional trauma suffered by victims of violence can negatively impact their daily lives and their long-term mental and physical health, relationships, and overall well-being. This is especially the case if the violence occurred at a young age (Arnow 2004; Bosick et al. 2012; Springer et al. 2007; UNICEF 2014). Further, intersecting social inequalities can disproportionately negatively impact marginalized groups such as young IndigenousNote women (Dawson et al. 2018) and place them at increased risk for violent victimization (Boyce 2016; Hotton Mahony et al. 2017; Miladinovic and Mulligan 2015; Perreault 2015; Perreault and Simpson 2016; Statistics Canada 2013a; Statistics Canada 2018).
Higher rates of violent victimization are also seen among Canadians living in rural areas (Allen 2018) and crime is consistently more prevalent and more severe in the three territories than in the southern provinces (Allen and Perreault 2015; Boyce et al. 2014; Charron et al. 2010; Perreault and Hotton Mahony 2012). Living in a rural or remote area may also prevent a victim of abuse from leaving a violent relationship, which enables ongoing violence as well as potentially dissuading victims from reporting the violence to police, particularly when the assailant was a family member or an intimate partner (Edwards 2014; House of Commons Canada 2019). Research has found that, compared with the provinces, a higher proportion of victims in the territories did not report the crime to police because they perceived the incident as a private or personal matter that was handled informally (Perreault 2015; Perreault and Simpson 2016). The use of victim services, such as shelters, crisis centres, or support programs, is also much lower in the North (Perreault 2015; Perreault and Simpson 2016), in part due to the limited availability of such services in remote areas.
The current report builds on recent studies that have explored police-reported crimes in Canada’s Provincial North and territories (Allen and Perreault 2015), violent crimes against young women and girls (Conroy 2018), urban and rural crime (Perreault 2019), and crimes in Indigenous communities (Allen, forthcoming). Given that previous research produced by Statistics Canada provided a comprehensive analysis of the gender disparity for young victims of violent crime in Canada (Conroy 2018), the current report will focus mainly on the disparity between young female victims of violent crimes in the North and those living in the South. Some gender comparisons are provided throughout for additional context.
In this study, ‘young women and girls’ refer to females aged 24 and younger. The ‘North’ represents the three territories as well as most of the remote regions in the northern areas of the Canadian provinces, which are generally more similar to the territories in terms of geographic remoteness, economic, and social characteristics. Instead of solely comparing the three territories to the provinces,Note this North/South breakdown allows for increased analytical detail in pinpointing where young women and girls are most at-risk of violence. These regional comparisons are made with consideration to the compounding socioeconomic impacts of geographic remoteness and Canada’s sociopolitical history of colonization, including residential schools and the forced relocation of Indigenous peoplesNote (Text box 1).
This Juristat article was produced by the Canadian Centre for Justice Statistics at Statistics Canada with the funding support of the Department for Women and Gender Equality (formerly Status of Women Canada).
Delineating northern and southern Canada
Figure 1 below shows the line which delineates the North from the South for the purposes of this study.

Text description for Figure 1
The title of the map is "Delineating northern and southern Canada"
The North encompasses the Territories as well as the northern regions of Newfoundland and Labrador, Quebec, Ontario, Manitoba, Saskatchewan, Alberta, and British Columbia. The South refers to the southern regions of these provinces and includes Prince Edward Island, Nova Scotia and New Brunswick. The red line indicates the boundary between the North and the South within the provinces.
The boundaries between the provinces and the territories are indicated with white lines. The locations and names of the capitals in each province and territory are included in the map.
Geographically, the majority (85%) of Canada’s landmass is considered the North (Conference Board of Canada 2011). Yet, given its remoteness and harsher climate and living conditions, the North has proportionally far fewer residents. In 2017, about 6% of the Canadian population resided in the Provincial North, and less than 1% lived in the territories.Note It is important to consider how the vast remoteness of the North is distinctly different from the South, and how such varying demographic landscapes contribute to populations with different social characteristics (see Text box 1).
Start of text box 1
Text box 1
Characteristics of the North
Northern Canada is home to many Indigenous people and communities. According to the 2016 Census, the largest proportion of Indigenous people lived in the territories: nearly 9 in 10 (86%) residents in Nunavut identified as Indigenous (nearly all specifically as Inuit), as did half the residents (51%) in the Northwest Territories and just under one-in-four (23%) in the Yukon (Statistics Canada 2017a). Among the provinces, Manitoba and Saskatchewan had the largest proportion of Indigenous residents (18% and 16%, respectively). In the North, just under half (48%) of the young population aged 24 and younger was female, similar to in the South (49%).Note
Overall, in 2016, Indigenous people accounted for about 5% of the total Canada population. Over half (58%) identified as First Nations, just over one-third (35%) as Métis, and 4% as Inuit (Statistics Canada 2018). The First Nations population and the Métis population were both most concentrated in Ontario as well as in the western provinces, with around four-fifths of each population living in Ontario, British Columbia, Alberta, Manitoba, or Saskatchewan. Nearly three-quarters of the Inuit population lived in Inuit Nunangat, which includes Nunavut as well as some of the northernmost areas of Quebec, Newfoundland and Labrador, the Northwest Territories and the Yukon (see Statistics Canada 2017b).
The higher rates of violent victimization in the North presented in this paper (as well as non-violent crimes) are driven by a combination of several demographic, social, and economic factors that make the living conditions of the North unique from southern Canada.
A history of colonization, including residential schools (the last of which closed in Saskatchewan in 1996), work camps and forced relocation in the North is recognized for having profoundly impacted Indigenous communities and families for their role in intergenerational violence (Bombay et al. 2009; Holmes and Hunt 2017; Klingspohn 2018; The Truth and Reconciliation Commission of Canada 2015). In part due to its remote geography, the northern regions of Canada generally have limited or less access to: education programs, professional or high-income employment opportunities, technological services such as mobile phone networks or the Internet, and healthcare facilities and professionals (Auditor General of Canada 2011a; Auditor General of Canada 2011b). Access to justice and victim services can also present a challenge in the North (Perreault and Simpson 2016). Research on Indigenous or northern populations–with the latter largely focusing on Canada’s three territories–has found that these populations are also more likely to consist of lone-parent families, children in foster care, people with poorer mental health outcomes, substance abuse disorders or suicidal thoughts, and a younger population overall (Allen and Superle 2016; Arriagada 2016; Boyce et al. 2015; Kelly-Scott and Smith 2015; Kumar 2016; Perreault and Simpson 2016; Statistics Canada 2013a; Turner 2016). These can all serve as compounding risk factors that collectively foster a population that is more vulnerable to criminal victimization and offending behaviours.
For more information about the characteristics of Indigenous people in Canada, including further breakdowns for the First Nations, Métis, and Inuit population, see First Nations People, Métis and Inuit in Canada: Diverse and Growing Populations (Statistics Canada 2018) or findings from the 2016 Census.
End of text box 1
Measuring police-reported crime in the Provincial North and territories
This report explores violent crimes committed against young women and girls (defined as female victims aged 24 and younger at the time of the incident) as reported and foundedNote by police in the North in 2017, and compares figures with those for young female victims in the South. Some gender-based analysis is provided throughout, though the reader should refer to a recent Statistics Canada publication (Conroy 2018) for a comprehensive analysis of gender disparities among young victims of violent crime at the national level.
The Provincial North boundary used in this study is based on provincial administrative regions defined by the Northern Development Ministers Forum and used by the Conference Board of Canada’s (2014) Centre for the North. The ‘North’ includes the three territories in addition to the northern regions of most of the Canadian provinces. This method of delineating the North and South provides more information on crime in Canada at the geographic level than was previously available (see Allen and Perreault 2015),Note and is applied in the current study:
- The ‘North’ includes (see Figure 1):
- The three territories (Yukon, the Northwest Territories, and Nunavut).
- The ‘Provincial North’ (northern regions of the following provinces: British Columbia, Alberta, Saskatchewan, Manitoba, Ontario, Quebec, and Newfoundland and Labrador).
- The ‘South’ includes:
- All of Prince Edward Island, Nova Scotia, and New Brunswick.
- The southern areas of the Canadian provinces that do not fall under the Provincial North.
Police-reported crime rates higher in northern Canada
When population size is accounted for, police-reported crime in Canada is typically far more prevalent in the North than in the South. In 2017, the overall rate of police-reported Criminal Code offences (including traffic violations) was nearly two-and-a-half (2.4x) times higher in the North (12,834 incidents per 100,000 population) than in the South (5,394). Prior research has found that high rates of mischief and disturbing the peace in the Provincial North and territories drove much of this gap (Allen and Perreault 2015).Note
However, the North/South crime rate gap was larger when looking specifically at violent crime. Violent crimes range from uttering threats to physical and sexual violence to homicide.Note In 2017, police-reported violent crime rates were close to three (2.8x) times higher in the North than in the South (2,456 versus 869 incidents per 100,000 population; Chart 1). To put this in perspective, while 6% of the Canadian population resided in the North in 2017, 15% of all police-reported violent crimes in Canada took place in the North (see Table 3 for list of violent offences).
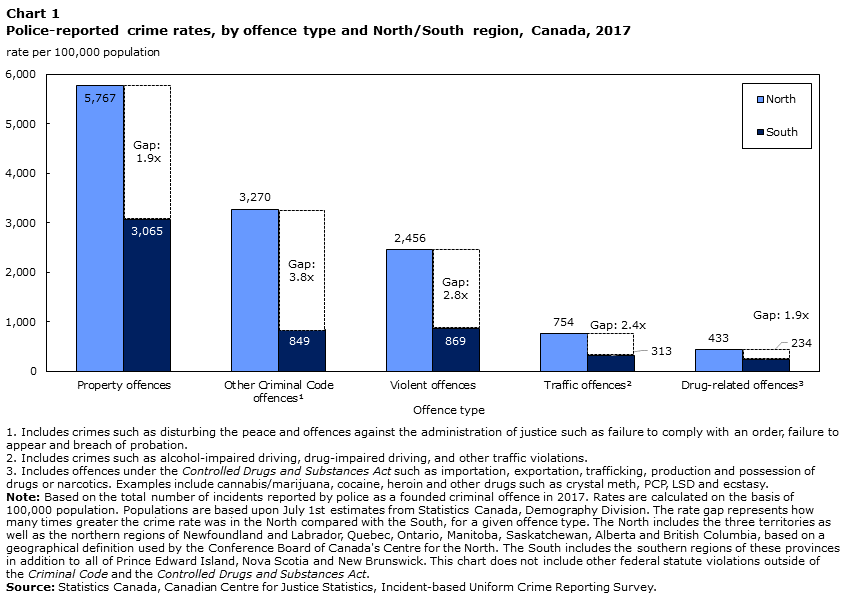
Data table for Chart 1
| Offence type | North | South | Gap in rate |
|---|---|---|---|
| rate per 100,000 population | |||
| Property offences | 5,767 | 3,065 | 1.9 |
| Other Criminal Code offencesData table Note 1 | 3,270 | 849 | 3.8 |
| Violent offences | 2,456 | 869 | 2.8 |
| Traffic offencesData table Note 2 | 754 | 313 | 2.4 |
| Drug-related offencesData table Note 3 | 433 | 234 | 1.9 |
Source: Statistics Canada, Canadian Centre for Justice Statistics, Incident-based Uniform Crime Reporting Survey. |
|||
Although the present report focuses on violent crimes, it is worth noting that crime rates were higher in the North than in the South across all other major crime types, including: property crimes (1.9x higher in the North), drug offences (1.9x), traffic offences (2.4x), and other Criminal Code offencesNote (3.8x) (Chart 1).
Violent crime in the North
Young women and girls in the North overrepresented among victims of violent crime
While young women and girls in the North accounted for less than 7% of the female population aged 24 and younger in Canada, according to 2017 police-reported data, they represented 17% of young female victims of violent crime across Canada.
In the North, females accounted for just under half (48%) of the population aged 24 and younger, but nearly two-thirds (62%) of victims of violent crime in the North were female. In fact, young women and girls in the North were overrepresented as victims of violent crime whether they were compared with all females, all young Canadians, or all Canadians in the North (Table 1). This overrepresentation among victims of violent crime was observed both in the territories and in the Provincial North.Note The disproportionate violent victimization of young women and girls–whether compared with older Canadians or males–is a finding that is consistent with past research (Allen and Perreault 2015; Boyce 2016; Hotton Mahony et al. 2017).
In 2017, over half (53%) of all victims of police-reported violent crimes were female, of whom nearly one-in-five (17%) resided in the North.Note Note About two-in-five (39%) of these female victims in the North were aged 24 and younger. Overall, 12,036 victims of police-reported violent crimes in the North were young women and girls aged 24 and younger.
Police-reported violent crime rate three times higher for young women and girls in the North than in the South
Young women and girls in Canada’s northern areas were victims of violent crime at higher rates than all other combinations of sex and age groups. In 2017, the police-reported violent crime rate for females aged 24 and younger in the North was 3,643 victims per 100,000 population. This was nearly three (2.9x) times higher than the rate for young women and girls in the South (1,235), close to twice (1.7x) as high as the rate for young men and boys in the North (2,090), and nearly four (3.8x) times higher than for the total Canadian population overall (968) (Chart 2; Table 2).

Data table for Chart 2
| Victim sex and age group | North | South |
|---|---|---|
| rate per 100,000 population | ||
| Young women and girls (0 to 24) | 3,643 | 1,235 |
| Adult women (25 to 89) | 2,521 | 779 |
| Total women and girls | 2,864 | 904 |
| Young men and boys (0 to 24) | 2,090 | 954 |
| Adult men (25 to 89) | 2,059 | 791 |
| Total men and boys | 2,069 | 839 |
| Canada | 968 | |
|
Note: Victim age group is based on the age of the victim at the time of the incident. Rates are calculated on the basis of 100,000 population. Populations are based upon July 1st estimates from Statistics Canada, Demography Division. The North includes the three territories as well as the northern regions of Newfoundland and Labrador, Quebec, Ontario, Manitoba, Saskatchewan, Alberta and British Columbia, based on a geographical definition used by the Conference Board of Canada's Centre for the North. The South includes the southern regions of these provinces in addition to all of Prince Edward Island, Nova Scotia and New Brunswick. Excludes victims where sex or age was unknown or older than 89 years. Source: Statistics Canada, Canadian Centre for Justice Statistics, Incident-based Uniform Crime Reporting Survey. |
||
When looking at age groups, police-reported data suggest that young adult women between 18 and 24 years old in the North were victims of violent crime at a higher rate (6,910 victims per 100,000 population) than all other combinations of sex, age, or North/South geography groups, followed by teenage girls between 15 and 17 years old in the North (6,557). Young adult women in the North had a violent crime rate nearly three-and-a-half (3.4x) times greater than those in the South. The widest North/South gap among female victims of violent crime, however, was seen among women aged 25 to 34 years old, who were victims of violent crime at a rate nearly four times (3.9x) higher in the North than in the South (Table 2).
Compared with their southern counterparts, young women and girls in the North had consistently higher crime rates across all violent offence types, including physical assaults, sexual assaults, and criminal harassment (Table 3). Overall, rates for crimes against young females were higher in the North across nearly all violent crime types, with the exception of robbery, trafficking in persons and commodification of sexual activity offences, and attempted murder, which had higher rates in the South, though these offences were committed far less frequently than other types of violent crimes.
Gender gap for violent victimization of young Canadians wider in the North than in the South
Young women and girls in the North were victims of violent crime at a rate close to twice (1.7x) that of their young male counterparts (3,643 versus 2,090 victims per 100,000 population) (Table 2). In the South, the violent crime rate was still higher for young females than for males (1,235 versus 954), but the gap was narrower (rate for females being 1.3x higher than for males) than in the North (1.7x), which suggests that the gender disparity for violent victimization of young Canadians is wider in the North than in the South. Among the older populations aged 25 and older in the North, adult women had a higher violent crime rate than adult men (2,521 versus 2,059; 1.2x greater), but there was virtually no gap between adult women and men in the South (779 versus 791). Overall, police-reported data suggest that the largest disparity in violent victimization between males and females is among young persons aged 24 and younger who live in the North.
When broken down further by age group, the largest gender disparity was noted among teenage victims between 15 and 17 years old in the North, where teenage girls were victims of a violent crime at a rate just over twice (2.1x) that of teenage boys (6,557 versus 3,140 victims per 100,000 population) (Table 2). In the South, the gap in violent crime rate between teen girls and boys was notably narrower (1.3x; 2,235 versus 1,699). The gender disparity for victims of violent crime was consistently wider in the North than in the South across all age groups.
Overall, in the North, females were always victims of violent crimes at higher rates than males, except for those aged 55 and older, where the rate was slightly greater for males. This was similar to the pattern in the South, with females generally having higher violent crime rates up until 45 years of age, after which the rate for males in the South was greater.
Compared with their male counterparts in the North, young women and girls in the North were victimized at a higher rate across all almost major types of violent offences, including: sexual offences (with a rate eight [8.0x] times higher for young female victims in the North than for males), physical assault offences (1.4x), criminal harassment and threat offences (1.4x), and deprivation of freedom offences (1.7x). Homicide offences were the exception, where young males in the North were victims of offences related to homicide or death at a higher rate than young females in the North (9.93 versus 3.93 victims per 100,000 population) (Table 3; Table 4).
Recent increase but overall decline in rate of young female victims of violent crime
The rate of police-reported violent crimes against young women and girls in the North generally declined from 2009Note to 2015, and then rose slightly year-over-year until 2017 (Table 5). The more recent increase was driven partly by a rise in reported sexual offences: from 2009 to 2017, the rate of sexual offences against young females that were reported by police increased by 32% in both the North and the South.Note This is likely not a reflection of an increase in sexual crimes committed, but rather of the increased reporting of incidents as founded crimes by police in addition to an increase in victims reporting to police after the #MeToo movement (see Rotenberg and Cotter 2018).
While overall rates of violent crime against young females saw a net decline from 2009 to 2017, the decrease was smaller for young females in the North (-11%) than for those in the South (-19%) (Table 5), as rates of physical assault and criminal harassment and threat-related offences did not decline as much in the North as they did in the South. Young male victims in the North saw a larger decline in overall violent crime rate over the nine-year period (-25%) (data not shownNote ), while rates were relatively unchanged for adult women aged 25 and older in the North (Table 5).
Rate of police-reported violent crime against females in the North first peaked at age 15 and continued at high rates until declining after age 30
In 2017, the police-reported violent crime rate in Canada overall first peaked for victims at age 15, after which the rate declined steadily with age (Chart 3). By contrast, for women and girls in the North, the rate spiked at age 15 and then remained consistently high–with some fluctuation–until declining at around age 31. This age victimization profile is unlike that for women in the South, which followed the overall Canada trend of decline after peaking at age 15, as well as unlike the profile for males in the North, where victimization was highest leading up to the victims’ thirties (Chart 3). Women and girls in the North were victims of a violent crime at higher rates than men and boys nearly consistently from birth up until around 50 years of age, after which point males in the North generally had higher rates than females.

Data table for Chart 3
| Victim age | Females in the North | Males in the North | Females in the South | Males in the South | Canada overall |
|---|---|---|---|---|---|
| rate per 100,000 population | |||||
| 0 | 327 | 215 | 83 | 116 | 113 |
| 1 | 269 | 265 | 142 | 145 | 153 |
| 2 | 369 | 257 | 157 | 138 | 159 |
| 3 | 391 | 269 | 228 | 199 | 221 |
| 4 | 603 | 395 | 284 | 226 | 271 |
| 5 | 700 | 657 | 324 | 286 | 331 |
| 6 | 804 | 543 | 383 | 309 | 368 |
| 7 | 952 | 745 | 384 | 347 | 399 |
| 8 | 1,048 | 894 | 411 | 377 | 434 |
| 9 | 1,041 | 1,075 | 458 | 428 | 485 |
| 10 | 1,754 | 1,467 | 511 | 495 | 578 |
| 11 | 2,344 | 1,538 | 654 | 599 | 714 |
| 12 | 3,442 | 2,145 | 1,088 | 894 | 1,107 |
| 13 | 4,309 | 2,530 | 1,705 | 1,142 | 1,548 |
| 14 | 5,378 | 2,813 | 2,164 | 1,526 | 1,985 |
| 15 | 7,171 | 2,970 | 2,363 | 1,664 | 2,204 |
| 16 | 5,952 | 2,998 | 2,190 | 1,720 | 2,111 |
| 17 | 6,555 | 3,434 | 2,158 | 1,710 | 2,122 |
| 18 | 6,474 | 3,377 | 2,136 | 1,617 | 2,058 |
| 19 | 6,586 | 3,912 | 2,107 | 1,554 | 2,026 |
| 20 | 6,773 | 3,925 | 2,122 | 1,575 | 2,045 |
| 21 | 7,081 | 3,726 | 1,984 | 1,536 | 1,967 |
| 22 | 6,640 | 3,937 | 1,968 | 1,494 | 1,930 |
| 23 | 7,379 | 4,076 | 1,900 | 1,436 | 1,895 |
| 24 | 7,360 | 3,950 | 1,868 | 1,431 | 1,876 |
| 25 | 7,007 | 4,100 | 1,860 | 1,531 | 1,918 |
| 26 | 6,775 | 4,101 | 1,776 | 1,421 | 1,814 |
| 27 | 6,970 | 4,018 | 1,707 | 1,416 | 1,781 |
| 28 | 6,754 | 4,310 | 1,667 | 1,328 | 1,718 |
| 29 | 7,192 | 4,101 | 1,576 | 1,311 | 1,676 |
| 30 | 6,735 | 4,541 | 1,608 | 1,638 | 1,847 |
| 31 | 5,084 | 4,095 | 1,471 | 1,268 | 1,552 |
| 32 | 5,198 | 3,994 | 1,427 | 1,221 | 1,509 |
| 33 | 5,091 | 3,652 | 1,396 | 1,214 | 1,479 |
| 34 | 4,532 | 3,340 | 1,387 | 1,146 | 1,416 |
| 35 | 4,563 | 3,588 | 1,354 | 1,291 | 1,477 |
| 36 | 4,541 | 2,982 | 1,282 | 1,120 | 1,345 |
| 37 | 3,998 | 3,041 | 1,273 | 1,049 | 1,293 |
| 38 | 4,083 | 2,908 | 1,233 | 1,098 | 1,295 |
| 39 | 3,908 | 2,937 | 1,220 | 1,011 | 1,244 |
| 40 | 4,095 | 3,155 | 1,216 | 1,170 | 1,329 |
| 41 | 3,596 | 2,986 | 1,118 | 1,018 | 1,194 |
| 42 | 3,780 | 2,686 | 1,085 | 952 | 1,142 |
| 43 | 3,387 | 2,584 | 1,057 | 945 | 1,112 |
| 44 | 3,153 | 2,764 | 988 | 969 | 1,090 |
| 45 | 3,192 | 2,844 | 972 | 996 | 1,099 |
| 46 | 2,841 | 2,476 | 951 | 925 | 1,036 |
| 47 | 2,918 | 2,464 | 893 | 932 | 1,012 |
| 48 | 2,468 | 2,751 | 835 | 901 | 966 |
| 49 | 2,636 | 2,607 | 806 | 869 | 937 |
| 50 | 2,328 | 2,188 | 766 | 897 | 912 |
| 51 | 2,026 | 1,912 | 674 | 790 | 804 |
| 52 | 1,813 | 1,983 | 659 | 806 | 802 |
| 53 | 1,460 | 1,811 | 605 | 713 | 718 |
| 54 | 1,421 | 1,459 | 544 | 711 | 677 |
| 55 | 1,376 | 1,431 | 550 | 684 | 666 |
| 56 | 1,261 | 1,515 | 473 | 647 | 613 |
| 57 | 1,006 | 1,310 | 424 | 574 | 540 |
| 58 | 779 | 1,109 | 383 | 544 | 494 |
| 59 | 816 | 1,087 | 352 | 513 | 466 |
| 60 | 672 | 875 | 320 | 497 | 432 |
| 61 | 656 | 772 | 278 | 455 | 388 |
| 62 | 633 | 741 | 264 | 436 | 370 |
| 63 | 482 | 659 | 252 | 397 | 339 |
| 64 | 430 | 611 | 221 | 373 | 310 |
| 65 | 395 | 664 | 219 | 341 | 295 |
| 66 | 371 | 651 | 196 | 290 | 259 |
| 67 | 318 | 538 | 194 | 293 | 254 |
| 68 | 406 | 479 | 160 | 265 | 225 |
| 69 | 323 | 473 | 171 | 232 | 212 |
| 70 | 273 | 429 | 165 | 247 | 213 |
| 71 | 276 | 438 | 126 | 230 | 187 |
| 72 | 450 | 465 | 139 | 208 | 188 |
| 73 | 313 | 406 | 137 | 188 | 173 |
| 74 | 300 | 309 | 133 | 178 | 163 |
| 75 | 190 | 501 | 157 | 160 | 169 |
| 76 | 232 | 358 | 126 | 182 | 160 |
| 77 | 170 | 322 | 151 | 158 | 159 |
| 78 | 276 | 257 | 153 | 157 | 161 |
| 79 | 394 | 246 | 131 | 145 | 148 |
| 80 | 188 | 319 | 141 | 145 | 148 |
| 81 | 201 | 191 | 127 | 124 | 129 |
| 82 | 86 | 188 | 141 | 110 | 128 |
| 83 | 92 | 212 | 179 | 110 | 149 |
| 84 | 98 | 463 | 139 | 143 | 146 |
| 85 | 132 | 179 | 155 | 158 | 156 |
| 86 | 208 | 163 | 121 | 142 | 133 |
| 87 | 65 | 186 | 146 | 158 | 149 |
| 88 | 75 | 181 | 173 | 168 | 168 |
| 89 | 83 | 367 | 134 | 164 | 147 |
|
Note: Victim age is based on the age of the victim at the time of the incident. Rates are calculated on the basis of 100,000 population. Populations are based upon July 1st estimates from Statistics Canada, Demography Division. The North includes the three territories as well as the northern regions of Newfoundland and Labrador, Quebec, Ontario, Manitoba, Saskatchewan, Alberta and British Columbia, based on a geographical definition used by the Conference Board of Canada's Centre for the North. The South includes the southern regions of these provinces in addition to all of Prince Edward Island, Nova Scotia and New Brunswick. Excludes victims where sex or age was unknown or older than 89 years. Source: Statistics Canada, Canadian Centre for Justice Statistics, Incident-based Uniform Crime Reporting Survey. |
|||||
Gap in violent victimization rates between young women and girls in the North and the South mostly driven by physical assaults
Young women and girls in the North were victims of violent crime at higher rates than their southern counterparts across all major violent offence types (Chart 4). That said, by far the biggest discrepancy was for physical assault-related offences,Note for which rates were nearly four (3.9x) times higher among young women and girls in the North than in the South (2,283 victims per 100,000 population versus 581) (Table 3).Note Physical assault-related offences also accounted for a much greater proportion of violent crimes against young women and girls in the North than in the South (63% versus 47%), most of which were level 1 physical assault offences (Table 6).Note Note
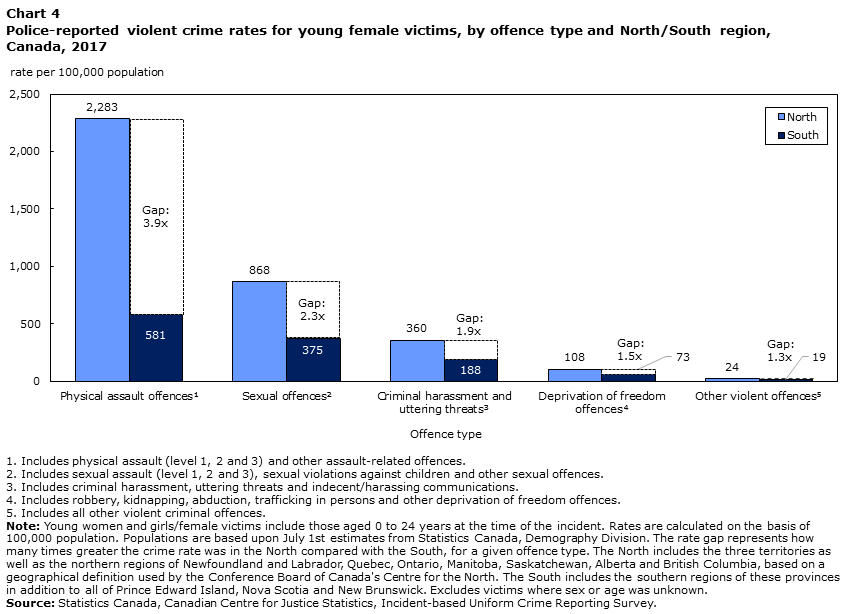
Data table for Chart 4
| Offence type | North | South | Gap in rate |
|---|---|---|---|
| rate per 100,000 population | |||
| Physical assault offencesData table Note 1 | 2,283 | 581 | 3.9 |
| Sexual offencesData table Note 2 | 868 | 375 | 2.3 |
| Criminal harassment and uttering threatsData table Note 3 | 360 | 188 | 1.9 |
| Deprivation of freedom offencesData table Note 4 | 108 | 73 | 1.5 |
| Other violent offencesData table Note 5 | 24 | 19 | 1.3 |
Source: Statistics Canada, Canadian Centre for Justice Statistics, Incident-based Uniform Crime Reporting Survey. |
|||
Violence against females in the North shifts from mostly sexual in nature during childhood to mostly physical assault as victims enter adulthood
There was a notable shift in the types of police-reported violent crimes committed against females in the North as victims’ moved into their adult years. Younger victims were more often victimized sexually, while young women were more often victimized physically as they entered adulthood, at around 18 years of age, and in the years leading up to it. These shifts were also consistent with age victimization trends for females in the South, and to a lesser extent males in either region, as rates of physical assault-related crimes were generally higher than sexual crimes for males at any age, though a spike is noted for younger boys who were victims of a sexual offence (data not shown; see also Cotter and Beaupré 2014; Rotenberg 2017a). When interpreting rates of sexual offences, it is important to recall that only 1 in 20Note sexual assaults are reported to police (Conroy and Cotter 2017), and therefore sexual crimes reported by police likely underestimate the true extent of sexual assault and sexual violence against young women and girls in Canada.
In the North, while crime rates for physical assault-related offences were highest for women in their mid-twenties to around 30 years old, sexual offences (including sexual assault, sexual offences against children, and other sexual offences) peaked much younger at around 15 years of age (Chart 5). Rates of sexual victimization declined abruptly after the late teen years, whereas rates for physical assault offences were high and relatively stable for a longer period throughout adulthood. Criminal harassment and uttering threat offences had a relatively stable rate beginning with young women at 16 years of age until their late forties.
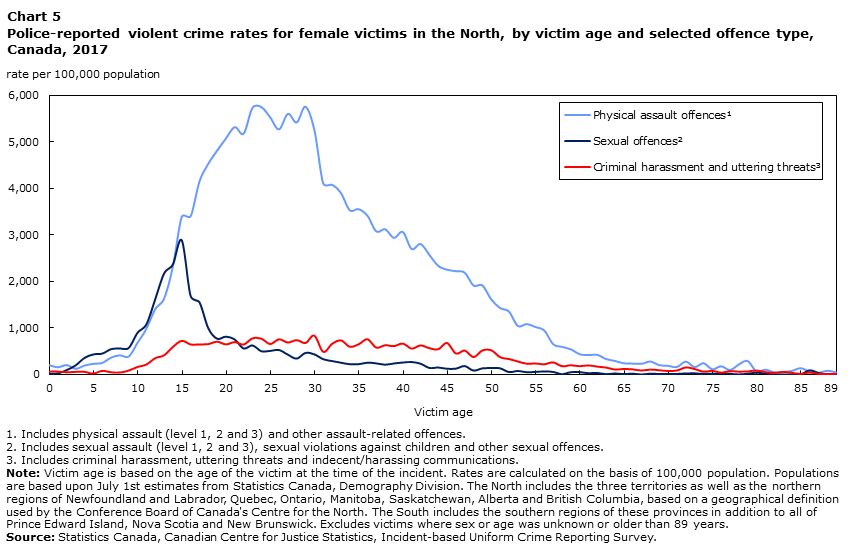
Data table for Chart 5
| Victim age | Physical assault offencesData table Note 1 | Sexual offencesData table Note 2 | Criminal harassment and uttering threatsData table Note 3 |
|---|---|---|---|
| rate per 100,000 population | |||
| 0 | 199 | 14 | 50 |
| 1 | 152 | 22 | 51 |
| 2 | 200 | 96 | 37 |
| 3 | 120 | 195 | 45 |
| 4 | 189 | 355 | 45 |
| 5 | 226 | 429 | 8 |
| 6 | 246 | 446 | 67 |
| 7 | 359 | 542 | 37 |
| 8 | 410 | 557 | 29 |
| 9 | 384 | 569 | 74 |
| 10 | 679 | 892 | 153 |
| 11 | 982 | 1,077 | 206 |
| 12 | 1,405 | 1,610 | 345 |
| 13 | 1,632 | 2,163 | 408 |
| 14 | 2,328 | 2,361 | 590 |
| 15 | 3,394 | 2,873 | 724 |
| 16 | 3,404 | 1,686 | 645 |
| 17 | 4,154 | 1,547 | 646 |
| 18 | 4,537 | 992 | 654 |
| 19 | 4,823 | 767 | 705 |
| 20 | 5,083 | 811 | 648 |
| 21 | 5,327 | 748 | 697 |
| 22 | 5,187 | 558 | 644 |
| 23 | 5,743 | 621 | 779 |
| 24 | 5,761 | 498 | 772 |
| 25 | 5,537 | 506 | 656 |
| 26 | 5,279 | 524 | 758 |
| 27 | 5,614 | 424 | 689 |
| 28 | 5,428 | 341 | 741 |
| 29 | 5,767 | 463 | 679 |
| 30 | 5,263 | 430 | 838 |
| 31 | 4,117 | 327 | 484 |
| 32 | 4,085 | 287 | 658 |
| 33 | 3,909 | 252 | 734 |
| 34 | 3,537 | 220 | 597 |
| 35 | 3,559 | 221 | 648 |
| 36 | 3,418 | 253 | 758 |
| 37 | 3,081 | 238 | 577 |
| 38 | 3,125 | 209 | 628 |
| 39 | 2,943 | 236 | 608 |
| 40 | 3,068 | 257 | 665 |
| 41 | 2,701 | 266 | 554 |
| 42 | 2,808 | 231 | 625 |
| 43 | 2,575 | 139 | 564 |
| 44 | 2,338 | 149 | 541 |
| 45 | 2,256 | 123 | 675 |
| 46 | 2,223 | 125 | 449 |
| 47 | 2,190 | 180 | 510 |
| 48 | 1,915 | 83 | 371 |
| 49 | 1,916 | 130 | 513 |
| 50 | 1,615 | 135 | 518 |
| 51 | 1,429 | 132 | 368 |
| 52 | 1,351 | 51 | 327 |
| 53 | 1,044 | 75 | 273 |
| 54 | 1,082 | 48 | 224 |
| 55 | 1,020 | 54 | 229 |
| 56 | 943 | 65 | 212 |
| 57 | 651 | 54 | 253 |
| 58 | 592 | 6 | 169 |
| 59 | 540 | 49 | 190 |
| 60 | 433 | 50 | 170 |
| 61 | 415 | 27 | 188 |
| 62 | 420 | 33 | 160 |
| 63 | 328 | 7 | 140 |
| 64 | 289 | 22 | 96 |
| 65 | 237 | 8 | 111 |
| 66 | 231 | 17 | 99 |
| 67 | 226 | 0 | 75 |
| 68 | 276 | 17 | 95 |
| 69 | 197 | 9 | 81 |
| 70 | 182 | 9 | 64 |
| 71 | 159 | 11 | 74 |
| 72 | 272 | 24 | 142 |
| 73 | 157 | 24 | 108 |
| 74 | 237 | 12 | 50 |
| 75 | 109 | 14 | 68 |
| 76 | 174 | 14 | 29 |
| 77 | 92 | 15 | 62 |
| 78 | 211 | 0 | 49 |
| 79 | 287 | 18 | 54 |
| 80 | 56 | 38 | 75 |
| 81 | 100 | 20 | 40 |
| 82 | 43 | 0 | 22 |
| 83 | 46 | 0 | 46 |
| 84 | 74 | 0 | 25 |
| 85 | 132 | 0 | 0 |
| 86 | 59 | 89 | 30 |
| 87 | 32 | 32 | 0 |
| 88 | 75 | 0 | 0 |
| 89 | 41 | 0 | 0 |
Source: Statistics Canada, Canadian Centre for Justice Statistics, Incident-based Uniform Crime Reporting Survey. |
|||
Victimization age patterns by offence type were similar in the South, with the exception of physical assault-related offences peaking at a younger age (early twenties) than in the North (data not shown). These findings are consistent with research that has highlighted the various risk factors, including the age of the victim, for different types of victimization. For example: children, students or those in the teen to young adult age group have a higher risk for sexual assault, while physical assaults tend to be committed against older women and are often tied to domestic violence (Allen and McCarthy 2018; Conroy 2018; Perreault 2015).
Rate of violent crime against young women and girls two times higher in the territories than in the Provincial North overall
According to 2017 police-reported data, regardless of victim age or sex, violent crime rates were higher in the territories than in the Provincial North overall, and higher in the Provincial North than in the South (Chart 6). For young women and girls aged 24 and younger, the violent crime rate in the territories (7,232 victims per 100,000 population) was about twice (2.1x) that of the Provincial North (3,391), while the rate in the Provincial North was over two-and-a-half (2.7x) times that of the South (1,235). However, differences in rates were observed at the provincial level (see the section “Rates of violent crimes against women and girls higher in northern Saskatchewan and northern Manitoba than in the territories”), as well as across major cities (Table 7).
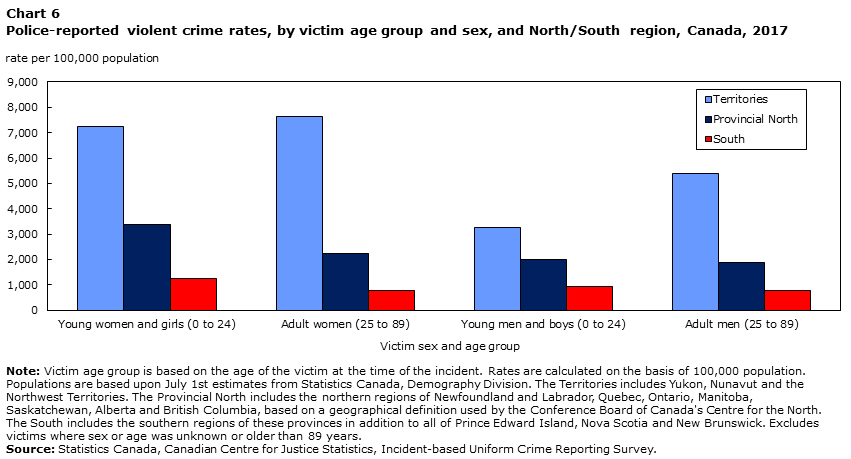
Data table for Chart 6
| Victim sex and age group | Territories | Provincial North | South |
|---|---|---|---|
| rate per 100,000 population | |||
| Young women and girls (0 to 24) | 7,232 | 3,391 | 1,235 |
| Adult women (25 to 89) | 7,635 | 2,255 | 779 |
| Young men and boys (0 to 24) | 3,272 | 2,008 | 954 |
| Adult men (25 to 89) | 5,379 | 1,881 | 791 |
|
Note: Victim age group is based on the age of the victim at the time of the incident. Rates are calculated on the basis of 100,000 population. Populations are based upon July 1st estimates from Statistics Canada, Demography Division. The Territories includes Yukon, Nunavut and the Northwest Territories. The Provincial North includes the northern regions of Newfoundland and Labrador, Quebec, Ontario, Manitoba, Saskatchewan, Alberta and British Columbia, based on a geographical definition used by the Conference Board of Canada's Centre for the North. The South includes the southern regions of these provinces in addition to all of Prince Edward Island, Nova Scotia and New Brunswick. Excludes victims where sex or age was unknown or older than 89 years. Source: Statistics Canada, Canadian Centre for Justice Statistics, Incident-based Uniform Crime Reporting Survey. |
|||
Rural areas in northern Canada drive up rates of violent crime against young women and girls in the North
Urban versus rural population measures provide another level of geographical distinction that can be used alongside analysis of North/South regions.Note Note Within the Provincial North, there are both urban and rural areas: around 40% of the population living in northern Quebec,Note northern Ontario, and northern British Columbia live in rural areas and small towns (i.e., outside of census metropolitan areas or census agglomerationsNote ), while all of northern Newfoundland and Labrador and northern Saskatchewan is considered rural (Allen and Perreault 2015).
Although rural areas were home to just under half (48%) of the female population aged 24 and younger in the North,Note over two-thirds (67%) of police-reported violent crimes against young female victims in the North took place in a rural area. By contrast, in the South, the proportion of young females living in a rural area (14%) was roughly on par with the percent of violent crimes committed against young females that took place in a rural area (17%). This finding underscores the considerably disproportionate violent victimization of young women and girls in the most remote and rural areas of the North. Rural areas in the North include over 200 remote townships and communities with populations ranging from over 100 to 30,000 residents.Note The remaining third (33%) of young female victims of police-reported violent crime in the North resided in urban areas. This includes larger cities such as Greater Sudbury (Ontario), Saguenay (Quebec), and Thunder Bay (Ontario), as well as Thompson (Manitoba), Prince George (British Columbia), Wood Buffalo (Alberta), Grande Prairie (urban section, Alberta),Note Timmins (Ontario), and North Bay (Ontario) among other smaller townships.
The rate of violent crime against young women and girls was two (2.1x) times higher in northern rural areas than in northern urban areas (5,023 versus 2,354 victims per 100,000 population). While on a national level, rates of violent crimes against young women and girls are higher in rural areas (Conroy 2018), it is clear that the gap is far wider in the North than in the South. As a result, the findings suggest that the gap in violent crimes between young female victims in the North and South is driven in large part by violence in the rural North (Chart 7), which is also the case for police-reported crime overall (Perreault 2019). The type of crime also varied, with violent crimes against young women and girls in the rural North more likely to be physical assault-related than in the urban North (68% versus 52%), and consequently, less commonly a sexual offence (21% versus 29%) or criminal harassment and threat-related offence (8% versus 14%) (data not shown).

Data table for Chart 7
| North/South region | North | South | Canada overall |
|---|---|---|---|
| rate per 100,000 population | |||
| RuralData table Note 1 | 5,023 | 1,526 | 2,212 |
| UrbanData table Note 2 | 2,354 | 1,188 | 1,236 |
| Gap in rate | 2.1 | 1.3 | 1.8 |
Source: Statistics Canada, Canadian Centre for Justice Statistics, Incident-based Uniform Crime Reporting Survey. |
|||
Rates of violent crimes against women and girls higher in northern Saskatchewan and northern Manitoba than in the territories
Consistent with past research (Allen and Perreault 2015), in 2017, police-reported violent crime rates against young women and girls were higher in the North than they were in the South across all provinces, with the largest North/South gap reported in Saskatchewan (6.4x higher in the North) and Manitoba (4.9x). Northern Saskatchewan reported the highest rate at 13,886 victims per 100,000 population, followed by northern Manitoba (9,025), both of which had a higher rate than each of the three territories, though not notably higher than the Northwest Territories (8,909) (Chart 8; Table 8). This was not unique to young female victims; rather, northern Saskatchewan and northern Manitoba had consistently higher violent crime rates than the territories for males and females of all major age groups (Table 9), with northern Saskatchewan having the highest rate at over twice (2.2x) that for Canadians in the territories overall (13,071 versus 6,002). Northern Saskatchewan in particular shares several similar socio-economic conditions with the territories, such as a high population of Indigenous people, a generally younger population, larger families and lone-parent families, more adults without high school or postsecondary education, higher unemployment rates, and lower income levels (Allen and Perreault 2015; Statistics Canada 2013b).

Data table for Chart 8
| Province or territory | North | South |
|---|---|---|
| rate per 100,000 population | ||
| Canada | 3,643 | 1,235 |
| Nunavut | 7,491 | Note ...: not applicable |
| Northwest Territories | 8,909 | Note ...: not applicable |
| Yukon | 4,356 | Note ...: not applicable |
| British Columbia | 2,316 | 1,014 |
| Alberta | 2,460 | 1,272 |
| Saskatchewan | 13,886 | 2,158 |
| Manitoba | 9,025 | 1,827 |
| Ontario | 2,734 | 1,000 |
| Quebec | 2,279 | 1,399 |
| New Brunswick | Note ...: not applicable | 1,730 |
| Nova Scotia | Note ...: not applicable | 1,776 |
| Prince Edward Island | Note ...: not applicable | 1,155 |
| Newfoundland and Labrador |
6,153 | 1,351 |
|
... not applicable Note: Young women and girls/female victims include those aged 0 to 24 years at the time of the incident. Rates are calculated on the basis of 100,000 population. Populations are based upon July 1st estimates from Statistics Canada, Demography Division. The North includes the three territories as well as the northern regions of Newfoundland and Labrador, Quebec, Ontario, Manitoba, Saskatchewan, Alberta and British Columbia, based on a geographical definition used by the Conference Board of Canada's Centre for the North. The South includes the southern regions of these provinces in addition to all of Prince Edward Island, Nova Scotia and New Brunswick. Excludes victims where sex or age was unknown. Source: Statistics Canada, Canadian Centre for Justice Statistics, Incident-based Uniform Crime Reporting Survey. |
||
Some differences were noted across violent crime types. Though northern Saskatchewan reported the highest rates of both physical assault offences (10,882 victims per 100,000 population) and criminal harassment and threat-related offences (919) against young women and girls, the Northwest Territories reported the highest rates for sexual offences (1,827) (see Table 10).
When the provinces and territories were further broken down by urban and rural areas, northern Saskatchewan–which is entirely ruralNote –remained the area with the highest reported rate of violent crime against young women and girls, at 13,886 victims per 100,000 population. Rural areas in the Northwest Territories had a similarly high rate of violent crimes against young women and girls (13,190), followed by northern urban Manitoba (10,053), which, contrary to most other provinces with a northern region, had a higher rate in the urban North than in the rural North (8,881) (Chart 9).Note
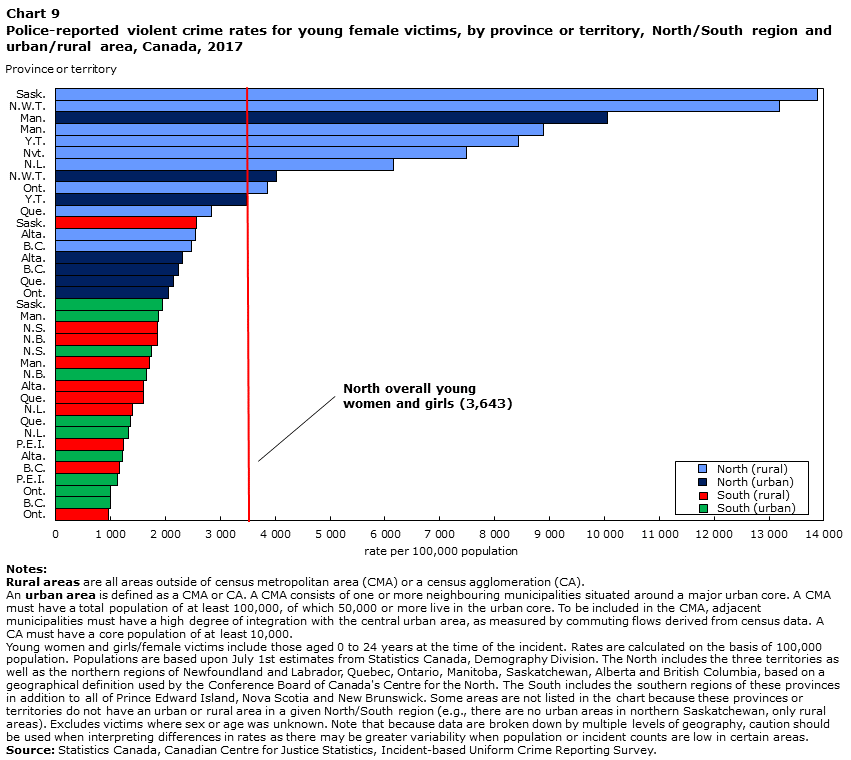
Data table for Chart 9
| Province or territory | Rate per 100,000 population |
|---|---|
| Saskatchewan, North (rural) | 13,886 |
| Northwest Territories, North (rural) | 13,190 |
| Manitoba, North (urban) | 10,053 |
| Manitoba, North (rural) | 8,881 |
| Yukon, North (rural) | 8,431 |
| Nunavut, North (rural) | 7,491 |
| Newfoundland and Labrador, North (rural) | 6,153 |
| Northwest Territories, North (urban) | 4,024 |
| Ontario, North (rural) | 3,865 |
| Yukon, North (urban) | 3,468 |
| Quebec, North (rural) | 2,840 |
| Saskatchewan, South (rural) | 2,568 |
| Alberta, North (rural) | 2,538 |
| British Columbia, North (rural) | 2,473 |
| Alberta, North (urban) | 2,312 |
| British Columbia, North (urban) | 2,231 |
| Quebec, North (urban) | 2,138 |
| Ontario, North (urban) | 2,061 |
| Saskatchewan, South (urban) | 1,939 |
| Manitoba, South (urban) | 1,879 |
| Nova Scotia, South (rural) | 1,849 |
| New Brunswick, South (rural) | 1,845 |
| Nova Scotia, South (urban) | 1,741 |
| Manitoba, South (rural) | 1,701 |
| New Brunswick, South (urban) | 1,658 |
| Alberta, South (rural) | 1,605 |
| Quebec, South (rural) | 1,592 |
| Newfoundland and Labrador, South (rural) | 1,392 |
| Quebec, South (urban) | 1,365 |
| Newfoundland and Labrador, South (urban) | 1,324 |
| Prince Edward Island, South (rural) | 1,230 |
| Alberta, South (urban) | 1,220 |
| British Columbia, South (rural) | 1,155 |
| Prince Edward Island, South (urban) | 1,117 |
| Ontario, South (urban) | 1,003 |
| British Columbia, South (urban) | 1,001 |
| Ontario, South (rural) | 966 |
| North overall young women and girls | 3,643 |
|
Notes: |
|
Violent crimes against women and girls more severe in the North than in the South
In Canada, violent crimes include a number of offences that range in degree of severity or harm to the victim.Note Young females in the North were victims of more serious violent offences at higher rates than their counterparts in the South: aggravated physical assaults (level 3) had a rate seven (7.0x) times greater in the North than in the South (34 versus 5 victims per 100,000 population), representing the largest North/South gap across all violent offence types (Table 3). Level 2 physical assaults against young females in the North had a rate nearly four (3.8x) times higher than in the South (417 versus 109), as did homicide and other offences causing death (3.4x; 3.33 versus 0.98; see the Homicides in the North section of this paper). Compared with young men and boys aged 24 and younger also living in the North, young females had higher rates of the lowest level of physical assault (level 1) but lower rates of the more serious level 2 and 3 physical assaults (see Table 3 and Table 4).Note Young women and girls in the North also had lower rates of homicide than young men and boys in the North.Note
According to crimes reported by police in 2017, violence against women and girls was more likely to result in physical injuries in the North than in the South (Chart 10; Table 11). While close to half (45%) of young female victims of violent crime in the North suffered a physical injury (the vast majority of which were classified by police as minor injuriesNote ), about one-third (32%) of young female victims in the South had suffered the same.Note Even when considering only physical assault-related offences, a higher proportion of victims in the North had suffered a physical injury than in the South (63% versus 54%; data not shown).Note A lower proportion of young female victims of violent crime suffered a physical injury than did young male victims also living in the North (45% versus 51%) (Chart 10).
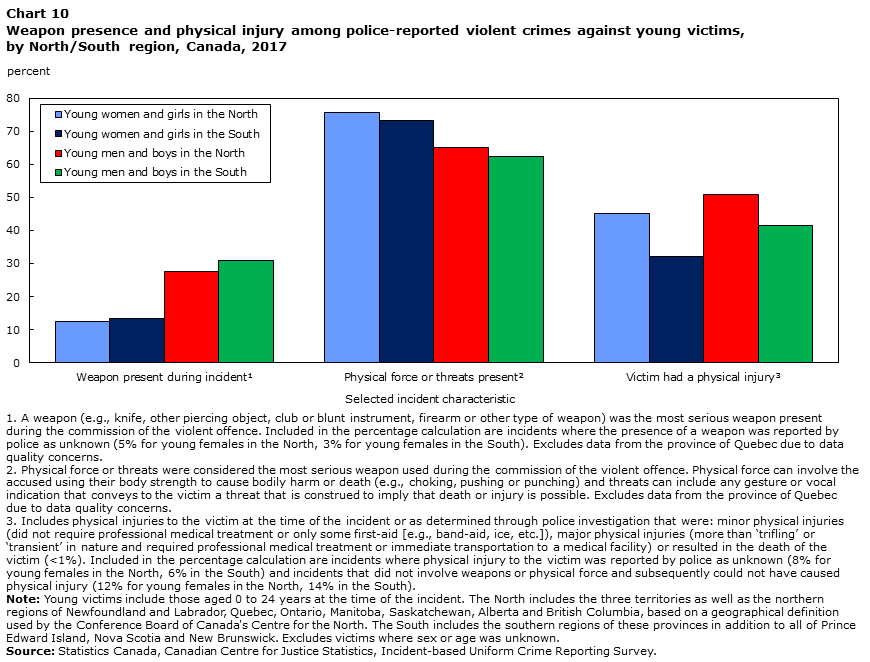
Data table for Chart 10
| Selected incident characteristic | Young women and girls in the North | Young women and girls in the South | Young men and boys in the North | Young men and boys in the South |
|---|---|---|---|---|
| percent | ||||
| Weapon present during incidentData table Note 1 | 13 | 13 | 28 | 31 |
| Physical force or threats presentData table Note 2 | 76 | 73 | 65 | 62 |
| Victim had a physical injuryData table Note 3 | 45 | 32 | 51 | 41 |
Source: Statistics Canada, Canadian Centre for Justice Statistics, Incident-based Uniform Crime Reporting Survey. |
||||
Violent crimes against young women and girls were far less likely to involve a weapon than violence against young men and boys, whether in the North or the South (Chart 10). Though weapons were present in a nearly equal proportion of violent crimes against young females in the North and the South (both 13%; Table 11),Note among these, crimes against young women and girls in the North were slightly more likely to involve a knife or cutting instrument (31% versus 29%) and less likely to involve a firearm (10% versus 13%) (data not shown). For both young women and girls in the North and the South, as well and young males in either region, a higher proportion of victims had suffered a physical injury when a weapon was present (data not shown).
Of note, higher proportions of physical injury to victims of violent crimes in the North was not unique to young women and girls; in fact, adult women, young males, and adult male victims in the North also suffered a physical injury in greater proportions (an average of 10% higher) than their southern counterparts,Note even when considering only physical assault offencesNote (data not shown).
Young women and girls in the North most commonly violently victimized by a male older than them
According to 2017 police-reported data where an accused had been identified by police in connection with a violent crime,Note most young women and girls aged 24 and younger in the North were victimized by a male (77%), the vast majority (82%) of whom were older than them.Note Over half (53%) of these older male assailants were more than five years older than their young female victim, and over one-third (36%) were 10 or more years older. The age differences for young female victims and their male assailants in the North were similar to that of the South (Table 12). Because of the unique differences between male and female perpetrators, female against female violent crimes in the North are explored in Text box 2.
Start of text box 2
Text box 2
Female-against-female violence
The relationship between the victim and the perpetrator in female-against-female violence is often of a very different nature than for males who victimize women or girls. In 2017, just under one-quarter (23%) of perpetrators of a police-reported violent crime against a young woman or girl in the North were also female,Note a higher proportion than in the South (17%).
Three-in-five (61%) females accused of a violent crime against a young female in the North were also under 25 years old like their victims, and nearly one-third (31%) were youth offenders between 12 and 17 years old, a much larger proportion than among male perpetrators of violence against a young female (13%). As a result, females accused of a violent offence against another female in the North were generally closer in age to their victim and typically skewed younger in age than males who committed a violent offence against a female (median age of 21 versus 24 years old). The findings are similar at the national level, where female offending typically peaks at a younger age than for male offenders (Savage 2019).
Female perpetrators of violence against a young female in the North were most commonly a casual acquaintance (44%), followed by a family member (28%)–most often an extended family member (11%)–or a friend, neighbour, or roommate (12%). Overall, female accused in the North were more likely to be casual acquaintances of the victim than were male accused in the North, as they were less often an intimate partner of or related to the victim (data not shown).
End of text box 2
Violence against young women and girls in the North most often perpetrated by an intimate partner, a casual acquaintance, or family member
Overall, when considering both male and female perpetrators of a violent crime against a young female (with males representing the majority of accused in the North [77%] and in the South [83%]), victimization by a stranger was less common in the North (5%) compared with the South (8%). This may be explained by the realities of smaller communities in the North where people are more likely to know each other. The nature of victim-accused relationships were more or less consistent for young women and girls in the North compared with the South (Chart 11; Table 12), with the exception of intimate partner relationships where current partners were more common in the North rather than former partners, as well as more family members, particularly extended family.
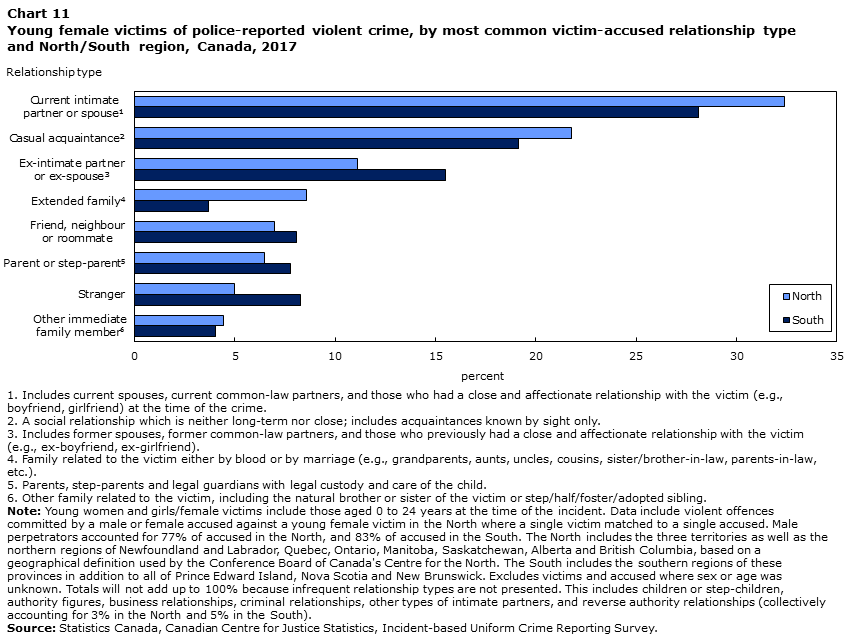
Data table for Chart 11
| Relationship type | North | South |
|---|---|---|
| percent | ||
| Current intimate partner or spouseData table Note 1 | 32 | 28 |
| Casual acquaintanceData table Note 2 | 22 | 19 |
| Ex-intimate partner or ex-spouseData table Note 3 | 11 | 15 |
| Extended familyData table Note 4 | 9 | 4 |
| Friend, neighbour or roommate | 7 | 8 |
| Parent or step-parentData table Note 5 | 6 | 8 |
| Stranger | 5 | 8 |
| Other immediate family memberData table Note 6 | 4 | 4 |
Source: Statistics Canada, Canadian Centre for Justice Statistics, Incident-based Uniform Crime Reporting Survey. |
||
Just over two-in-five (44%) young female victims of violent crime in the North were victimized by an intimate partner, whether a current (32%) or ex-intimate partner (11%), including spouses (Chart 11). The large majority (74%) of young females in the North who were victimized by an intimate partner had been in a relationship with their assailant at the time of the crime,Note while one-in-four (25%) were ex-partnersNote when the violence took place.Note More than one-third (36%) of young females in the North who were victimized by an intimate partner had been living with their assailant when the incident occurred.Note
Although intimate partner violence accounted for an equal proportion of violent crimes against young women and girls in the North (44%) as it did in the South (44%), the status of the intimate relationship differed. Compared with the South, a larger proportion of young female victims in the North knew their assailant as a current boyfriend or girlfriend at the time of the crime (27% versus 20%) rather than as a former boyfriend or girlfriend (10% versus 12%)Note (Table 12). Said otherwise, compared with the South, young females in the North who were subjected to violence by an intimate partner were more commonly victimized by someone they were currently dating when the violence took place (61% in the North versus 46% in the South), rather than an ex-intimate partner, which was more common in the South (22% versus 27%).
Overall, the rate of violent crimes committed by an intimate partner was three-and-a-half (3.5x) times greater for young female victims in the North than in the South (959 versus 271 victims per 100,000 population) (data not shown), which is a wider gap than for the overall rate of violent crimes committed against young women and girls in the North compared with the South (2.9x).
When broken down by sex of the accused, male perpetrators of violence against a young female in the North were most commonly an intimate partner (55%), whereas this was infrequently the case for female perpetrators (5%). As a result, compared with female perpetrators, male perpetrators of violence against a young female in the North were less commonly most other relationship types (e.g., family member [18% of male perpetrators versus 28% of female perpetrators], casual acquaintance [15% versus 44%], or a friend, neighbour, or roommate [5% versus 12%]). However, male perpetrators knew their victim more often, as a lower proportion of violent crimes against a young female in the North were committed by a male who was a stranger to the victim (4%) than they were by a female perpetrator (8%) (data not shown).
Just over one-in-five (22%) young female victims of violent crime in the North were victimized by a casual acquaintance, and another one-in-five (20%) by a family member (other than a spouse). Most family members were extended family (9%) (e.g., grandparents, aunts, uncles, cousins, sisters/brothers-in-law, or parents-in-law, etc.Note ), followed by a parent (6%),Note or other immediate family, namely, a sibling (e.g., brothers or sisters, including step/half/foster/adopted siblings) (4%) (Chart 11; Table 12). Just over two-in-five (42%) victims had been living with the family member who victimized them.Note
Overall, violent crimes committed against young women and girls by a family member had a rate nearly four-and-a-half (4.4x) times higher in the North than in the South (438 versus 99 victims per 100,000 population) (data not shown). In addition to a higher prevalence, a higher proportion of young female victims in the North were victimized by a family member than in the South (20% versus 16%). Among these, extended family members accounted for nearly double the proportion of assailants in the North than they did in the South (43% versus 23%), which translated to a rate of violent victimization at the hands of an extended family member more than eight (8.4x) times higher in the North (187 versus 22) (data not shown). According to Census data, Indigenous populations, particularly those in the North, are more likely to live in crowded householdsNote with other family members (Statistics Canada 2018); however, among victims of violent crime at the hands of a family member, young women and girls were less likely to have been living with their assailant in the North than in the South (42% versus 55%),Note which suggests that family violence against young women and girls in the North is not driven solely by living with more family. For more information on the living conditions of the Indigenous population, see recent Census publications (Statistics Canada 2017b; Statistics Canada 2017c; Statistics Canada 2018).
In the context of family and domestic violence, it is also important to consider how the historical mistreatment of Indigenous peoples, including the use of residential schools and forced assimilation, contributes to intergenerational trauma in the North. Violence within the family can be a consequence of the social, cultural and economic insecurities resulting from a history of exclusion, which then fuels a cycle of violence whereby victims or observers of violence become perpetrators of violence later on in life (Bombay et al. 2009; Bombay et al. 2014; Holmes and Hunt 2017; Klingspohn 2018).
Girls mostly victimized by family, young women by intimate partners
Research has established that young female victims of violence are at a greater risk than older victims for victimization at the hands of a family member (Conroy 2018). The same was the case in the North: over half (54%) of female victims under 12 years old in the North had been violently victimized by a family member (24% by a parent, 20% by extended family, and 10% by other immediate family), whereas this was less commonly the case for older victim groups (Chart 12).

Data table for Chart 12
| Victim age group | ||||
|---|---|---|---|---|
| Adult women (25 to 89) | Young adult women (18 to 24) | Youth girls (12 to 17) | Girls (0 to 11) | |
| proportion of female victims | ||||
| Intimate partner or spouseData table Note 1 | 56 | 61 | 24 | 0 |
| Parent or step-parentData table Note 2 | 2 | 3 | 9 | 24 |
| Other family (non-spousal)Data table Note 3 | 14 | 10 | 16 | 30 |
| Casual acquaintanceData table Note 4 | 14 | 16 | 32 | 25 |
| Friend, neighbour or roommate | 4 | 5 | 11 | 9 |
| Stranger | 5 | 4 | 6 | 8 |
Source: Statistics Canada, Canadian Centre for Justice Statistics, Incident-based Uniform Crime Reporting Survey. |
||||
Unlike children under 12, young girls in the North between 12 and 17 were most commonly victimized by a casual acquaintance (32%), two-thirds (67%) of whom were within five years of the victim’s age. Adolescent women between 18 and 24 years old were most likely to have been victimized by an intimate partner (61%), slightly more than adult women aged 25 and older were (56%) (Chart 12). These findings were similar for females in the South (data not shown).
In addition to differences seen across age groups, the type of victim-accused relationship varied depending on the sex of the victim. Compared with boys aged 11 and younger who were victims of a violent crime in the North, girls in the North were more often related to their assailant as immediate or extended family members (excluding parents) (30% versus 14%) (Chart 12; Chart 13). For victims approaching their teenage years, young girls and boys aged 12 to 17 were both most commonly victimized by a casual acquaintance (32% versus 47%), but girls were victimized far more often by an intimate partner (24% versus 5%). The same latter finding was true for young and older adult women and men, as the majority of perpetrators of violence against women 18 years and older in the North were intimate partners, while this was less frequently the case for men, who were instead more commonly victimized by a casual acquaintance.
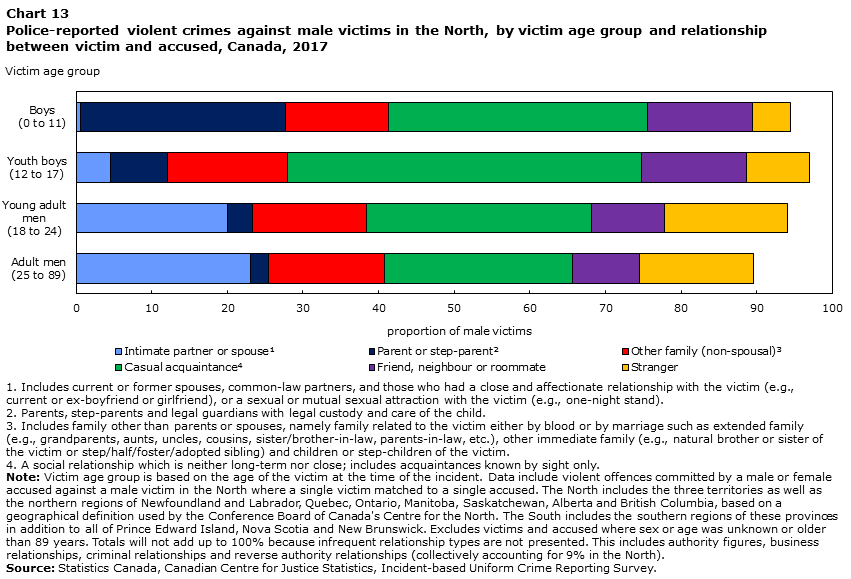
Data table for Chart 13
| Victim age group | ||||
|---|---|---|---|---|
| Adult men (25 to 89) | Young adult men (18 to 24) | Youth boys (12 to 17) | Boys (0 to 11) | |
| proportion of male victims | ||||
| Intimate partner or spouseData table Note 1 | 23 | 20 | 5 | 1 |
| Parent or step-parentData table Note 2 | 2 | 3 | 8 | 27 |
| Other family (non-spousal)Data table Note 3 | 15 | 15 | 16 | 14 |
| Casual acquaintanceData table Note 4 | 25 | 30 | 47 | 34 |
| Friend, neighbour or roommate | 9 | 10 | 14 | 14 |
| Stranger | 15 | 16 | 8 | 5 |
Source: Statistics Canada, Canadian Centre for Justice Statistics, Incident-based Uniform Crime Reporting Survey. |
||||
Violent crimes against young women and girls came to the attention of police sooner in the North than in the South
The time between when a crime occurs and when it is brought to the attention of police can be a crucial investigational challenge that has implications on justice outcomes. Long delays in reporting a violent crime to police have been associated with a lower likelihood of going to court and a lower chance of criminal conviction (Rotenberg 2017b). In 2017, among violent crimes against young women and girls in the North that were brought to the attention of police and founded as a crime, they tended to be reported to police sooner after they occurred than they were in the South.
In the North, four-in-five (80%) violent crimes were reported to police on the same day the crime took place, compared with just over two-thirds (71%) in the South (Chart 14).Note It is important to note that, given the familiarity of residents in smaller communities with one-another, more crimes may come to the attention of police in the North as a result. Also, as the findings from this study have shown, violent crimes committed against young women and girls in the North that are reported to police tend to be more serious and more severe in nature than those reported in the South, which may influence shorter reporting delays. In addition, a delay in reporting is not necessarily a reflection of the victim choosing to wait to report the incident to police—rather, bringing a crime to the attention of police can be done by any party, including the victim, a parent or guardian, or a third party.

Data table for Chart 14
| Time between when incident took place and when it was reported to police: | Offence type | |||||||
|---|---|---|---|---|---|---|---|---|
| Physical assault offencesData table Note 1 | Sexual offencesData table Note 2 | Criminal harassment and uttering threatsData table Note 3 | Violent offences overall | |||||
| North | South | North | South | North | South | North | South | |
| proportion | ||||||||
| Same day | 90 | 83 | 52 | 46 | 85 | 77 | 80 | 71 |
| Next day to one week later | 7 | 12 | 15 | 19 | 12 | 17 | 10 | 15 |
| Over one week to three months later | 2 | 4 | 12 | 14 | 2 | 5 | 4 | 7 |
| Over three months to one year later | 0.4 | 1 | 6 | 7 | 1 | 1 | 2 | 3 |
| More than one year later | 0.4 | 1 | 16 | 15 | 0.2 | 1 | 4 | 5 |
Source: Statistics Canada, Canadian Centre for Justice Statistics, Incident-based Uniform Crime Reporting Survey. |
||||||||
Delay in reporting a crime to police also varies greatly depending on the nature of the crime and the relationship between the perpetrator and the victim. As is consistent with other research (Rotenberg 2017a), sexual offences against young women and girls had the longest delays in reporting, whether in the North or the South, as did those involving family members, while shorter delays in reporting were seen for physical assault offences. Although the North had proportionally more physical assault-related offences than the South (63% versus 47%), the higher proportion of same-day reporting among young women and girl victims of violent crime in the North was not driven by more physical assaults. Rather, more violent crimes were brought to the attention of police in the North on the same day they occurred regardless of the offence type (Chart 14).
Around half (52%) of sexual offences against young women and girls in the North were reported to police on the same day they took place, compared with just under half (46%) for young females in the South. However, of sexual offences reported later than the day of, the median delay in reporting was nearly twice as long for female victims in the North (57.5 days) than for female victims in the South (33 days). This gap may be driven in part by the increased rates of sexual offences at the hands of a family member, particularly extended family members, among young women and girls in the North. More than one-third (35%) of sexual offences against young females in the North committed by a family member were reported to police over one month after the incident, compared with just under one-quarter (23%) of those involving a perpetrator who was not related to the victim (data not shown). The significant psychological barriers to reporting one’s sexual victimization at the hands of a family member to authorities are well established in the literature (Felson and Paré 2005; London et al. 2008).
Police more likely to identify accused in violent crimes against young women and girls in the North than in the South
In 2017, young female victims of violent police-reported crime were far more likely to see their accused identified by police in connection with the crime in the North than in the South (81% versus 68%) (Chart 15). This may be explained as a product of the realities of smaller communities where victims more often know their assailant, which can make it easier for police to identify an accused. This North/South gap was also observed among male victims, as young male victims of violent crime were more likely to see their accused identified by police in the North (79%) than were young male victims in the South (62%) (data not shown).

Data table for Chart 15
| North | South | |
|---|---|---|
| percent | ||
| Accused identified in connection with incident | 81 | 68 |
| Charged or charge recommended | 57 | 48 |
| Incident cleared otherwise | 25 | 20 |
| Victim requested no further actionData table Note 1 | 59 | 36 |
| Departmental discretion | 23 | 32 |
| Accused under age 12 or referral to diversionary program | 9 | 9 |
| Beyond control of department | 7 | 20 |
| OtherData table Note 2 | 2 | 4 |
| Accused not identified in connection with incident; incident not cleared | 19 | 32 |
Source: Statistics Canada, Canadian Centre for Justice Statistics, Incident-based Uniform Crime Reporting Survey. |
||
When an accused was identified, violent crimes against young women in the North and South were equally likely to result in a criminal charge
According to 2017 police-reported violent crimes where an accused was identified by police, there was no difference in the proportion of criminal charges laidNote in incidents involving young female victims in the North compared with those in the South (69% versus 70%).
Charge rates varied depending on the nature and characteristics of the crime and the parties involved. The proportion of violent crimes against a young female in the North that resulted in a criminal charge tended to be lower when: the victim was a child under 12 years old; the offence was criminal harassment or threat-related; there was a delay of over one year in reporting the crime to police; the victim did not suffer a physical injury; no weapons were present during the crime; the incident took place on school property, in a bar or restaurant, in an open area, in northern Quebec,Note in the Yukon, or in southern Quebec; or the accused was female, a youth offender between 12 and 17 years old, a casual acquaintance, a friend, neighbour, or roommate, or related to the victim, particularly as a sibling (data not shown).
When an accused is identified in connection with a crime but not criminally charged, the case can be cleared by police for a number of reasons. Among violent crimes committed against a young female that were cleared otherwise, the most common reason for clearing without a criminal charge in the North was due to the victim requesting that no further action be takenNote (59%), which was much higher than in the South (36%) (Chart 15). This may again be driven in part by the degree of familiarly and nature of the relationship between the victim and their assailant.
There are a number of reasons why victims may request that no further action be taken in a criminal case against their assailant, including: fear of retribution by the offender, not believing the offence was serious enough, a belief that evidence against the accused would be insufficient, not wanting to participate in an ongoing investigation, ongoing stress and emotional trauma related to the violence and having to recount the details of the crime throughout the judicial process, having a pre-existing close or family relationship with the offender, and, for parents of younger victims, opting out of pursuing the case on their child’s behalf in effort to protect them from further stress (Dawson and Dinovitzer 2001; Parkinson et al. 2002). Some of these reasons may be even more relevant in remote northern communities where avoiding the assailant among others who may be aware of the case may be more difficult.
For young female victims in the North, victims requesting that no further action be taken was more common for criminal harassment or threat-related offences (25%), violence that involved an accused who was related to the victim (33%), crimes that did not result in physical injury to the victim (21%), or crimes that took place in northern Manitoba (25%), northern Quebec (22%)Note or the territories (27%), specifically the Northwest Territories (34%) (data not shown).
While these data are limited to charges laid or recommended at the police level and not a reflection of charge outcomes in criminal court, other research, specifically on sexual assault attrition rates, has found that the proportion of charged cases going to court in the territories is typically higher in the Yukon than the Canadian average, but lower in the Northwest Territories and Nunavut (Rotenberg 2017b). However, of sexual assaults that went to court, conviction rates were notably higher in all three territories compared with the southern provinces (Rotenberg 2017b).
Homicides in the North
North/South homicide rate gap widest for young women and girls aged 24 and younger
From 2009 to 2017, there were 74 young women and girls in the North who had been the victim of a police-reported homicide.Note Overall, 14% of all female homicide victims in Canada were killed in the North, over one-third (37%) of whom were aged 24 and younger. For reference, in 2017, 6% of all females in Canada resided in the North, less than one-third (31%) of whom were aged 24 and younger.Note
Compared with the South, a higher proportion of young victims of homicides from 2009 to 2017 in the North were female (31% versus 24%). On average, homicide rates for young women and girls were more than three (3.4x) times higher in the North than in the South (Chart 16). Adult women, young men and boys, and adult men in the North also had a higher homicide rate than their southern counterparts, though the North/South gap was not as wide.

Data table for Chart 16
| Victim sex and age group | North | South | Gap in rate |
|---|---|---|---|
| rate per 100,000 population | |||
| Young women and girls (0 to 24) | 2.36 | 0.70 | 3.4 |
| Adult women (25 to 89) | 1.89 | 0.88 | 2.1 |
| Young men and boys (0 to 24) | 4.92 | 2.14 | 2.3 |
| Adult men (25 to 89) | 5.90 | 2.17 | 2.7 |
|
Note: Victim age group is based on the age of the victim at the time of the incident. Rates are calculated on the basis of 100,000 population. Populations are based upon July 1st estimates from Statistics Canada, Demography Division. Rates represent the average rate across a nine-year period between 2009 and 2017. The rate gap represents how many times greater the homicide rate was in the North compared with the South, for a given victim sex and age group. The North includes the three territories as well as the northern regions of Newfoundland and Labrador, Quebec, Ontario, Manitoba, Saskatchewan, Alberta and British Columbia, based on a geographical definition used by the Conference Board of Canada's Centre for the North. The South includes the southern regions of these provinces in addition to all of Prince Edward Island, Nova Scotia and New Brunswick. Excludes victims where sex or age was unknown or older than 89 years. Source: Statistics Canada, Canadian Centre for Justice Statistics, Homicide Survey. |
|||
When broken down further by age group, teenage girls aged 12 to 17 had the widest North/South disparity with a homicide rate close to seven (6.6x) times higher in the North (3.18 victims per 100,000 population) than in the South (0.48). That said, it is important to consider the low baseline figures used in the calculation of these rates when interpreting the findings (see Table 13). Of note, males were victims of homicide at higher rates than females regardless of age group or North/South region, though the gap was smaller among children.
Although Indigenous people represent a minority (5%) of the Canadian population (Statistics Canada 2018), research has consistently found that young Indigenous women and girls are overrepresented among victims of homicide (Conroy 2018; David 2017). A recent report on the national picture of violence against young women and girls found that from 2007 to 2017, one-third (34%) of young female victims of homicide were Aboriginal (Conroy 2018). This proportion was even higher in the North: in the current study, three-in-four (56 victims, or 76%) of the 74 young female victims of homicide in the North were identified as Aboriginal. More specifically, 25 (34%) girls and young women who were victims of homicide in the North were First Nations, 9 (12%) were Inuit, and 1 (1%) was Métis. The remaining 21 (28%) Aboriginal girls and young women were recorded as Aboriginal but it was not known to which identity group they belonged. In the South, one-in-four (25%) young female victims had been identified as Aboriginal (data not shown).Note Note
Four-in-five (81%) homicides of young female victims in the North from 2009 to 2017 resulted in a criminal charge or were recommended for charge by police. The charge rate was slightly lower for young female victims in the South (79%) (data not shown).
For more information related to homicides in the North, see Statistics Canada’s homicide publications which provide data by victim Aboriginal identity (David 2017; Hotton Mahony et al. 2017; Miladinovic and Mulligan 2015) as well as other publications that offer important context on the intersection of gender and Indigenous identity (Dawson et al. 2018; Native Women's Association of Canada 2010; Royal Canadian Mounted Police 2014).
Over half of young female victims of homicide in the North were killed by a male intimate partner or a family member
From 2009 to 2017, the vast majority (87%) of young girls and women in the North who were victims of a solved homicideNote were killed by a male accused, most (60%) of whom were also aged 24 and younger.Note Victims almost always knew the person who killed them, as only 3% of homicides were perpetrated by a stranger (Table 14). Over one-third (38%) of young female victims in the North had been killed by an intimate partner (including current or former spouses), one-quarter (26%) by a casual acquaintance, and another quarter (25%) by a family member.
Compared with young women and girl victims of homicide in the South, female victims in the North were more likely to be killed by someone who: was male (87% versus 74%), aged 24 and younger (62% versus 39%), was known to them (97% versus 90%),Note was their intimate partner (38% versus 32%), had consumed alcohol and/or drugs prior to the crime (86% versus 62%),Note and who had a previous criminal conviction (56% versus 47%)Note (Table 14). Use of an intoxicating substance prior to the homicide was also more common among young female victims in the North than in the South (62% versus 37%) (data not shown).Note Young female victims in the North were also more commonly killed following an argument or quarrel (38% versus 22%),Note and by beating or blows (34% versus 23%)Note (data not shown).
Summary
In 2017, young women and girls aged 24 and younger in the North represented about 7% of the young female population across Canada, but accounted for 17% of all young female victims of police-reported violent crimes. Consequently, young women and girls in the North were victims of violent crimes at three times the rate of their female counterparts in the South. They were also victimized at higher rates than adult women in the North, as well as males of all ages in the North and the South. Said otherwise, young women and girls living in northern Canada are the most at-risk group for violence.
Previous research has established that, when compared with young men and boys, young women and girls are disproportionately victims of violence in Canada overall (Conroy 2018). The present study found that this gap was even wider for young women and girls in the North, where they were victims of violent crime at a rate nearly twice as high than for young males in the North (3,643 versus 2,090 victims per 100,000), compared with a narrower gap in victimization between sexes in the South (1,235 versus 954). Beyond routine provincial and territorial crime reporting which shows that the territories are home to the highest violent crime rates in Canada (Allen 2018; Savage 2019), the North/South geographical breakdown applied in this report revealed that northern Saskatchewan–which is entirely rural–and northern Manitoba had the highest rates of violent crimes against young females, higher than each of the three territories.
Most violent crimes against young women and girls in the North were perpetrated by a man, the vast majority of whom were older than their victim. Perpetrators of violence were almost always someone known to the victim rather than a stranger, most commonly an intimate partner, a casual acquaintance, or a family member, particularly extended family members, which was more common in the North than in the South.
The majority of violent crimes against young women and girls in the North consisted of physical assault-related offences, which contributed to much of the North/South gap in violent crime rate. Young female victims of violent crimes in the North were more likely to suffer a physical injury as a result of the crime compared with those in the South. Although violent crimes against young females in the North were generally more severe and serious in nature, they were typically reported to police sooner and resulted in a criminal charge more often than violent crimes in the South. This was due in part to the fact that the identification of an accused in connection with the crime was far more common in the North. An exception, however, was noted for young female victims of sexual offences who reported at least one day after the crime, where the delay in reporting was twice as long for those in the North than in the South.
It is important to recall that this report includes crimes that come to the attention of and are founded by police. Other research has shown how violent crimes against young women and girls go largely unreported, with around 1 in 10 (11%E) violent incidents experienced by female victims aged 15 to 24 years old reported to the police in 2014 (Conroy 2018; Conroy and Cotter 2017; Sinha 2015). Further, reporting to police may be more of a barrier in the North given the realities of lack of help or assistance for victims (such as victims’ services programs) in rural or remote areas (House of Commons Canada 2019), especially in situations of family or intimate partner violence (Edwards 2014). Coupled with lower confidence in police among Indigenous groups (Cotter 2015), these social and demographic factors should be considered for their role in the underreporting of violent crimes to police. As such, the true incidence of violence against young women and girls in the North is likely far greater than the figures and rates reported by police.
The findings presented in this report echo those of past research studies that highlight the increased prevalence and severity of violent crimes against young women and girls in the more remote and northern areas of Canada. Future research on violent crimes against young women and girls with a particular focus on Indigenous populations would be of additional value in providing insight on trends and characteristics of victims and accused involved in the ongoing social issue of violence against females in these communities.
Start of text box 3
Text box 3
Summary of key differences between young female victims of violent crime in the North and the South
Compared with young women and girls aged 24 and younger in southern Canada, according to police-reported violent crimes in 2017, young women and girls in the North were:
- Nearly three (2.9x) times more likely to be a victim of a police-reported violent crime overall.
- Nearly three-and-a-half (3.4x) times more likely to be a victim of homicide and other offences causing death.
- Nearly four (3.9x) times more likely to be a victim of a physical assault-related offence.
- More than two (2.3x) times more likely to be a victim of a crime of a sexual nature.
- Nearly two (1.9x) times more likely to be a victim of a criminal harassment offence.
- Victims of violent crimes well beyond the peak age of victimization (15 years old), with rates remaining consistently high until their thirties.
Compared with their young female counterparts in the South, a greater proportion of young women and girl victims of police-reported violent crimes in the North:
- Were victimized by someone they knew (95% versus 92%), including a family member (20% versus 16%).
- Had reported the crime to police sooner after it took place (with 80% versus 71% reported on the same day of the crime).
- Had suffered a physical injury (45% versus 32%).
- Had their assailant identified by police in connection with the crime (81% versus 68%) and as a result, a greater proportion saw their accused criminally charged or recommended for charge (57% versus 48%).
- Requested that no further action in pursuance of criminal charges be taken (59% versus 36%, of cases where accused was identified but not charged).
On a geographical level, young women and girls had the highest rates of police-reported violent crimes in:
- Rural areas in the North (5,023 victims per 100,000 population), with a rate over twice (2.1x) that of urban areas in the North (2,354), and over three (3.3x) times that of rural areas in the South (1,526).
- Northern Saskatchewan (13,886), followed by northern Manitoba (9,025). These were between five and six times higher than their respective southern areas, and both notably higher than the territories (7,232).
- Within the territories, the Northwest Territories had the highest rate (8,909), followed by Nunavut (7,491) and Yukon (4,356).
End of text box 3
Detailed data tables
Survey description
Incident-based Uniform Crime Reporting Survey
The Incident-based Uniform Crime Reporting (UCR) Survey collects detailed information on criminal incidents that have come to the attention of, and have been substantiated by, police services in Canada. Information includes characteristics of victims, accused persons and incidents. In 2017, data from police services covered 99% of the population of Canada. The count for a particular year represents incidents reported during that year, regardless of when the incident actually occurred.
One incident can involve multiple offences. In order to ensure comparability, counts are presented based on the most serious offence in the incident as determined by a standard classification rule used by all police services. Counts based on all violations are available upon request.
Victim age is calculated based on the end date of an incident, as reported by the police. Some victims experience violence over a period of time, sometimes years, all of which may be considered by the police to be part of one continuous incident. Information about the number and dates of individual incidents for these victims of continuous violence is not available. Counts represent the number of victims involved in incidents of violence. It is possible that individual victims may have experienced more than one incident, and would therefore be counted more than once here.
Homicide Survey
The Homicide Survey collects detailed information on all homicide that has come to the attention of, and has been substantiated by, police services in Canada. Information includes characteristics of victims, accused persons and incidents. Since 1961 when recording began, coverage for the Homicide Survey has represented 100% of homicide in Canada. The count for a particular year represents homicide reported during that year, regardless of when the homicide actually occurred.
References
Allen, M. (forthcoming). “Crime reported by police serving areas with majority Indigenous populations, 2017.” Juristat. Statistics Canada Catalogue no. 85-002-X.
Allen, M. 2018. "Police-reported crime statistics in Canada, 2017." Juristat. Statistics Canada Catalogue no. 85-002-X.
Allen, M. and K. McCarthy. 2018. “Victims of police-reported violent crime in Canada: National, provincial and territorial fact sheets, 2016.” Statistics Canada Catalogue no. 85-002-X.
Allen, M. and S. Perreault. 2015. "Police-reported crime in Canada's provincial north and territories, 2013." Juristat. Statistics Canada Catalogue no. 85-002-X.
Allen, M. and T. Superle. 2016. "Youth crime in Canada, 2014." Juristat. Statistics Canada Catalogue no. 85-002-X.
Arnow, B. A. 2004. “Relationships between childhood maltreatment, adult health and psychiatric outcomes, and medical utilization.” Journal of Clinical Psychiatry. Vol. 65, no. 12. p. 10-15.
Arriagada, P. 2016. “First Nations, Métis and Inuit Women.” Women in Canada: A Gender-based Statistical Report. Statistics Canada Catalogue no. 89-503-X.
Auditor General of Canada. 2011a. “Northwest Territories Health Programs and Services – 2011.” Department of Health and Social Services. Minister of Public Works and Government Services.
Auditor General of Canada. 2011b. “Yukon Health Programs and Services – 2011.” Department of Health and Social Services. Minister of Public Works and Government Services.
Bombay, A., Matheson, K. and H. Anisman. 2009. “Intergenerational trauma: Convergence of multiple processes among First Nations peoples in Canada.” Journal of Aboriginal Health. p. 6-47.
Bombay, A., Matheson, K. and H. Anisman. 2014. “The intergenerational effects of Indian Residential Schools: Implications for the concept of historical trauma.” Transcultural Psychiatry. Vol. 51. p. 320-338.
Bosick, S. J., Rennison, C. M., Gover, A. R. and M. Dodge. 2012. “Reporting violence to the police: Predictors through the life course.” Journal of Criminal Justice. Vol. 40. p. 441-451.
Boyce, J., Cotter, A. and S. Perreault. 2014. “Police-reported crime statistics in Canada, 2013.” Juristat. Statistics Canada Catalogue no. 85-002-X.
Boyce, J., Rotenberg, C. and M. Karam. 2015. “Mental health and contact with police in Canada, 2012.” Juristat. Statistics Canada Catalogue no. 85-002-X.
Boyce, J. 2016. “Victimization of Aboriginal people in Canada.” Juristat. Statistics Canada Catalogue no. 85-002-X.
Canadian Centre for Justice Statistics. 2018. "Revising the classification of founded and unfounded criminal incidents in the Uniform Crime Reporting Survey." Juristat. Statistics Canada Catalogue no. 85-002-X.
Charron, M., Penney, C. and S. Senécal. 2010. “Police-reported crime in Inuit Nunangat.” Crime and Justice Research Paper Series. Statistics Canada Catalogue no. 85-561-M.
Conference Board of Canada. 2011. Natural Resources Make Canada’s Northwest Very Wealthy, But Northerners Still Falling Behind Compared to South. Centre for the North. Ottawa, Ontario.
Conference Board of Canada. 2014. The Centre for the North: Past, Present, Future. Centre for the North. Ottawa, Ontario.
Conroy, S. 2018. “Police-reported violence against girls and young women in Canada, 2017.” Juristat. Statistics Canada Catalogue no. 85-002-X.
Conroy, S. and A. Cotter. 2017. "Self-reported sexual assault in Canada, 2014." Juristat. Statistics Canada Catalogue no. 85-002-X.
Cotter, A. 2015. “Public confidence in Canadian institutions.” Spotlight on Canadians: Results from the General Social Survey. Statistics Canada Catalogue no. 89-652-X.
Cotter, A. and P. Beaupré. 2014. “Police-reported sexual offences against children and youth in Canada, 2012.” Juristat. Statistics Canada Catalogue no. 85-002-X.
David, J. D. 2017. “Homicide in Canada, 2016.” Juristat. Statistics Canada Catalogue no. 85-002-X.
Dawson, M. and R. Dinovitzer. 2001. “Victim cooperation and the prosecution of domestic violence in a specialized court.” Justice Quarterly. Vol. 18. no. 3. p. 593-622.
Dawson, M., Sutton, S., Carrigan, M. and V. Grand’Maison. 2018. “#CallItFemicide: Understanding gender-related killings of women and girls in Canada 2018.” Canadian Femicide Observatory for Justice and Accountability. (accessed April 21 2019).
Edwards, K. M. 2014. “Intimate partner violence and the rural-urban-suburban divide: Myth or reality? A critical review of the literature.” Trauma, Violence, & Abuse. Vol. 16, no. 3. p. 359-373.
Felson, R. B. and P. P. Paré. 2005. “The reporting of domestic violence and sexual assault by nonstrangers to the police.” Journal of Marriage and Family. Vol. 67. p. 597-610.
Greenland, J. and A. Cotter. 2018. "Unfounded criminal incidents in Canada, 2017." Juristat. Statistics Canada Catalogue no. 85-002-X.
Holmes, C. and S. Hunt. 2017. “Indigenous communities and family violence: Changing the conversation.” National Collaborating Centre for Aboriginal Health. (accessed April 21 2019).
Hotton Mahony, T., Jacob, J. and H. Hobson. 2017. "Women and the criminal justice system." Women in Canada: A Gender-based Statistical Report. Statistics Canada Catalogue no. 89-503-X.
House of Commons Canada, 42nd Parliament, 1st Session. 2019. “Study on crime in rural areas in Canada.” Standing Committee on Public Safety and National Security.
Keighley, K. 2017. “Police-reported crime statistics in Canada, 2016.” Juristat. Statistics Canada Catalogue no. 85-002-X.
Kelly-Scott, K. and K. Smith. 2015. “Aboriginal peoples: Fact sheet for Canada.” Aboriginal Peoples: Fact Sheets. Statistics Canada Catalogue no. 89-656-X.
Klingspohn, D. 2018. “The importance of culture in addressing domestic violence for first nation’s women.” Frontiers in Psychology. Vol. 9, no. 872. p. 1-7.
Kumar, M. 2016. “Lifetime suicidal thoughts among First Nations living off reserve, Métis and Inuit aged 26 to 59: Prevalence and associated characteristics.” Aboriginal People’s Survey, 2012. Statistics Canada Catalogue no. 89-653-X.
London, K., Bruck, M., Wright, D. B. and S. J. Ceci. 2008. “Review of the contemporary literature on how children report sexual abuse to others: Findings, methodological issues, and implications for forensic interviewers.” Memory. Vol. 16, no. 1. p. 29-47.
Miladinovic, Z. and L. Mulligan. 2015. “Homicide in Canada, 2014.” Juristat. Statistics Canada Catalogue no. 85-002-X.
Native Women’s Association of Canada. 2010. What Their Stories Tell Us: Research. Findings from the Sisters in Spirit Initiative. Ottawa, Ontario.
Northern Development Ministers Forum. No date. About Us. (accessed April 21 2019).
Parkinson, P. N., Shrimpton, S., Swanston, H. Y., O-Toole, B. I. and R. K. Oates. 2002. “The process of attrition in child sexual assault cases: A case flow analysis of criminal investigations and prosecutions.” The Australian and New Zealand Journal of Criminology. Vol. 35, no. 3. p. 347-362.
Perreault, S. 2015. “Criminal victimization in Canada, 2014.” Juristat. Statistics Canada Catalogue no. 85-002-X.
Perreault, S. 2019. “Police-reported crime in rural and urban areas in the Canadian provinces, 2017.” Juristat. Statistics Canada Catalogue no. 85-002-X.
Perreault, S. and L. Simpson. 2016. “Criminal victimization in the territories, 2014.” Juristat. Statistics Canada Catalogue no. 85-002-X.
Perreault, S. and T. Hotton Mahony. 2012. “Criminal victimization in the territories, 2009.” Juristat. Statistics Canada. Catalogue no. 85-002-X.
Rotenberg, C. 2017a. “Police-reported sexual assaults in Canada, 2009 to 2014: A statistical profile.” Juristat. Statistics Canada Catalogue no. 85-002-X.
Rotenberg, C. 2017b. “From arrest to conviction: Court outcomes of police-reported sexual assaults in Canada, 2009 to 2014.” Juristat. Statistics Canada Catalogue no. 85-002-X.
Rotenberg, C. and A. Cotter. 2018. “Police-reported sexual assaults in Canada before and after #MeToo, 2016 and 2017.” Juristat. Statistics Canada Catalogue no. 85-002.
Royal Canadian Mounted Police. 2014. Missing and Murdered Aboriginal Women: A National Operational Overview.
Savage. 2019. “Female offenders in Canada, 2017.” Juristat. Statistics Canada Catalogue no. 85-002-X.
Sinha, M. 2015. “Trends in reporting criminal victimization to police, 1999 to 2009.” Juristat. Statistics Canada Catalogue no. 85-002-X.
Springer, K. W., Sheridan, J., Kuo, D. and M. Carnes. 2007. “Long-term physical and mental health consequences of childhood physical abuse: Results from a large population-based sample of men and women.” Child Abuse & Neglect. Vol. 31, no. 5. p. 517-530.
Statistics Canada. 2013a. “Aboriginal Peoples in Canada: First Nations People, Métis and Inuit.” National Household Survey, 2011. Statistics Canada Catalogue no. 99-011-X.
Statistics Canada. 2013b. “NHS Profile, 2011.” National Household Survey, 2011. Statistics Canada Catalogue no. 94-004-XWE.
Statistics Canada. 2017a. “2016 Census of Population.” Statistics Canada Catalogue no. 98-402.
Statistics Canada. 2017b. “Aboriginal peoples in Canada: Key results from the 2016 Census.” The Daily. Statistics Canada Catalogue no. 11-001-X.
Statistics Canada. 2017c. “The housing conditions of Aboriginal people in Canada. Census of Population, 2016.” Catalogue no. 98-200-X.
Statistics Canada. 2018. First Nations People, Métis and Inuit in Canada: Diverse and Growing Populations. Statistics Canada Catalogue no. 89-659-X.
Turner, A. 2016. “Living arrangements of Aboriginal children aged 14 and under.” Insights on Canadian Society. Statistics Canada Catalogue no. 75-006-X.
The Truth and Reconciliation Commission of Canada. 2015. What We Have Learned: Principles of Truth and Reconciliation.
UNICEF. 2014. Hidden in Plain Sight: A Statistical Analysis of Violence Against Children.
United Nations. 1993. Declaration on the Elimination of Violence Against Women.
World Health Organization. 2013. Global and Regional Estimates of Violence Against Women: Prevalence and Health Effects of Intimate Partner Violence and Non-partner Sexual Violence.
- Date modified: