
Police-reported hate crime in Canada, 2017

Archived Content
Information identified as archived is provided for reference, research or recordkeeping purposes. It is not subject to the Government of Canada Web Standards and has not been altered or updated since it was archived. Please "contact us" to request a format other than those available.
by Amelia Armstrong
Highlights
- In 2017, police reported 2,073 criminal incidents in Canada that were motivated by hate, an increase of 47% or 664 more incidents than reported the previous year.
- The increase in the total number of incidents was largely attributable to an increase in police-reported hate crimes motivated by hatred of a religion (+382 incidents) or of a race or ethnicity (+212 incidents). Hate crimes accounted for less than 0.1% of the nearly 1.9 million police-reported crimes in 2017 (excluding traffic offences).
- Between 2016 and 2017, the number of police-reported crimes motivated by hatred of a race or ethnicity increased 32%, from 666 to 878. Much of this increase was a result of more hate crimes targeting the Black (+107 incidents) and Arab and West Asian populations (+30 incidents). Hate crimes targeting the Black population remained one of the most common types of hate crimes (16% of all hate crimes).
- Compared with 2016, the number of police-reported hate crimes motivated by religion rose 83% in 2017, from 460 to 842. Hate crimes against all religions saw increases. Police-reported crimes motivated by hate against the Muslim population rose from 139 incidents to 349 incidents in 2017 (+151%). Hate crimes against the Jewish population continued to rise in 2017, from 221 to 360 incidents (+63%).
- Police-reported hate crimes targeting sexual orientation rose 16% in 2017 to 204 incidents, compared with 176 incidents in 2016.
- The provinces of Ontario (+411 incidents) and Quebec (+162 incidents), and more specifically the census metropolitan areas (CMAs) of Toronto (+229 incidents) and Montréal (+117 incidents), accounted for much of the national increase. Changes in the Toronto CMA were driven by a rise in police-reported hate crimes targeting the Muslim, Black, and Jewish populations. The increase in Montréal was primarily explained by hate crimes against the Muslim and Arab and West Asian populations.
- Based on data from police services that reported incident characteristics of hate crimes, a 64% increase in non-violent hate crimes accounted for much of the national increase. Non-violent hate crimes accounted for 62% of all hate crimes in 2017. The number of non-violent hate crimes grew from 755 to 1,239 incidents, primarily driven by increases in mischief (+378 incidents) and, to a lesser extent, public incitement of hatred (+52 incidents).
- In 2017, a total of 28% of hate crime incidents were solved. These comprised of 17% that were cleared with charges laid against one or more individuals and 11% that were cleared otherwise, meaning an accused was identified but charges were not laid for various reasons. In comparison, among all Criminal Code violations (excluding traffic violations), 40% were solved by police, with 26% cleared by charges laid and 14% cleared otherwise.
- Hate crime targeting sexual orientation (64%), the South Asian (63%) and the Arab and West Asian (60%) populations were more likely to be violent than non-violent, according to data reported from 2010 to 2017. In contrast, police-reported crimes against the Jewish (85%), Black (62%) and Muslim (60%) populations were more likely to be non-violent violations, primarily mischief.
- According to data from 2010 to 2017, police-reported violent hate crimes against Aboriginal (44%) and Muslim (44%) populations were more likely than other hate crimes to involve female victims.
Canada is an increasingly multicultural and diverse country. According to the 2016 census data, 22.3% of Canadians reported being members of a visible minority group, an increase of 3 percentage points since the 2011 National Household Survey.Note Aboriginal people comprised 4.9% of the population in 2016, up from 4.3% in 2011 (Statistics Canada 2013a). The proportion of people who reported religious affiliations other than Christianity has also grown. In 2011, 7.2% of the Canadian population identified as Muslim, Hindu, Sikh or Buddhist compared to 4.9% in 2001.Note The Jewish population has remained stable at 1% (Statistics Canada 2013b).
Canada’s population is expected to become even more multicultural and diverse in the coming decades. The proportion of Canadians who are members of visible minority groups or affiliated with non-Christian religions is expected to increase by 2036. In particular, nearly one in three working-age Canadians (15 to 64 years of age) are expected to be a member of a visible minority group, and the number of Canadians with a non-Christian religion is expected to more than double to between 13% and 16% of the population (Statistics Canada 2017). It is also expected that over half the immigrants in Canada will be of Asian origin (Statistics Canada 2017). South Asian and Chinese populations are expected to continue to be the largest visible minority groups in Canada, but Arab and West Asian populations are expected to grow the fastest over the next two decades (Statistics Canada 2017).
Despite the increase in ethnic diversity in Canada, hate crimes account for a very small proportion of all crime reported by police each year, making up 0.1% of all police-reported crimes. However, the demographic evolution occurring in Canada may increase the potential for more hate crimes (Chongatera 2013; Putnam 2007). As such, an accurate picture of diversity in Canada may help to contextualize information on hate crimes.
In Canada, four specific offences are listed as hate propaganda and hate crimes in the Criminal Code of Canada: advocating genocide; incitement of hatred in a public place that is likely to lead to a breach of the peace [public incitement of hatred]; wilful promotion of hatred, all when directed against an identifiable group, and; mischief motivated by hate in relation to property primarily used for religious worship or certain other kinds of property primarily used by an identifiable group.Note In addition, subparagraph 718.2(a)(i) of the Criminal Code allows for increased penalties when sentencing any criminal offence, such as assault or mischief, where there is evidence that the offence was motivated by bias, prejudice or hatred based on various criteria as set out in that subparagraph. These are also considered hate crimes.Note
Hate crimes target the integral and visible parts of a person’s identity and may affect not only the individual but also a wider circle, potentially creating a community of victims (Office for Democratic Institutions and Human Rights 2018; Perry 2010). As this behaviour affects not just individuals but also their communities and society generally, hate crimes are a focus of social concern in Canada and other countries. As a member of the Office for Democratic Institutions and Human Rights of the Organization for Security and Co-operation in Europe, Canada works with other countries to monitor and combat hate crimes (Office for Democratic Institutions and Human Rights 2014).Note
This Juristat article presents the most recent trends in police-reported hate crime in Canada using data from the Uniform Crime Reporting Survey (see Text box 1). More specifically, this article examines the number of hate crime incidents reported by police in 2017 as well as the characteristics of these incidents, the victims and the accused involved.Note
Production of this article was made possible with funding from the Department of Canadian Heritage. This article is a follow-up to the initial release of the 2017 hate crime statistics in November 2018 (Statistics Canada 2018).
Start of text box 1
Text box 1
Police-reported hate crime statistics
Definition and coverage
The Uniform Crime Reporting (UCR) Survey collects police-reported crimes, including information on hate crimes. Police-reported hate crimes refer to criminal incidents that, upon investigation by police, are found to have been motivated by hatred toward an identifiable group. An incident may be against a person or property and may target race, colour, national or ethnic origin, religion, sexual orientation, gender identity or expression, language, sex, age, or mental or physical disability, among other factors. In addition, there are four specific offences listed as hate propaganda offences or hate crimes in the Criminal Code of Canada: advocating genocide, public incitement of hatred, wilful promotion of hatred, all when directed against an identifiable group and mischief motivated by hate in relation to property primarily used for religious worship that, in late 2017, was expanded to include certain kinds of property primarily used by an identifiable group.
Detailed information about the incidents, such as the type of offence, as well as the characteristics of victims (in violent offences) and accused, were not available from the municipal police service of Saint John for 2017 and the municipal police service of Calgary for 2016. As such, characteristics of hate crime incidents in 2017 were reported by police services that cover 99.4% of the Canadian population, the municipal police services of Saint John and Calgary were excluded from characteristic counts for comparability purposes.
Determination of a hate crime by police
Within the UCR Survey, depending on the level of evidence at the time of the incident, police can record the incident as either a “suspected” or “confirmed” hate-motivated crime. As more information is gathered, incidents are reviewed and verified and their status may be reclassified. This analysis includes crimes that have been confirmed to be or are strongly suspected to be motivated by hate. Suspected hate crimes may include criminal incidents that cannot be confirmed as hate crimes, but for which there is sufficient evidence to suspect that they are motivated by hate, e.g., hate graffiti where no accused has been identified.
It is important to note that victims of hate crimes targeting specific populations are not necessarily members of those specific populations. For example, if someone is assaulted and there is anti-Muslim language, the hate crime will be considered anti-Muslim whether or not the victim is Muslim. The hate crime is classified by the perception of the accused, not by the victim’s characteristics.
Interpretation of police-reported numbers
Police data on hate-motivated crimes include only those incidents that come to the attention of police services and also depend on police services’ level of expertise in identifying crimes motivated by hate. As a result, an increase in numbers may be related to more reporting by the public to the authorities (for example, as a result of outreach by police to communities or heightened sensitivity after high profile events), and/or a result of a true increase in the extent of hate crimes being committed. As with other crimes, self-reported data provide another way of monitoring hate-motivated crimes. According to the 2014 General Social Survey on Canadian’s Safety (Victimization), Canadians self-reported being the victim of over 330,000 criminal incidents that they perceived as being motivated by hate (5% of the total self-reported incidents). Two-thirds of these incidents were not reported to the police (see Text box 2).
Over the past two decades, police services across Canada have continued to advance their identification and reporting of hate crime incidents. Based on publicly available information, as of January 2019, 14 of the 20 largest municipal police services in Canada had dedicated hate crime units or hate crime officers. Moreover, in an effort to try to address the under-reporting of hate crimes, a growing number of non-governmental organizations are developing innovative methods to encourage the reporting of hate. In 2017, for example, the Alberta Hate Crimes Committee (AHCC) launched the StopHateAB.ca website to encourage reporting of hate incidents in order to support strategies that foster a public social environment of justice, equity, and human rights. As such, changes in reporting practices can have an effect on hate crime statistics. It is therefore important to recognize that, according to police services, higher rates of police-reported hate crime in certain jurisdictions may reflect differences or changes in the recognition, reporting and investigation of these incidents by police and community members.
Due to the impact of changes in reporting practices and the variability of hate crime in jurisdictions where numbers are small, changes over time should be interpreted with caution. Because of this variability, some analysis of characteristics of hate crime incidents, victims and accused in this article is based on total hate crimes reported from 2010 to 2017.
End of text box 1
Police-reported hate crime in Canada rose sharply in 2017
After steady but relatively small increases since 2014, police-reported hate crime in Canada rose sharply in 2017, up 47% over the previous year, largely the result of an increase in hate-related property crimes, such as graffiti and vandalism. For the year, police reported 2,073 hate crimes, 664 more than in 2016 amounting to a rate of 5.7 hate crimes per 100,000 population. Higher numbers were seen across most types of hate crime, with incidents targeting the Muslim, Jewish, and Black populations accounting for most of the national increase. These increases were largely in Ontario and Quebec.
Since comparable data became accessible in 2009, the number of police-reported hate crime has ranged from a low of 1,167 incidents in 2013 to a high of 2,073 in 2017. Since 2013, the number of hate crimes has increased every year. On average, there have been approximately 1,437 hate crime incidents reported annually by police since 2009 (Chart 1). Changes over time could reflect differences or changes in the recognition, reporting by victims and investigation of these incidents by police and community members (see Text box 1).
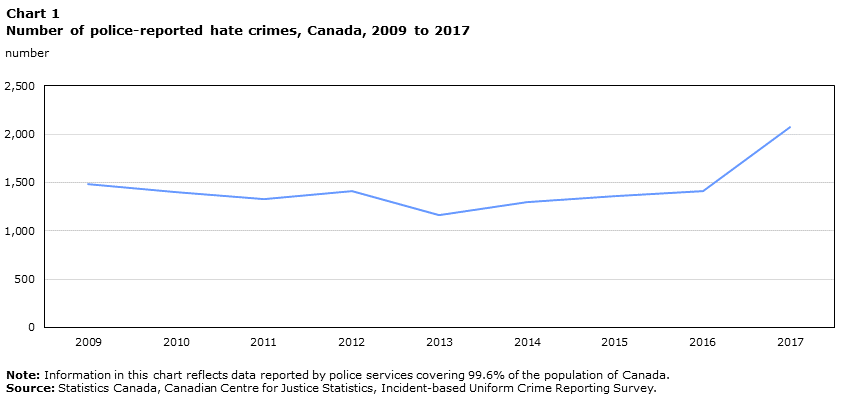
Data table for Chart 1
| Year | Number |
|---|---|
| 2009 | 1,482 |
| 2010 | 1,401 |
| 2011 | 1,332 |
| 2012 | 1,414 |
| 2013 | 1,167 |
| 2014 | 1,295 |
| 2015 | 1,362 |
| 2016 | 1,409 |
| 2017 | 2,073 |
|
Note: Information in this chart reflects data reported by police services covering 99.6% of the population of Canada. Source: Statistics Canada, Canadian Centre for Justice Statistics, Incident-based Uniform Crime Reporting Survey. |
|
In 2017, hate crimes motivated by hatred of a race or ethnicity represented 43% of all hate crimes, followed by those targeting religion (41%) (Table 1). Crimes motivated by hatred of sexual orientation accounted for 10% of hate crimes, with those targeting other factors such as language, disability, age, and sex comprising 6%.
With an increase of 64% from 2016 to 2017, non-violent crimes played a bigger role in the overall rise in hate crimes than did violent crimes. The increase in non-violent hate crimes was driven primarily by a 65% rise in mischief-related offences, from 598 in 2016 to 985 in 2017. There was also a notable increase in the number of incidents of public incitement of hatred, from 69 to 121 incidents. The 25% rise in violent hate crimes was the result of an increase in incidents of uttering threats between 2016 and 2017. Overall in 2017, 38% of hate crimes were violent, down from 44% in 2016 (Table 2).
In 2017, the vast majority (90%) of police-reported hate crimes were offences other than the 4 offences explicitly defined as hate crimes under the Criminal Code. When examining these 4 offences specifically, 6% of hate crimes were public incitement of hatred or wilful promotion of hatred (121 incidents), 4% were mischief in relation to property primarily used for religious worship or by an identifiable group (72 incidents), and fewer than 1% involved advocating genocide (7 incidents) (Table 2).
Overall, the most common type of hate crime was mischief with 985 incidents (49% of all incidents) in 2017, which has remained consistently the most common violation type since 2010. The most common types of violent hate crimes were assault, 299 incidents, and uttering threats, 283 incidents, together accounting for 15% and 14%, respectively, of all hate crimes in 2017 (Chart 2).

Data table for Chart 2
| Most serious violation | Percent |
|---|---|
| Non-violent crime | |
| General mischief | 46 |
| Mischief in relation to property used primarily for worship or by an identifiable groupData table Note 1 | 4 |
| Public incitement of hatred and advocating genocideData table Note 1 | 6 |
| Other non-violent offencesData table Note 2 | 6 |
| Violent crime |
|
| Uttering threats | 14 |
| Common assault (level 1)Data table Note 3 | 10 |
| Assault with a weapon or causing bodily harm (level 2) or aggravated assault (level 3)Data table Note 3 | 5 |
| Criminal harassment | 5 |
| Other violent offencesData table Note 4 | 4 |
Source: Statistics Canada, Canadian Centre for Justice Statistics, Incident-based Uniform Crime Reporting Survey. |
|
Even though a large increase occurred between 2016 and 2017, hate crimes accounted for 0.1% of the over 1.9 million police-reported crimes in 2017 (excluding traffic offences) (Allen 2018).
Start of text box 2
Text box 2
Self-reported victimization data on hate-motivated incidents
Information on self-reported victimization is collected by the General Social Survey (GSS) on Canadian’s Safety (Victimization) every five years. This survey asks a sample of Canadians, aged 15 years and older (in 2014, there were 35,167 respondents questioned) if they had been a victim in the previous 12 months of any of the following offences: sexual assault, robbery, physical assault, break and enter, theft of motor vehicles or parts, theft of household property, theft of personal property and vandalism. If respondents indicate that they had been victimized, they are subsequently asked if they believed that the incident had been motivated by hate and, if so, to state the motivation(s).
It is important to note that data collected by the GSS differ from police-reported data. Information from the GSS is based upon the perceptions of individuals regarding whether or not a crime occurred and what the motivation for the crime may have been. Data on self-reported victimization provide information on incidents that may not have come to the attention of police. Information from police, on the other hand, is based on incidents that have been substantiated through investigation. The police use strict legal criteria to determine whether or not a crime is motivated by hate and to indicate the type of motivation. They also look at information gathered during the investigation and adhere to national guidelines for record classification. Police-reported data also depend on whether victims are willing to report hate crimes to an official body.
Overall, in 5% of all incidents (or 330,913 incidents) reported to the GSS in 2014, victims believed the incident was motivated by hate. Race was the most common motivation for incidents perceived to be motivated by hate, cited by just over half (51%) of victims. Other motivations included sex (26%E), age (19%E), and religion (11%E).Note Information collected by the GSS suggests that the emotional consequences for victims of crimes motivated by hate are greater than for victims of crimes not motivated by hate. In 2014, in roughly 80% of crimes perceived to have been motivated by hate, the victim said the incident had affected them emotionally, compared to 66% of victims of crimes not motivated by hate. The most common emotional reactions to crimes perceived to have been motivated by hate were anger (36%), feeling upset, confused or frustrated (28%) and fear (19%E). Also, for 4 in 10 crimes perceived to have been motivated by hate, the victim stated that they found it difficult or impossible to carry out their everyday activities (e.g., work), more than double the proportion of victims of crimes that had not been motivated by hate.
The financial loss reported by victims of household crime (break and enter, theft of motor vehicles or parts, theft of household property and vandalism) also tended to be greater when the incident was perceived to be motivated by hate. In 2014, 27%E of hate-motivated household crimes resulted in a financial loss in excess of $1,000. This compares to 14% of incidents not motivated by hate.
About two-thirds of individuals who said they had been victims of hate-motivated incidents did not report the incidents to the police. Of the victims who did not report the hate crime targeting them, 64% said they did not report it because they thought the police would not have considered the incident important enough. Similarly, 62% felt that the crime was minor and not worth taking the time to report to the police. Another reason, cited by 58% of victims, was the belief that the accused would not be convicted or adequately punished (see Table 3).Note
When people who reported having been victim to a hate crime decided not to report the crime to the police, their reasons for doing so were very different from those of people who were victims of a non-hate crime. A total of 53% of victims of hate crimes said they did not report the crime because they believed the police would not have been effective, compared with 33% of victims of other types of crime. Whereas 58% of victims of hate crimes did not go to the police because they believed the accused would not be convicted or adequately punished, 37% of victims of non-hate crimes gave this reason for not reporting. Lastly, 4 in 10 victims of hate crimes (40%) did not report the crime because they either feared the court process or did not want the hassle of dealing with the courts process, compared with 25% of victims of non-hate crimes (see Table 3).
End of text box 2
Increases driven by reported hate crimes in Ontario and Quebec
Among the provinces, the greatest increase in the overall number of police-reported hate crimes was observed in Ontario, Canada's most populous province, where incidents rose from 612 in 2016 to 1,023 in 2017 (+67%) (Table 4). This increase was largely tied to more hate crimes targeting the Muslim (+207%), Black (+84%) and Jewish (+41%) populations.
Quebec reported a 50% year over year increase in hate crimes, rising from 327 to 489 (Table 4). The increase was the result of crimes against the Muslim population, which almost tripled from 41 in 2016 to 117 in 2017, which included the January mass shooting at the Islamic Cultural Centre of Québec. Following that incident, reports of hate crimes against Muslims peaked in February and accounted for 26% of Quebec's annual reported incidents targeting Muslims.
Increases in hate crimes were also reported in Alberta and British Columbia. British Columbia reported a 21% increase in police-reported hate crimes, rising from 211 in 2016 to 255 in 2017. This marked the second annual increase in a row (Table 4; Chart 3). The increase was attributable to crimes against the Jewish population, which grew almost fivefold from 14 to 68. The number of police-reported hate crimes in Alberta increased 38% from 139 incidents in 2016 to 192 in 2017, which saw similar movement from 2014 to 2015. The rate of hate crimes changed from 3.3 incidents per 100,000 population in 2016 to 4.5 in 2017 (Chart 3). This change is due to an increase in hate crimes against the Arab and West AsianNote (+15) and Muslim populations (+13).

Data table for Chart 3
| Province | 2016 | 2017 |
|---|---|---|
| rate per 100,000 population | ||
| Canada | 3.9 | 5.7 |
| N.L. | 0.4 | 0.4 |
| P.E.I. | 2.0 | 0.7 |
| N.S. | 2.2 | 2.2 |
| N.B. | 2.4 | 2.9 |
| Que. | 3.9 | 5.8 |
| Ont. | 4.4 | 7.2 |
| Man. | 2.8 | 2.7 |
| Sask. | 2.6 | 1.7 |
| Alta. | 3.3 | 4.5 |
| B.C. | 4.4 | 5.3 |
|
Note: Information in this chart reflects data reported by police services covering 99.6% of the population of Canada. Source: Statistics Canada, Canadian Centre for Justice Statistics, Incident-based Uniform Crime Reporting Survey. |
||
Census data show that diversity has increased in all provinces and that the largest proportion of visible minority people live in the three provinces of British Columbia, Ontario, and Alberta (Table 5).
Start of text box 3
Text box 3
Canada’s diverse populations living in the three largest census metropolitan areas
According to the 2016 census, 22.3% of the Canadian population were a member of a visible minority group, compared to 19% in the 2011 National Household Survey. Canada’s visible minority population is most concentrated in the country’s three largest census metropolitan areas (CMAs)—Toronto, Montréal and Vancouver, home to 36% of the total Canadian population. Of the total visible minority population in Canada, 66% lived in these three CMAs in 2016. In that year, more than 5 in 10 people residing in Toronto (51%) and Vancouver (49%) were visible minorities, whereas the same was true for 2 in 10 people residing in Montréal (23%). By 2031, about 6 in 10 individuals living in the CMAs of Toronto (63%) and Vancouver (59%) could be members of a visible minority. In Montréal, the proportion is expected to increase to about 3 in 10 (31%) (Statistics Canada 2010).
Canada’s three largest CMAs are also home to a great majority of Canadians who are members of religious groups that were most frequently targeted in religiously motivated hate crimes. For instance, in 2011, 1% of the Canadian population identified as Jewish, with most (82%) living in Toronto, Montréal or Vancouver. The majority of those identifying as Muslim, who made up 3% of the Canadian population, resided within Toronto, Montréal or Vancouver (68%). Buddhists, Hindus and Sikhs represented 4% of the Canadian population, and the majority resided in the three largest CMAs (74%) (Statistics Canada 2013b). As with visible minority groups, these proportions are expected to increase over the next two decades (Statistics Canada 2010).
In 2011, same-sex couples (both married and common-law) accounted for 1% of all couples in Canada whereas close to half (46%) of these couples resided in Toronto, Montréal, or Vancouver in 2011 (Statistics Canada 2012).
End of text box 3
Toronto and Montréal CMAs posted the largest year over year increases in hate crimes
The vast majority (86%) of police-reported hate crimes in Canada in 2017 occurred in a census metropolitan area (CMA) (Table 6).Note More specifically, 53% of hate crimes occurred in the four largest CMAs (Toronto, Montréal, Vancouver, and Calgary). These CMAs were home to 38% of Canada’s population.Note
The CMAs with the largest increases in hate crimes from 2016 to 2017 were Toronto (+229 incidents) and Montréal (+117) (Table 6; Text box 3). Their increases in hate-motivated crimes were driven by the same factors seen at the national level. Specifically, in Toronto, crimes motivated by hatred of the Muslim (+77 incidents), Black, (+53), and Jewish populations (+49) were the noted increases.
For Montréal, the change observed in 2017 follows the upward trend seen over the past two years. This increase was largely due to more hate crime targeting the Muslim population, increasing from 32 incidents in 2016 to 75 in 2017. Montréal also saw an increase in hate crimes against the Arab and West Asian (+14 incidents) and Jewish (+12) populations.
In addition, Québec experienced a 39% increase in hate crimes, mainly due to an increase in crimes targeting the Muslim population (+27 incidents).
In contrast to this increase in the number of hate crimes in certain CMAs, decreases from 2016 to 2017 were reported in six CMAs. The top three decreases were seen in the CMAs of Victoria (-7 incidents), Regina (-6), and Brantford (-4) (Table 6).
When controlling for the size of the population of each CMA, the CMAs with the highest rates of police-reported hate crime were Thunder Bay, 17.4 hate crimes per 100,000 population, Hamilton, 16.0 hate crimes per 100,000 population, and Guelph, 11.8 hate crimes per 100,000 population (Chart 4; Table 6).Note Of note, all three of these jurisdictions reported year over year increases in hate crimes.

Data table for Chart 4
| Census metropolitan areaData table Note 1 |
Rate per 100,000 population |
|---|---|
| Canada | 5.7 |
| Thunder Bay | 17.4 |
| HamiltonData table Note 2 | 16.0 |
| Guelph | 11.8 |
| Québec | 9.8 |
| Peterborough | 9.5 |
| Kitchener–Cambridge–Waterloo | 9.5 |
| OttawaData table Note 3 | 9.3 |
| TorontoData table Note 4 | 9.1 |
| Kingston | 8.2 |
| Montréal | 7.5 |
| Vancouver | 7.1 |
| Windsor | 5.6 |
| Abbotsford–Mission | 5.2 |
| Calgary | 5.2 |
| London | 5.0 |
| Sherbrooke | 4.9 |
| Edmonton | 4.7 |
| St. Catharines–Niagara | 4.6 |
| Barrie | 4.5 |
| Moncton | 4.4 |
| GatineauData table Note 5 | 4.2 |
| Victoria | 2.6 |
| Trois-Rivières | 2.5 |
| Halifax | 2.5 |
| Saguenay | 2.4 |
| Winnipeg | 2.3 |
| Regina | 2.0 |
| Saskatoon | 1.5 |
| Greater Sudbury | 1.2 |
| Kelowna | 1.0 |
| Saint John | 0.8 |
| Brantford | 0.7 |
| St. John's | 0.5 |
|
|
Thunder Bay, despite having a high hate crime rate (17.4 hate crimes per 100,000 population), had a relatively low number of hate crimes in 2017 (21 incidents). These hate crimes targeted the Aboriginal and Jewish population, making up a third of police-reported incidents in each. In Hamilton, of the 91 hate crimes reported in 2017, 30% targeted the Black population and 25% the Jewish population.Note Like Thunder Bay, Guelph had a moderately low number of hate crimes in comparison to their high hate crime rate (11.8 hate crimes per 100,000 population), at 16 incidents in 2017.
Police-reported hate crimes motivated by hatred of a race or ethnicity increased, driven by incidents targeting Black and Arab and West Asian populations
In 2017, 43% of all police-reported hate crime was motivated by hatred of a race or ethnicity. Police reported 878 crimes motivated by hatred of race or ethnicity, up 32% from the previous year (Table 1; Chart 5). This increase was the result of 107 more hate crimes targeting the Black population (+50%) and 30 more incidents targeting the Arab and West Asian population (Table 1; Chart 6).Note
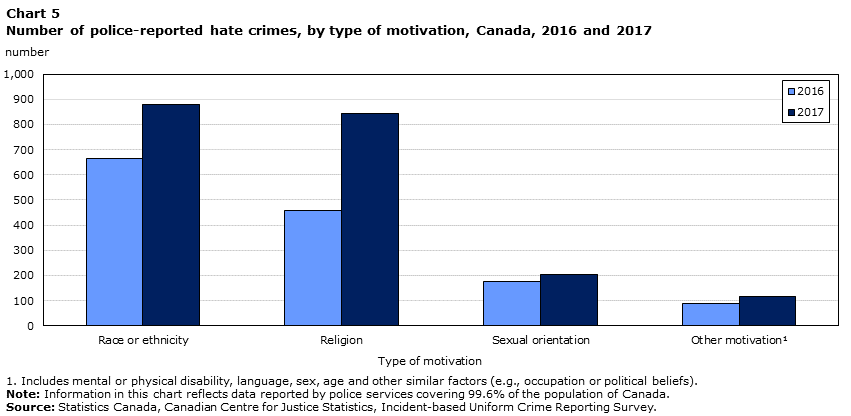
Data table for Chart 5
| Type of motivation | 2016 | 2017 |
|---|---|---|
| number | ||
| Race or ethnicity | 666 | 878 |
| Religion | 460 | 842 |
| Sexual orientation | 176 | 204 |
| Other motivationData table Note 1 | 88 | 117 |
Source: Statistics Canada, Canadian Centre for Justice Statistics, Incident-based Uniform Crime Reporting Survey. |
||
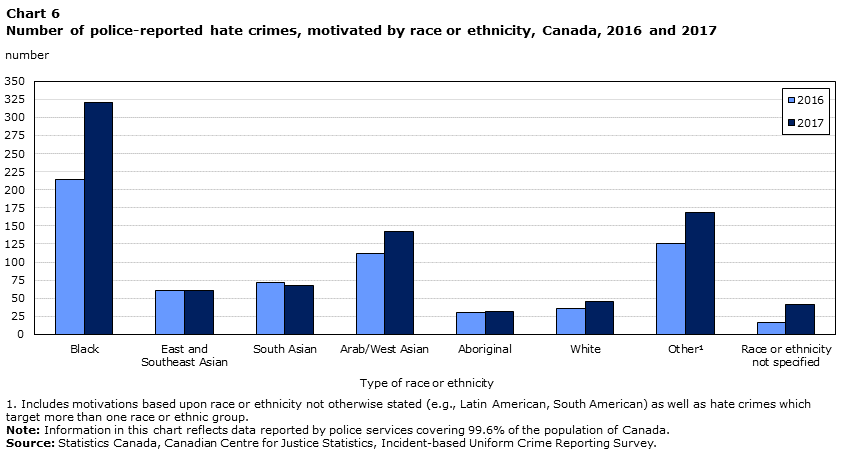
Data table for Chart 6
| Type of race or ethnicity | 2016 | 2017 |
|---|---|---|
| number | ||
| Black | 214 | 321 |
| East and Southeast Asian | 61 | 61 |
| South Asian | 72 | 67 |
| Arab/West Asian | 112 | 142 |
| Aboriginal | 30 | 31 |
| White | 36 | 46 |
| OtherData table Note 1 | 125 | 169 |
| Race or ethnicity not specified | 16 | 41 |
Source: Statistics Canada, Canadian Centre for Justice Statistics, Incident-based Uniform Crime Reporting Survey. |
||
In 2017, police in Canada reported 321 incidents motivated by hatred against the Black population. This represented 37% of all hate crimes targeting race or ethnicity and 16% of all hate crimes in 2017. As a result there were approximately 26.8 incidents per 100,000 members of the Black population.Note The Black population was also the third most commonly targeted group overall for 2017. Ontario (+89) accounted for most of the increase in crimes against the Black population.
Hate crimes against the Arab and West Asian population has grown each year since 2013
In 2017, there were 142 hate crimes specifically targeting the Arab and West Asian population.Note This represents approximately 18.0 hate crimes per 100,000 members of the Arab and West Asian population in Canada (see note 15).
The number of police-reported hate crimes against the Arab and West Asian population has grown each year since 2013. While 48 incidents targeting the Arab and West Asian population were recorded in 2013, this number rose steadily to reach 142 in 2017, marking an increase of 196% since 2013. Hate crimes targeting the Arab and West Asian population accounted for 16% of hate crimes targeting a race or ethnicity and 7% of all hate crimes in 2017 (Table 1).
Alberta reported 15 more hate crimes against the Arab and West Asian population (15 incidents in 2016 to 30 in 2017), with Quebec following closely behind, reporting 14 more (41 in 2016 to 55 in 2017).
Hate crimes against Aboriginal peoples continues to account for relatively few hate crimes
Incidents against Indigenous peoples – including those who are First Nations, Métis, or Inuit – account for a relatively small proportion of police-reported hate crimes (2%) (Table 1). The number of hate crimes targeting the Aboriginal population increased from 30 in 2016 to 31 in 2017. This represented 2.0 hate crimes per 100,000 Aboriginal people in Canada in 2017 (see note 15).
In comparison, there were 67 hate crimes targeting the South Asian populationNote in Canada, representing 3.5 hate crimes per 100,000 South Asians. There were also 61 police-reported hate crimes targeting the East or Southeast Asian population,Note amounting to 2.1 incidents per 100,000 East or Southeast Asians (see note 15).
Start of text box 4
Text box 4
Initiatives to address and prevent hate crime in Canada
In an effort to address and prevent hate crime and provide reporting alternatives other than police, a number of governmental and non-governmental initiatives have been developed. These initiatives range from community-based outreach by police to creating websites for people to report hate crimes and non-criminal hate incidents online.
Many of the police services that serve large cities, such as Toronto or Edmonton, have specialized hate crime units. These specialized units are composed of officers and/or civilians that have special training in crimes motivated by hate. Specialized hate crime units help to provide support to front line officers, do hate crime specific investigative work, educate other police officers and the community, and provide outreach to effected communities (Edmonton Police Service 2018; York Regional Police 2018). Alongside the hate crime units, some police services, such as Ottawa Police Service, allow hate crimes to be reported online, while other police services, such as Le Service de police de la Ville de Montréal, allow non-criminal hate incidents to be reported online.
Many cities also have local anti-racism or anti-hate committees that work with police to address issues of hate in their communities. These include, for example, the Thunder Bay Anti-Racism and Respect Advisory Committee, the Hamilton Committee against Racism, and the Peterborough Community Race Relations Committee. These groups may also help encourage the reporting of hate crime.
Non-governmental organizations (NGOs) play a role in addressing and preventing hate crime. Organizations such as the Alberta Hate Crimes Committee and Stop Racism and Hate Canada have spaces on their websites for the public to report hate incidents, including both actual crimes and non-criminal incidents that involve bias or prejudice.Note NGOs also raise awareness by providing online educational courses for secondary students and workshops for professionals to teach about multiculturalism and human rights in Canada and how to work positively in a multicultural environment.
Provincial governments have launched various initiatives and legislative actions to address hate crime and aid in combatting purveyors of hate crime. The provinces of Ontario, Quebec, and most recently British Columbia, have all enacted legislation that help to protect anti-hate groups from strategic lawsuits against public participation (SLAPP). SLAPP lawsuits are generally used to intimidate and silence critics by piling legal costs onto the defendant until they abandon their oppositional position (Ontario Ministry of the Attorney General 2010). In the context of hate motivated actions, anti-SLAPP legislation helps to shield anti-hate groups and allow them to freely confront persons espousing hateful rhetoric or producing and displaying hate-related propaganda.
British Columbia also created a provincial hate crime team in the mid-1990s which is mandated to address the identification, investigation, and prosecution of hate crimes in British Columbia (British Columbia Ministry of the Attorney General 2008). The British Columbia hate crime team also acts as a support for the hate crime units that exist within British Columbia’s various police services. Furthermore, the provincial government of British Columbia launched a website to give residents access to information about what hate crimes are, how they can present on the internet, the consequences of hate crime, as well as how to report hate crimes in the province, all in one area (HateCrimeBC 2018).
End of text box 4
Increase in the number of crimes targeting a religious group, driven by more anti-Semitic and anti-Islamic crimes
According to the 2011 National Household Survey, the increased ethno-cultural diversity in Canada has been paralleled by an increase in the proportion of people who reported religious affiliations other than Christianity. In 2011, 7.2% of the Canadian population reported that they were Muslim, Hindu, Sikh or Buddhist, compared to 4.9% in 2001 (Statistics Canada 2013b; Table 5). The Jewish population has remained stable at 1%. Two-thirds (67.3%) of the Canadian population reported affiliation with a Christian religion. Almost one-quarter (23.9%) of Canadians reported no religious affiliation, compared to 16.5% in 2001.
The majority of Canadians who reported non-Christian religions were also members of a visible minority group, with one exception. The exception was for those who were Jewish, among whom 2% were members of a visible minority group. In 2011, 88% of Muslims and 97% of Buddhists, Hindus and Sikhs residing in Canada were also members of a visible minority group (Statistics Canada 2013b).Note The overlap between race or ethnicity and religion may have an impact on hate crime statistics, as some religious populations or communities may also be targeted in hate crimes motivated by race or ethnicity. When a hate crime incident involves or appears to involve more than one motivation (e.g., religion and race or ethnicity), the incident is reported by the police only once according to the primary motivation determined by the circumstances of the incident.
In 2017, 842 hate crimes targeting religion were reported by police, an increase of 83% compared with 2016 (Table 1; Chart 5). For this type of hate crime, the Jewish and Muslim populations were the most frequent targets, accounting for 43% and 41% of crimes against a religion, respectively. In total, 18% of all hate crimes were anti-Jewish and 17% were against the Muslim population.
Following a decrease in hate crimes against the Muslim population in 2016, police reported 210 more in 2017 for a total of 349, marking an increase of 151% (Chart 7). The increase in police-reported hate crimes against Muslims was the result of more reported incidents in Ontario (+124) and Quebec (+76).

Data table for Chart 7
| Type of religion | 2016 | 2017 |
|---|---|---|
| number | ||
| Jewish | 221 | 360 |
| Muslim | 139 | 349 |
| Catholic | 27 | 39 |
| Other religionData table Note 1 | 37 | 57 |
| Unknown religion | 36 | 37 |
Source: Statistics Canada, Canadian Centre for Justice Statistics, Incident-based Uniform Crime Reporting Survey. |
||
From 2016 to 2017, the number of incidents targeting the Jewish population increased by 63%, from 221 to 360 incidents.
Increase in crimes motivated by hatred of sexual orientation
Sexual orientation defines to whom a person is physically and romantically attracted. In the police reported data, a hate crime can be reported as being motivated by the hatred of a heterosexual, homosexual, bisexual, or other sexual orientation. This category does not include crimes motivated by hatred towards transgender individuals, as those are collected under sex or gender identity. That being said, some victims of hate crimes based on sexual orientation may be transgender individuals targeted because of their perceived sexual orientation.
In 2017, police reported 204 hate crimes targeting sexual orientation, marking an increase of 16% compared to the previous year (Table 1). The increase in incidents between 2016 and 2017 was greatest in the provinces of Ontario (+38) and Quebec (+15) (Table 4). This was tempered by 18 less hate crimes targeting sexual orientation in British Columbia, decreasing from 36 incidents in 2016 to 18 in 2017.
Crimes motivated by hatred of a sexual orientation made up 10% of all police-reported hate crimes in 2017. The vast majority (85%) of these crimes specifically targeted the gay and lesbian community.
Police-reported hate crimes motivated by hatred of a gender expression or identity
From 2010 to 2017, 31 hate crimes targeting transgender or asexual people were reported by police participating in the Uniform Crime Reporting Survey (version 2.2). Of these crimes, nearly half (15 incidents) occurred in 2017 alone. Even though the overall number is small relative to other hate crimes, those targeting transgender or asexual people were more often violent, with 74% of incidents involving a violent violation.
In June 2017, Bill C-16 was adopted. This Bill formally recognizes protection for gender expression and identity under the Canadian Human Rights Act and the Criminal Code of Canada.
Over one-quarter of violent hate crimes were cleared
In 2017, a total of 28% of hate crime incidents were cleared (meaning solved). Specifically of the incidents cleared, 61% resulted in charges laid against one or more individuals and 39% were cleared otherwise, meaning an accused was identified but a charge was not laid. In most incidents cleared otherwise in 2017, charges were not laid due to departmental discretion (including the use of warnings and cautions) or because the complainant declined to proceed with charges. The clearance rate for non-violent hate crimes was far lower than the rate for violent hate crime (14% versus 50%). This is primarily due to very low clearance rates for mischief where it is difficult to identify a perpetrator.
That year, 9% of hate-motivated mischief incidents, the most common type of non-violent hate crime, were cleared compared to 27% of mischiefs that were not hate-motivated. Of these cleared incidents, 65% resulted in the laying of charges in hate-motivated mischief, a larger proportion compared to the 22% of non-hate motivated mischiefs.
For common assault, another frequent type of hate crime, clearance rates were lower for hate-motivated assaults (47%) compared to non-hate motivated common assaults (76%). Moreover, of those incidents cleared 68% of hate-related common assaults were cleared by charge, not dissimilar to the 62% of non-hate motivated incidents.
Hate crimes targeting religions, which are most often mischief, were less likely to be cleared. Once cleared, hate crimes based on race or ethnicity were more likely to result in a charge compared with other types of hate crimes.
Given the annual counts of hate-motivated crimes can be relatively small, the following sections on police-reported hate crime are based on detailed incidents from 2010 to 2017 in order to provide information on the characteristics of incidents, victims and accused persons.
Hate crime targeting sexual orientation, the South Asian, and Arab and West Asian populations more often violent
Between 2010 and 2017, the majority of police-reported hate crimes targeting sexual orientation (64%), the South Asian (63%), and Arab and West Asian (60%) populations were violent. Violent crimes targeting sexual orientation included common assault (23%),Note uttering threats (14%), assault with a weapon or causing bodily harm (10%), and criminal harassment (9%). Violent incidents targeting the South Asian and Arab and West Asian populations tended to be common assault 27% and 24%.
Over half (54%) of hate crimes targeting the East or Southeast Asian population were violent and 46% non-violent, with the most common being common assault (25%), or uttering threats (13%). Similarly, 53% of hate crime targeting Aboriginal people were violent, yet these tended to involve offences beyond common assault (16%), including assault with a weapon or causing bodily harm (11%), and uttering threats (11%).
For all types of hate crimes, mischief accounted for the largest proportion of non-violent hate crimes.
Hate crimes targeting the Black population and religion more often non-violent
Non-violent crimes accounted for 62% of crimes targeting the Black population from 2010 to 2017. A significant portion (53%) of these non-violent crimes were mischief. Non-violent crimes most often occurred in a single-family home (18% of incidents), in schools outside of school hours (14%), and on the street (14%). Of the 38% of hate crime targeting the Black population that were violent crimes, common assault was the most common type (14%). One quarter of violent hate crimes targeting the Black population took place on the street, 16% in a single-family home and 12% in a dwelling unit.
During the same period, 60% of crimes against the Muslim population were non-violent while the other 40% were violent. The most common violent hate crimes were uttering threats (18%) and common assault (8%) (see note 20). The most frequent locations of violent incidents were the street (19%) or at a single-family home (17%). The most frequent non-violent crimes were mischief (35%) and public incitement of hatred (9%). Non-violent crimes targeting the Muslim population occurred most often at religious institutions (17%).
From 2010 to 2017, 85% of hate crimes against the Jewish population were non-violent. The majority of these hate crimes were mischief (70%). The second and third most frequent offences against this population were uttering threats (6%) and hate-motivated mischief relating to property primarily used for religious worship or by an identifiable group (5%). While a notable proportion of non-violent hate crimes targeting the Jewish population occurred at a single-family home (18%), on the street (13%), or in schools outside of school hours (11%). Violent crimes most often occurred in a single family home (21%), businesses (17%), or on the street (15%).
Hate crimes typically occur in open areas and at residences
Where violent hate crimes occur is similar across the various types of police-reported hate crimes. Violent hate crimes targeting race/ethnicity tended to occur in open areas (37%), followed by residences (25%), commercial businesses (20%), educational institutions (7%) and other institutions (6%) (Table 7). Similarly, 40% of violent incidents motivated by hatred of sexual orientation were committed in open areas and 28% at a residence. While hate crimes targeting religion also occurred in these places, an additional 10% occurred at religious institutions.
Compared to violent hate crimes, non-violent hate crimes targeting race/ethnicity and religions, which are largely mischief offences, occurred more often at educational and religious institutions. For instance, 16% of non-violent crimes targeting race/ethnicity occurred at an educational institution (Table 7). For non-violent crimes targeting religion, 21% occurred at religious institutions, 14% at educational institutions and another 9% at other institutions, such as public buildings and centres. In contrast, non-violent crimes targeting sexual orientation occurred far more often at a residence (42%) than anywhere else.
Uttering threats the most common type of cyber hate crime
The internet provides a platform for equal communication of beliefs and opinions by all users. Of the 364 police-reported hate crimes that were also recorded by police as cybercrimes between 2010 and 2017,Note these most commonly targeted the Muslim population (17%), sexual orientation (15%), the Jewish population (14%), and the Black population (10%). Over the same eight year period, uttering threats (35%) was by far the most common type of hate-motivated cybercrime, followed by public incitement of hatred (18%), criminal harassment (15%), and indecent or harassing communications (12%). In comparison, these offences accounted for far fewer among non-cyber hate crimes. Of all the hate-motivated offences of uttering threats, 11% were reported as cybercrimes.
Half (50%) of cyber hate incidents of uttering threats were cleared by charge or cleared otherwise by police, a solve-rate that is slightly lower than non-cyber hate incidents of uttering threats (54%).
Start of text box 5
Text box 5
Hate crime and extremism
Both hate crimes and right-wing extremism are motivated by intense hate of perceived or real differences between themselves and others, be it race, religion, gender, sexual orientation, or other identity (Perry and Scrivens 2017; Stevkovski 2015). Unlike hate crime, there is no Criminal Code definition of extremism. Public Safety Canada defines violent extremism as “a term describing the beliefs and actions of people who support or use violence to achieve extreme ideological, religious or political goals” (Public Safety Canada 2018a). According to recent Canadian research, that there are at minimum 130 active right-wing extremist groups across Canada (Perry and Scrivens 2016).
During a period of two weeks in September 2018, the company Moonshot CVE (Countering Violent Extremism) tracked a total of 5,214 far-right searches conducted in Canada (Boutilier 2018). Over half of these searches (55%) were focused on neo-Nazi websites and 33% on white supremacist websites, with search terms including neo-Nazi phrases and code words, extreme right bands and white supremacist imagery. Moonshot found that Ontario had the highest rate of far-right searches in Canada with almost 18 searches per 100,000 population (Boutilier 2018).
During 2017/2018, Public Safety Canada worked with Moonshot CVE in the “Canada Redirect” project, the objective of which is to help counter radicalization and provide positive alternative content to anyone searching online for extremist topics and who may be vulnerable to radicalizationNote (Public Safety Canada 2018b). The intention is that the findings from this project will help inform local communities and practitioners about countering radicalization to violence in the online space and help expand the reach and impact of organizations in Canada that are creating positive content that provides an alternative to extremist content.
End of text box 5
Police-reported violent hate crimes against Aboriginal and Muslim populations more likely than other hate crimes to involve female victims
For all types of hate crimes, almost a third of victims reported by police between 2010 and 2017 were female. However, violent incidents targeting the Muslim and Aboriginal populations are more likely than other types of hate crimes to involve female victims. Of all victims of violent hate crimes targeting the Muslim population that were reported to police, 44% were women or girls, as was true for 44% of victims of hate crimes against the Aboriginal population (Table 8). For all other types of hate crimes, female victims accounted for between 18% and 40% of victims.
It is also notable that more than any other type of hate crime, victims of violent hate crime targeting sexual orientation were predominantly male (82%).
Victims of violent hate crimes targeting sexual orientation and the Aboriginal population are the youngest and have highest rate of injury
Each with a median age of 27 years, victims of violent hate crime targeting sexual orientation and the Aboriginal population tend to be the youngest (Table 8). Among the victims of violent hate crimes targeting the Black population, the median age was also relatively young (29). The median age for victims of crimes targeting religion was relatively higher at 37 years. In comparison, the median age of victims of hate crime in general stands at 31 years of age.
Victims of violent hate crimes targeting sexual orientation and Aboriginal peoples were also most likely to have sustained injury. Between 2010 and 2017, 44% of victims of hate crimes targeting the Aboriginal population and 43% of those targeted due to sexual orientation sustained injuries as a result of the incident (Table 8). Overall, victims of violent hate crimes targeting race/ethnicity were more likely to have resulted in injuries than crimes targeting religion.
It should be noted that in 2017, 53% of crimes targeting sexual orientation were violent violations, compared with 24% of hate crimes targeting religion and 47% targeting ethnicity.
Victims of violent hate crimes targeting East and Southeast Asian population and the Muslim population more often to be victimized by strangers
The majority of hate crime victims were victimized by a stranger, with this being most prevalent among victims of violent hate crime targeting the East and Southeast Asian population (82%) and the Muslim population (80%) (Table 8).
Compared to other types of hate crime victims, the prevalence of victimization by someone known to them was highest among victims of hate crimes targeting the Black population (43%) and sexual orientation (41%).
For all victims, where the accused was known to the victims, the vast majority were friends or acquaintancesNote (93%) rather than family.
Persons accused of hate crimes tend to be male and younger
Like crime in general, the vast majority of persons accused of hate crime tend to be male and younger (Table 9). Overall, 84% of persons accused of hate crime targeting race were male, as were 89% of those targeting religion and 90% targeting sexual orientation. The median age for persons accused of hate crime tends to be under 30 years of age, with the exception of those accused of hate crimes against the Muslim and Arab or West Asian populations (42 and 33 years of age, respectively).
Between 2010 and 2017, youth aged 12 to 17 made up 25% of all persons accused of hate crime. The same as with all hate crimes, the vast majority of youth accused of hate crime were male (85%). Over half (53%) of the youth accused of hate crimes targeted race or ethnicity, followed by 21% targeting religion and 19% targeting sexual orientation, which was virtually identical to the distribution seen in adults accused of hate crimes.
Most hate crime cases completed in court involve public incitement and wilful promotion of hatred offences
Over the period of 2009/2010 to 2016/2017, there were 37 cases completed in adult criminal and youth courts where the most serious charge in the case was a hate crime related offence, according to Statistics Canada’s Integrated Criminal Court Survey. These were cases, processed mostly in adult criminal courts, where the most serious charge in the case was either advocating genocide; public incitement and willful promotion of hatred; or mischief relating to religious property.Note In total, 203 charges for hate crime related offences were processed in the courts between 2009/2010 and 2016/2017. Hate crime charges largely comprised public incitement and willful promotion of hatred (81%), followed by mischief relating to religious property (10%) and advocating genocide (9%).
Of the 37 completed hate crime cases from 2009/2010 to 2016/2017, 41% ended in a finding of guilt, an additional 35% were withdrawn, dismissed, or discharged by the courts and 8% were stayed or acquitted.
In 92% of hate crime cases ending in a finding of guilt, the accused was sentenced to probation. A sentence of custody was handed down in 17%.
Summary
Canadian police services reported 2,073 hate crimes in 2017, 47% more incidents than in 2016. This increase is mainly due to an increase in hate crimes targeting the Muslim, Jewish and Black populations. These increases were largely in Ontario and Quebec. Overall, crimes targeting the Jewish and Muslim populations were the most prevalent type of police-reported hate crimes in Canada.
Non-violent crimes played a bigger role in the overall increase in hate crimes than did violent crimes. The increase in non-violent hate crimes was driven primarily by a rise in mischief-related offences. Overall, the most common type of hate crime is mischief. Although the majority of hate crimes are non-violent, analysis of characteristics of hate crimes reported to police between 2010 and 2017 suggest that hate-motivated crimes targeting sexual orientation, the South Asian and Arab and West Asian populations are more likely to be violent than non-violent.
This multi-year analysis provides other insights into how hate crimes across various groups can differ. For instance, victims of violent hate crimes targeting sexual orientation and the Aboriginal population tend to be the youngest among hate crime victims and sustain the highest rate of injury. Further, compared to other hate crime victims, victims of crimes targeting East and Southeast Asian population and the Muslim population were most likely to be victimized by strangers. In contrast, the rate of victimization by someone known was highest among victims of hate crimes targeting Black populations and sexual orientation.
Currently, data from courts do not allow for an analysis of the use of sentencing provisions that take hate-motivation into account as an aggravating factor. As such, court data that are available on the hate crime offences outlined in the Criminal Code suggest that there have been relatively few such cases from 2009/2010 to 2016/2017. While about four in ten cases resulted in a guilty finding, the same is true for 16% of all hate crime charges completed in court over this period.
There are currently a number of initiatives in place by police, various levels of government and non-government agencies to address and prevent hate crime in Canada. In terms of data, the main sources in Canada remain police-reported and self-reported data from Statistics Canada’s General Social Survey. Other options to enhance understanding of hate crimes and non-criminal hate incidents could include platforms for online reporting that reach the diverse sectors of Canada. It could also include research to fill certain gaps in information such as understanding the risk factor in offending and the impact of education and prevention initiatives.
Detailed data tables
Table 1 Police-reported hate crimes, by detailed motivation, Canada, 2013 to 2017
Table 2 Police-reported hate crimes, by most serious violation, Canada, 2016 and 2017
Table 5 Population, selected characteristics, province and territory, 2001, 2011 and 2016
Table 7 Locations of hate crimes, by violation type and detailed motivation, Canada, 2010 to 2017
Table 8 Characteristics of hate crime victims, by motivation, Canada, 2010 to 2017
Table 9 Characteristics of persons accused of hate crimes, Canada, 2010 to 2017
Survey description
Incident-based Uniform Crime Reporting Survey
This article uses data from the Incident-based Uniform Crime Reporting Survey (UCR2). This is a microdata survey that captures detailed information on crimes reported to and substantiated by police, comprising the characteristics of victims, accused persons and incidents. In response to changing information needs, the survey was modified in 2005 (UCR2.2) to enable identification of incidents motivated by hate based on race, national or ethnic origin, religion, sexual orientation, gender identity or expression, language, sex, age, mental or physical disability, or any other similar factor.
In the UCR Survey, police services can report up to four offences per incident. However, to conform to statistical reporting standards for this survey, only the most serious offence in an incident is used in this analysis.
In 2017, police services reporting to the UCR2.2 served 99.4% of the population of Canada.
A supplemental survey has been conducted each year since 2006 as a means of obtaining information on hate-motivated crimes from those police services reporting microdata but which had not yet converted their electronic reporting systems to the newest UCR2.2 version. These respondents were asked to identify those criminal incidents that had been motivated by hate and to manually provide aggregate counts of incidents by the detailed motivation to Statistics Canada. Additional information (e.g., type of crime, weapon use, level of injury and relationship) cannot be provided by these respondents. In 2017, the municipal police service of Saint John was excluded due to poor data quality.
Combined, coverage from UCR2.2 and the supplemental survey in 2017 is estimated at 99.6% of the population of Canada.
The Oshawa census metropolitan area (CMA) is excluded from the analysis of hate crimes by CMA due to the incongruity between the police service jurisdictional boundaries and the CMA boundaries. For the same reason, data from the Halton and Durham police services are also excluded. The exclusion of information from Halton police affects the coverage for the Toronto and Hamilton CMAs. The exclusion of information from the Durham police affects coverage for Toronto. As a result, information for the CMA of Toronto reflects data from police serving 91% of the population of the CMA of Toronto. For Hamilton, data cover 74% of the Hamilton CMA population.
The UCR2 Survey collects information on victims of violent crimes when they are identified in an incident. In 2017, information on 826 victims of violent offences was reported in 635 hate crime incidents. In 15% of violent hate crime incidents involving victims, more than one victim was identified. Information on victims reflects data reported by police services covering 99% of the population of Canada. It is not provided by police services reporting to the UCR2.2 Supplemental Survey.
UCR2 also collects information about persons accused of hate crime. In 2017, there was information on 681 accused individuals associated with 563 incidents. In 14% of these incidents, more than one accused was identified. Information on accused reflects data reported by police services serving 99% of the population of Canada. It is not provided by police services reporting to the UCR2.2 Supplemental Survey.
Data on hate crimes are also available in Tables 35-10-0066-01 (formerly CANSIM 252-0092), 35-10-0067-01 (formerly CANSIM 252-0093), and 35-10-0191-01 (formerly CANSIM 252-0094).
References
Allen, Mary. 2018. “Police-reported crime statistics in Canada, 2017.” Juristat. Statistics Canada Catalogue no. 85-002-X.
Boutilier, Alex. 2018. “CSIS sees ‘significant’ jump in far-right activity online.” The Toronto Star. (accessed December 27, 2018).
British Columbia Ministry of the Attorney General. 2008. End Hate Crime: B.C. Hate Crime Team Roles and Responsibilities.
Chongatera, Godfred. 2013. “Hate-crime victimization and fear of hate crime among racially visible people in Canada: The role of income as a mediating factor.” Journal of Immigrant & Refugee Studies. Vol. 11. p. 44 to 64.
Edmonton Police Service. 2018. Hate and Bias Crime. (accessed December 27, 2018).
HateCrimeBC. n.d. BC Hate Crimes. (accessed December 27, 2018).
Office for Democratic Institutions and Human Rights. 2014. Hate Crimes in the Organization for Security and Co-operation in Europe Region–Incidents and Responses: Annual Report for 2014.
Office for Democratic Institutions and Human Rights. 2018. Prosecuting Hate Crimes: A Practical Guide.
Ontario Ministry of the Attorney General. 2010. Anti-Slapp Advisory Panel Report to the Attorney General.
Perry, Barbara. 2010. “Policing hate crime in a Multicultural society observations from Canada.” International Journal of Law, Crime and Justice. Vol. 38. p. 120 to 140.
Perry, Barbara and Scrivens, Ryan. 2016. “Uneasy alliances: A look at the right-wing extremist movement in Canada”. Studies in Conflict and Terrorism. Vol. 39, no. 9. p. 819 to 841.
Perry, Barbara and Scrivens, Ryan. 2017. “Resisting the Right: Countering right-wing extremism in Canada.” Canadian Journal of Criminology and Criminal Justice. Vol. 59, no. 4. p. 534 to 558.
Public Safety Canada. 2018a. Funding Project Descriptions: Canada Redirect. (accessed December 27, 2018).
Public Safety Canada. 2018b. National Strategy on Countering Radicalization to Violence. (accessed December 27, 2018).
Putnam, Robert. 2007. “E Pluribus Unum: Diversity and community in the Twenty-First Century.” Scandinavian Political Studies. Vol. 30, no. 2. p. 137 to 174.
Statistics Canada. 2010. Projections of the Diversity of the Canadian Population: 2006 to 2031. Statistics Canada Catalogue no. 91-551-X.
Statistics Canada. 2012. “Portrait of families and living arrangements in Canada.” Families, Households and Marital Status, 2011 Census of Population. Statistics Canada Catalogue no. 98-312-X.
Statistics Canada. 2013a. Aboriginal Peoples in Canada: First Nations People, Métis and Inuit. National Household Survey, 2011. Statistics Canada Catalogue no. 99-011-X.
Statistics Canada. 2013b. Immigration and Ethnocultural Diversity in Canada. National Household Survey, 2011. Statistics Canada Catalogue no. 99-010-X.
Statistics Canada. 2017. Study: A Look at Immigration, Ethnocultural Diversity and Languages in Canada up to 2036, 2011 to 2036. Statistics Canada Catalogue no. 91-551-X.
Statistics Canada. 2018. “Police-reported hate crime, 2017”. The Daily.
Stevkovski, Ljupcho. 2015. “The rise of Right-Wing extremism in European Union.” Interdisciplinary Political and Cultural Journal. Vol. 17, no. 1. p. 43 to 57.
York Regional Police. 2018. Diversity, Equity and Inclusion. (accessed December 27, 2018).
- Date modified: