
The Canadian Police Performance Metrics Framework: Standardized indicators for police services in Canada

Archived Content
Information identified as archived is provided for reference, research or recordkeeping purposes. It is not subject to the Government of Canada Web Standards and has not been altered or updated since it was archived. Please "contact us" to request a format other than those available.
by Benjamin Mazowita and Cristine Rotenberg, Canadian Centre for Justice Statistics
Skip to text
Text begins
A performance metric is a measurable value that serves as an indicator of how effectively an organization is achieving its key objectives. Contemporary policing includes a broad spectrum of responsibilities ranging from law enforcement, emergency response and crime prevention, to providing assistance to victims and collaborating with external agencies (Montgomery and Griffiths 2017). It has been argued that the conventional structure and operational demands placed on police services in Canada are being fundamentally challenged given the changing context of police work (Council of Canadian Academies 2014). Police services are being increasingly called to respond to matters that fall outside of the core law enforcement function of policing and, during times of fiscal restraints and budgeting decisions, there is a need to be able to demonstrate the effectiveness and efficiency of programs, systems and policies (Canadian Association of Chiefs of Police 2015; Malm et al. 2005; Waterloo Regional Police Service 2011). In order to determine how best to achieve sustainable levels of policing in an environment of limited resources, police leaders are looking to performance metrics to objectively assess policing activities and inform resource allocation (Maslov 2016).
In 2014, Statistics Canada, in collaboration with Public Safety Canada and Police Information and Statistics (POLIS) committee of the Canadian Association of Chiefs of Police (CACP) undertook a review of current performance measures being used by police services in Canada. This work was done to determine whether or not there is a need for standardized, national measures and to determine the types of data needed to support police leaders in decision-making and management. As a result of this work, it was found that, in the absence of national indicators of police performance, police services in Canada rely on traditional metrics that do not reflect the complexity and scope of contemporary policing responsibilities. As such, there is a need for a standard police performance metrics framework for Canadian policing.
As a result of this development work by Statistics Canada and its partners, in April 2017, a preliminary police performance metrics framework was approved by the POLIS committee, and in November 2017, the proposed police performance metrics framework was presented to and received the endorsement of the Board of Directors of the CACP.
This Juristat article provides an overview of the Canadian Police Performance Metrics Framework (CPPMF). The article provides a review of the literature on performance measurement, an examination of how Canadian police services are currently using data in public performance reports, and the results of a consultation of Canadian police services on measuring police performance based on data availability and information needs. Preliminary results from a pilot project on the feasibility of collecting uniform calls for service data from Canadian police services are also provided.
Current use of performance metrics by Canadian police services
In order to produce a conceptual framework of police performance, an environmental scan on the current use of performance metrics by Canadian police services was conducted, including a review of existing research and public police performance reports, as well as a consultation of police services to determine their strategic goals and organizational priorities.
A review in 2014 of the current use of performance metrics revealed that within the Canadian context there is no common model or framework for measuring police performance. While there are some pre-established indicators under provincial legislation, there are no overarching legislative requirements that dictate the use of specific performance measures across jurisdictions.
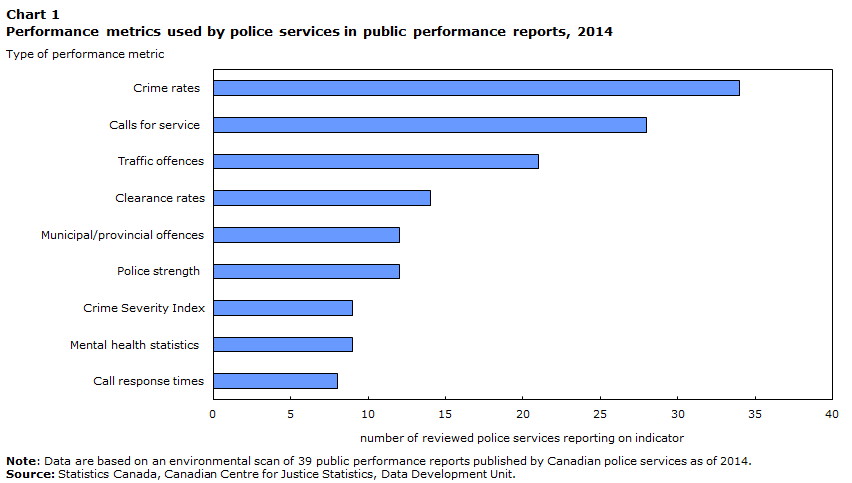
Though many local police agencies report on select performance indicators themselves, there can be a tendency to attempt to measure ‘everything and anything’ rather than focusing on the most meaningful indicators (Kiedrowski et al. 2013). A review of public performance reports produced by 39 police services, with representation from every province, reveals the most commonly reported indicators (Chart 1). To date, police have relied on crime rates and the crime severity index, clearance rates, police strength (number of officers per 100,000 population) and expenditures – data points that are readily accessible and produced at a national level.
Chart 1 start
Data table for Chart 1
| Type of performance metric | Number of reviewed police services reporting on indicator |
|---|---|
| Crime rates | 34 |
| Calls for service | 28 |
| Traffic offences | 21 |
| Clearance rates | 14 |
| Municipal/provincial offences | 12 |
| Police strength | 12 |
| Crime Severity Index | 9 |
| Mental health statistics | 9 |
| Call response times | 8 |
|
Note: Data are based on an environmental scan of 39 public performance reports published by Canadian police services as of 2014. Source: Statistics Canada, Canadian Centre for Justice Statistics, Data Development Unit. |
|
Chart 1 end
Overall, Canadian police agencies, whether independently or under broader provincial/territorial initiatives, are reporting on traditional metrics that do not reflect the complexities of contemporary policing functions outside of strictly law enforcement activities. Very few measurement frameworks have been developed with an emphasis on policing outcomes and quality of service. When police services do publish metrics that extend beyond common traditional metrics, such as calls for service data, they are reported at the discretion of the police service and lack standardization, making them incomparable across jurisdictions.
Consultation results revealed that, despite the consensus that traditional metrics do not reflect the complexity of policing responsibilities, police services still considered them critical to measuring strategic goals and priorities (Chart 2). Police services identified measures of public perceptions of police (‘public satisfaction’ or ‘trust and confidence in police’) as being critical to measuring police performance. The majority of the police services surveyed further indicated that they collected data on resources allocated to reactive and proactive policing activities, and these data were identified as being critical to measuring strategic goals and priorities. Fewer police services collected data on administrative activities or duties, and few saw these as a critical measure.
Chart 2 start

Data table for Chart 2
| Currently collect information based on consultation responses | Critical to measuring strategic priorities/goals | |
|---|---|---|
| percent | ||
| Administrative activities | 48 | 45 |
| Proactive activities | 89 | 58 |
| Reactive activities | 86 | 55 |
| Current metrics | 97 | 81 |
| Public satisfaction | 89 | 67 |
|
Note: Current metrics include crime rates, clearance rates, crime severity, police strength, and police expenditures. Public satisfaction refers to measures of public perceptions of police as captured in social surveys. Proactive activities represent targeted policing initiatives or programs, including community mobilization efforts. Reactive activities include a variety of metrics related to calls for service. Administrative activities include court preparation and attendance, report writing, prisoner or court security, and other such administrative tasks. Metrics related to reactive activities exclude response times to calls for service. Police services consistently reported that response time to calls for service were of lesser importance in terms of measuring strategic goals and priorities relative to other metrics of calls for service. Source: Statistics Canada, Canadian Centre for Justice Statistics, Police Performance Metrics: Consultation Document. |
||
Chart 2 end
Principles of performance measurement
The objective of the police performance metrics project was to recommend a suite of police performance indicators that reflect strategic priorities and the spectrum of contemporary policing responsibilities in Canada. At the same time, the recommended indicators must be standardized for a national framework, nationally comparable, and feasible for all police services in Canada to report on.
The following principles were considered in compiling the recommended indicators comprising the performance metrics framework:
- Performance indicators should be broad enough to apply to all police services involved.
- A small number of indicators should be utilized as opposed to an array of measures that attempt to measure ‘anything and everything’.
- A national framework should be implemented with stable long-term reporting objectives and trend analysis in mind (avoid amending indicators from year to year).
- Performance results should not be interpreted as rigid report cards, but rather as metrics which may identify areas that require more in-depth and potentially qualitative assessment of processes and outcomes to better understand the context behind the results.
- Performance indicators should not preclude police services or jurisdictions from continuing to report on their own service or jurisdiction specific indicators.
The Canadian Police Performance Metrics Framework
The Canadian Police Performance Metrics Framework (CPPMF) is organized around four pillars:
- Crime and victimization: Measures of the incidence of crime, victimization, and bringing offenders to account, including traditional metrics, linked court data, and re-contact data.
- Police activities and deployment: Measures of police functions and activities that contribute to public safety, including non-crime related policing responsibilities.
- Police resources: Measures of police personnel and operating expenditures.
- Trust and confidence in police: Measures of Canadians' trust and confidence in police, and perceptions of police legitimacy.
Each of these pillars contain several dimensions, data sources, and specified performance metrics which should be interpreted in conjunction with one another.
Pillar 1: Crime and victimization
The first pillar of the framework comprises measures of the incidence of crime and victimization, including commonly reported traditional metrics (crime rates, crime severity, and clearance rates), self-reported victimization data, and linked data (Figure 1). These indicators, when used over time, would speak to the degree that police services are effective at reducing criminal victimization, improving public safety, and bringing offenders to account for their crimes. Performance metrics within this dimension reflect the outcomes and quality of police performance.
Measures within the dimensions of crime and victimization are currently available using Uniform Crime Reporting (UCR) annual data and self-reported victimization data collected by the General Social Survey (GSS) every five years. Similarly, data on clearance rates and the use of extra-judicial measures are currently available; however, consistent data on court outcomes and re-contact would require further development and data linkage. While it can be an indicator of prosecutorial discretion and performance, linked data on court outcomes could be interpreted in part as an indicator of the quality of police investigations to the extent that they sustain legal scrutiny and progress to trial or result in actual convictions (Moore and Braga 2003). Re-contact data can speak to police performance and successful outcomes specifically with respect to reducing chronic offending and repeat victimizations.Note
Figure 1 start
| Dimension | Data | Data source(s) | Metrics |
|---|---|---|---|
| Crime |
|
|
|
| Victimization |
|
|
|
| Offenders |
|
|
|
| Re-contact |
|
|
|
Figure 1 end
Pillar 2: Police activities and deployment
The second pillar of the framework covers measures of police activities and processes that contribute to public safety more broadly, including calls for service, patrol deployment, activity reporting, and police function and initiative resource allocation (Figure 2).
Calls for service data is currently in development and recommendations have been prepared for the ongoing collection of Uniform Calls for Service data (UCS) (see Text box 1). Collecting data on patrol deployment and activity reporting (e.g., busy codes) will require further exploration. While some police services have provided information on their systems of recording officer time allocation, the collection of such data would require considerable consultation and feasibility work. Data on the financial and human resources dedicated to specific policing initiatives would similarly require more exploration, but could be a potential addition to the Police Administration Survey (PAS). However, consultations conducted in 2016/2017 indicated that many police services were unable to provide financial data at this level. Data on activity reporting and targeted policing initiatives would offer some measure of resource allocation to reactive, proactive, and administrative tasks, which is otherwise lacking in the framework as proposed.
Figure 2 start
| Dimension | Data | Data source(s) | Metrics |
|---|---|---|---|
| Calls for service |
|
|
|
| Activity reporting |
|
|
|
| Targeted policing initiatives |
|
|
|
Figure 2 end
Start of text box 1
Text box 1
Uniform calls for service data
Alongside the development of a police performance metrics framework, the Canadian Centre for Justice Statistics (CCJS) conducted a feasibility study on the collection of standardized calls for service data from Canadian police services. In coordination with the Public Safety Canada and Police Information and Statistics (POLIS) committee, the CCJS launched the first phase of a calls for service pilot project in 2014 which involved data collection from six police services on a subset of call types (e.g., mental health related calls, domestic incidents, and missing persons). This pilot offered a preliminary proof of concept for collecting data on policing responsibilities that are not captured in the Uniform Crime Reporting Survey. The study also noted the desire to measure the distribution of resources and service time allocated to particular types of calls for service, particularly for smaller groups of individuals coming into contact with police more than once.
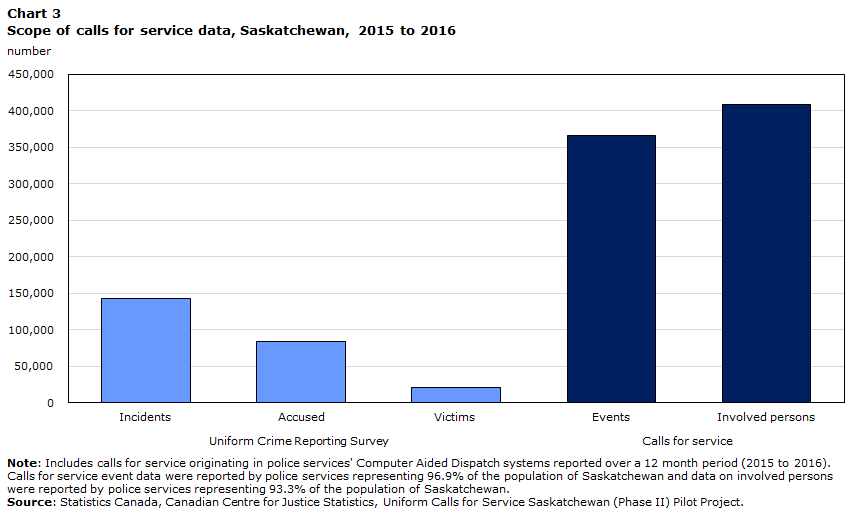
In 2016, the CCJS received the endorsement of the Saskatchewan Association of Chiefs of Police (SACP) to proceed with Phase II of the calls for service pilot project,Note collecting data from police services representing the province of Saskatchewan. The purpose of this second phase was to test a complete set of call types and priority levels (established by the POLIS calls for service working group), refine definitions and key concepts, and to expand the analysis of persons involved in calls for service (Chart 3).
Chart 3 start
Data table for Chart 3
| Number | |
|---|---|
| Uniform Crime Reporting Survey | |
| Incidents | 143,181 |
| Accused | 83,501 |
| Victims | 20,521 |
| Calls for service | |
| Events | 366,943 |
| Involved persons | 408,090 |
|
Note: Includes calls for service originating in police services' Computer Aided Dispatch systems reported over a 12 month period (2015 to 2016). Calls for service event data were reported by police services representing 96.9% of the population of Saskatchewan and data on involved persons were reported by police services representing 93.3% of the population of Saskatchewan. Source: Statistics Canada, Canadian Centre for Justice Statistics, Uniform Calls for Service Saskatchewan (Phase II) Pilot Project. |
|
Chart 3 end
While there are some differences in the ways different police services record their calls for service data and the scope of what is consider a call for service, the results of these pilot projects indicate that it is feasible to collect standardized calls for service data from Canadian police services.
The data from the pilot project show that approximately one in five (19.1%) calls for service resulted in a criminal violation being recorded by police (Chart 4). Similarly, data on time allocation revealed that just under one-third (31.0%) of police officer time is dedicated to calls for service that result in the reporting of a criminal violation, meaning the remaining more than two-thirds (69.0%) of service time involved police responding to non-criminal matters. Call types that took the greatest amount of service time were: motor vehicle accidents and traffic matters, incidents of domestic violence, reports of suspicious individuals or circumstances, disturbance or disorderly conduct, attempted suicide, and calls related to intoxicated persons.
Chart 4 start

Data table for Chart 4
| Initial call type | Non-criminal | Criminal |
|---|---|---|
| proportion | ||
| Motor vehicle and non-motor vehicle traffic | 19.84 | 0.34 |
| Property related/break-ins/fraud | 8.93 | 5.58 |
| Disturbance/by-law/complaint/demonstration | 9.30 | 2.79 |
| Mischief/trespass/unwanted person | 7.07 | 3.25 |
| Assist general public/other police matters | 7.24 | 0.86 |
| Immediate response/assistance required/hazardous situation | 7.51 | 0.37 |
| Drugs/alcohol/gaming/prostitution | 5.35 | 1.07 |
| Administrative duties | 5.51 | 0.37 |
| Violent crimes and weapons offences | 3.36 | 1.97 |
| Uncoded | 2.27 | 1.94 |
| Wanted/high risk person/offender/accused | 2.43 | 0.57 |
| Abduction/missing person | 2.07 | 0.04 |
|
Note: Includes calls for service reported over a 12 month period (2015 to 2016) from police services representing 96.6% of the population of Saskatchewan. The proportion of 'criminal' calls for service represent calls that resulted in the reporting of a Criminal Code violation. Source: Statistics Canada, Canadian Centre for Justice Statistics, Uniform Calls for Service Saskatchewan (Phase II) Pilot Project. |
||
Chart 4 end
In light of these valuable findings, the CCJS is recommending the development of parallel systems for the collection of both aggregate calls for service data and unit-level microdata from police services that have the capacity to provide this information. This will permit more in-depth analysis of resource allocation to derive broad baseline indicators of police workload that is not reflected in the Uniform Crime Reporting Survey. Moving this project forward will require an ongoing dialogue with police leadership, vendors of CAD (Computer-aided Dispatch) and RMS (Records Management) systems, and our external justice partners.
End of text box 1
Pillar 3: Police resources
The third pillar of the performance metrics framework comprises measures of police personnel and expenditures, including data on police strength, civilianization, diversity of police personnel, operating expenditures, investments in training/innovation, and professional development (Figure 3). These performance metrics are primarily measures of inputs or investments in policing, which allow for analysis of the efficiency with which a police services uses its resources when looked at in concert with metrics of outputs and outcomes. Metrics within this pillar are principally derived from the Police Administration Survey (PAS) which recently underwent a redesign. The redesigned questionnaire was administered for the first time in 2018 and results are expected in 2019.
Figure 3 start
| Dimension | Data | Data source(s) | Metrics |
|---|---|---|---|
| Police personnel |
|
|
|
| Work force health and motivation |
|
|
|
| Training and professional development |
|
|
|
| Operating expenditures |
|
|
|
Figure 3 end
Pillar 4: Trust and confidence in police
The fourth pillar comprises measures of Canadians' trust, confidence in, and perceptions of police, as well as measures of public engagement, legitimacy, and the degree to which police services are seen as meeting the needs of their respective communities (Figure 4). This includes data derived from social surveys and data that would require development on public engagement and use of force and authority.
Currently the General Social Survey (GSS) on Victimization is the only source of national data on public perceptions of police performance in Canada; however, this survey is only administered every five years and data are not available at all levels of geography. While many police services conduct their own ‘public satisfaction’ surveys, these are generally not standardized and lack comparability and validity (Maslov 2016). Public Safety Canada, in partnership with Halifax Regional Police and in consultation with the Public Safety Canada and Police Information and Statistics (POLIS) committee, developed and piloted a set of survey instruments to measure trust and confidence in police, which were developed and validated across a series of research exercises conducted in 2017 and 2018 (Lawrence and Giacomantonio 2017; Giacomantonio et al. forthcoming 2019).
Figure 4 start
| Dimension | Data | Data source(s) | Metrics |
|---|---|---|---|
| Trust and confidence in police |
|
|
|
| Public engagement |
|
|
|
| Use of force and authority |
|
|
|
Figure 4 end
The survey instrument comprises the following five ‘core’ indicatorsNote that serve as a standard to provide relevant measures of trust and confidence in policing in the Canadian context.Note These questions were endorsed by the Canadian Association of Chiefs of Police (CACP) Board of Directors in November 2018 as a national standard for measuring trust and confidence in police.
The core indicators are:
- When you think about [INSERT POLICE SERVICE], to what extent do you agree or disagree with each of the following statements? (Response categories:
Strongly disagree; Disagree; Neither agree nor disagree; Agree; Strongly agree)
- The police make decisions based on facts.
- The police treat people with respect.
- The police provide the same quality of service to all citizens.
- The police are dealing with the things that matter to people in this community.
- I feel a moral duty to follow police orders.
- I generally support how the police usually act.
- I would help the police if asked.
- About how often would you say that the police in your neighbourhood exceed their authority? (Response categories: Never/almost never, Rarely, Sometimes, Most of the time, Always/Almost always)
- In general, to what extent do you agree that the [INSERT POLICE SERVICE] [is/are] effective at: (Response categories: Strongly disagree; Disagree; Neither agree nor disagree; Agree; Strongly agree)
- Resolving crimes where violence is involved?
- Responding quickly to calls for assistance?
- Taking everything into account, how good a job do you think the police in this area are doing? (Response categories: Very poor; Poor; Average; Good; Excellent)
- Taking everything into account, how good a job do you think the police in this country are doing? (Response categories: Very poor; Poor; Average; Good; Excellent)
Personal experience with policing, perceptions of neighbourhood crime and disorder, and personal experiences of victimization have all been empirically demonstrated to predict overall attitudes toward the police in the wider literature. As such the survey instrument developed also recommends police include a set of validated ‘predictor’ questions that measure personal contact with police, satisfaction with that contact, perceptions of crime, and victimization, as well as a concise set of demographic indicators. Including these indicators will be important to help police services interpret their results. These questions were also endorsed by the Canadian Association of Chiefs of Police (CACP) Board of Directors in November 2018. (Refer to Giacomantonio et al. forthcoming 2019 for details on the predictor questions).
The proposed indicators are not intended to replace the surveys currently conducted by police services in Canada. Rather, these items should be integrated into the existing survey processes. The questions and indicators provide a set of tested, nationally-relevant indicators for inclusion at the front-end of any survey on public attitudes toward police, while providing a framework through which police may ask any additional questions of the public relevant to their specific jurisdiction.
Summary
To date, in the absence of national indicators of police performance in Canada, police services have relied on traditional metrics that do not adequately reflect the complexity and scope of contemporary policing responsibilities. The Canadian Police Performance Metrics Framework (CPPMF) presented in this paper is the result of extensive consultation and collaboration with police in order to respond to a need for standardized indicators. It reflects agreed upon national metrics and provides a roadmap of data which police in Canada can use to guide data development in order to yield statistics that present a more comprehensive narrative of what police services do and the capacity police services have to be efficient and effective in their mandated and assumed responsibilities (Montgomery and Griffiths, 2017). The framework can form a basis for police services to reconsider current performance reporting.
There have been recent achievements in filling some of the data gaps, including: the collection of new, pertinent data through Statistics Canada’s Police Administration Survey (PAS); completing the groundwork for the national collection of uniform calls for service data; continually demonstrating the value of linked data by producing statistics on re-contact with police and outcomes of the justice system, and; the availability of meaningful and standardized questions to measure trust and confidence in police. Next steps could include exploring the data from the redesigned PAS, working with police and other justice partners to implement the collection of uniform calls for service in Canada, advancing the regular production of re-contact and justice system outcome indicators, and adoption by police and others of the trust and confidence questions in their community satisfaction and safety surveys. The remaining gaps provide a direction in which police and other stakeholders can focus analysis and data development.
References
Brennan, S. and A. Matarazzo. 2016. “Re-contact with the Saskatchewan justice system.” Juristat. Statistics Canada Catalogue no. 85-002-X.
Canadian Association of Chiefs of Police. 2015. The Dollars and Sense of Policing, Public Safety and Well-Being in Your Community.
Council of Canadian Academies. 2014. “Policing Canada in the 21st Century: New policing for new challenges.” The Expert Panel on the Future of Canadian Policing Models, Council of Canadian Academies.
Giacomantonio, C., Mugford, R., Maslov, A. and A. Lawrence. Forthcoming 2019. Developing a Common Data Standard for Measuring Attitudes toward the Police in Canada. Public Safety Canada. Ottawa, Ontario.
Ibrahim, D. 2019. “Youth re-contact with the Nova Scotia justice system, 2012/2013 to 2014/2015.” Juristat. Statistics Canada Catalogue no. 85-002-X.
Kiedrowski, J., Petrunik, M., Macdonald, T. and R. Melchers. 2013. Canadian Police Board Views on the Use of Police Performance Metrics. Public Safety Canada. Ottawa, Ontario.
Lawrence, A. and C. Giacomantonio. 2017. “Improving measures of trust and confidence.” Public Safety Canada Presentation to Police Information Statistics Committee, Spring 2017.
Malm, A., Pollard, N., Brantingham, P., Tinsley, P., Plecas, D., Brantingham, P., Cohen, I. and B. Kinney. 2005. “A 30 year analysis of police service delivery and costing: “E” Division.” Centre for Criminal Justice Research. University College of the Fraser Valley.
Maslov, A. 2016. Measuring the Performance of the Police: The Perspective of the Public. Public Safety Canada. Ottawa, Ontario.
Montgomery, R. and C.T. Griffiths. 2017. Contemporary Policing Responsibilities. Public Safety Canada. Ottawa, Ontario.
Moore, M.H. and A. Braga. 2003. The “Bottom” Line of Policing: What Citizens Should Value (and Measure!) in Police Performance. Police Executive Research Forum.
Rotenberg, C. 2017. “From arrest to conviction: Court outcomes of police-reported sexual assaults in Canada, 2009 to 2014.” Juristat. Statistics Canada Catalogue no. 85-002-X.
Waterloo Regional Police Service. 2011. Neighbourhood Policing: Rebuilding to Meet the Needs of Our Changing and Growing Community.
- Date modified: