
Adult correctional statistics in Canada, 2014/2015

Archived Content
Information identified as archived is provided for reference, research or recordkeeping purposes. It is not subject to the Government of Canada Web Standards and has not been altered or updated since it was archived. Please "contact us" to request a format other than those available.
by Julie Reitano
In Canada, the administration of adult correctional services is a shared responsibility between the federal and provincial/territorial governments. The federal system has jurisdiction over adult offenders (18 years and older) serving custodial sentences of two years or more and is responsible for supervising offenders on conditional release in the community (i.e. parole or statutory release). The provincial/territorial system is responsible for adults serving custodial sentences that are less than two years, those who are being held while awaiting trial or sentencing (remand), as well as offenders serving community sentences, such as probation.
This Juristat article provides an overview of adult correctional services in Canada for 2014/2015. It presents three indicators that describe the use of correctional services: average daily counts, admissions and initial entry. Average counts provide a snapshot of the adult corrections population on any given day; initial entry provides an indication of the number of adults entering the corrections system during the year; and admissions measure the flow of adults through the system by counting adults each time they begin or move to a new type of custody or community supervision (see Text box 1).
Data for this article come from three correctional services surveys. The Adult Correctional Services Survey and the Integrated Correctional Services Survey are the source of admissions data. With the exception of Alberta, all provinces and territories as well as Correctional Service Canada (federal corrections) provided data in 2014/2015.Note 1 The Adult Corrections Key Indicator Report provides information on average daily counts. Average count data for Nova Scotia, New Brunswick and Alberta are limited to custody counts.
Start of text box
Highlights
Rate of adults being supervised by the correctional system continues to decline
- On any given day in 2014/2015, in the 10 reporting provinces and territories for which both custody and community data were available, there were a total of 110,521 adult offenders in either custody or a community program (Table 1).Note 2 This represents a rate of 461 offenders per 100,000 adult population, a decrease of 6% from the previous year and a decline of 16% compared to five years earlier.
- On a typical day in the federal correctional system in 2014/2015, there were 23,062 adult offenders being supervised. This represents a rate of 81 per 100,000 adult population, a decline of 1% from the previous year and down 3% compared to 2010/2011.
- More than 8 in 10 adults under correctional supervision in the provinces and territories in 2014/2015 were in the community (82%) and the remaining 18% were in custody.Note 3
Adult incarceration rate is down
- In 2014/2015, there were 39,623 adults in custody on an average day, with 24,455 of those adults in provincial/territorial custody and 15,168 in federal custodyNote 4 (Table 1). The adult incarceration rate for Canada, which represents the average number of adults in custody (sentenced custody, remand and other temporary detention) per day for every 100,000 adults in the population, was 138 offenders per 100,000 adults.
- The provincial/territorial adult incarceration rate was 85 offenders per 100,000 adult population in 2014/2015, down 4% from the previous year.Note 5 The federal incarceration rate was also lower, declining 1% from the previous year to 53 offenders per 100,000 adult population.
- The decline in the provincial/territorial adult incarceration rate was fairly consistent across the country; the rate declined in 10 of the 12 reporting provinces and territories.Note 6 The rate in Newfoundland and Labrador increased 10% while that for Saskatchewan remained unchanged in comparison to the previous year.
- In the provinces, Manitoba recorded the highest adult incarceration rate at 240 per 100,000 adult population, while British Columbia recorded the lowest (63 per 100,000 adult population).
Remand counts continue to outnumber sentenced population
- In 2014/2015, on any given day, there were 13,650 adults held in remand, awaiting trial or sentencing, and 10,364 adults in sentenced custody in the provinces and territories (Table 2).
- Over the last decade, the remand population has consistently exceeded the sentenced population (Chart 1) with adults in remand accounting for 57% of the custodial population in 2014/2015.Note 7
- Among the provinces, Nova Scotia and Alberta had the highest proportion of their custodial populationsNote 8 in remand (68% and 67% respectively), while Prince Edward Island had the lowest proportion (16%).
- The total number of adults in remand in 2014/2015 was 39% higher than in 2004/2005. All provinces and territories have experienced increases, however, the largest increases were noted in Nova Scotia, the Northwest Territories, Manitoba and Alberta.
Most adults under community supervision are on probation
- On any given day in 2014/2015, in the 10 provinces and territories for which community data were reported, there was an average of 90,271 adult offenders being supervised through community programs such as probation and conditional sentences (Table 1). As well, Correctional Service Canada supervised an average of 7,895 offenders per day on day parole, full parole, or statutory release.
- In provincial and territorial corrections, probation is by far the most common supervision program. On average, there were 80,705 adult offenders on probation on any given day in 2014/2015, representing 89% of the population of offenders under supervision in the community and 73% of all adults under correctional supervision in the 10 reporting provinces and territories (Table 2).Note 9
- The rate of adult offenders being supervisedNote 10 in the community in the provinces and territories stood at 376 adults per 100,000 population in 2014/2015 (Table 1). This represented a decrease of 7% from the previous year. The rate of federal offenders in community supervision was unchanged at a rate of 28 adults per 100,000 population.
Remand is the first point of contact for many adults entering adult corrections
- Initial entry measures the number of adults commencing a period of correctional supervision and provides an indication of new workload entering the corrections system. In 2014/2015, there were 94,480 initial entries of adults into correctional services in the six reporting jurisdictions (Table 3).Note 11 This was down 5% from the previous year. Ontario reported the largest decrease (-8%) and Saskatchewan reported the only increase (+3%) from 2013/2014.
- Remand was the most common point at which adults entered the correctional system in Ontario (51% of initial entries), Saskatchewan (42%), and New Brunswick (36%).
- Probation was the most common initial entry point in Newfoundland and Labrador (38%).
- In Nova Scotia, remand and probation were equally the most common points of entry into the correctional system (38% each).
- The commencement of bail supervision was the most common point of initial entry in British Columbia (54%), one of only two reporting provinces that supervise bail.
Admissions to adult correctional services continue to decline
- Admissions measure the number of times an adult moves from one type of correctional supervision to another. In 2014/2015, there were 331,968 admissions to federal and provincial/territorial adult correctional services in the 12 reporting provinces and territories (Table 4).Note 12 This represented a decrease of 3% from the previous year and 7% from five years earlier. Over 95% of all admissions were to provincial/territorial corrections (see Text box 2).
- Admissions to both custody and community supervision registered a decline in 2014/2015; -2% for custodial admissions and -4% for community admissions. Among the reporting jurisdictions,Note 13 the largest overall decrease (-12%) was recorded by the Northwest Territories. In contrast, Saskatchewan recorded the largest increase (+5%) (Table 4).
Women account for a small proportion of admissions to adult correctional services
- In 2014/2015, women accounted for 15% of overall correctional admissions to provincial/territorial correctional services.Note 14 They accounted for a higher proportion of community admissions (20%) than custody admissions (13%) (Table 5).
- Women made up a small share of admissions to both remand and sentenced custody in the provinces and territories, 13% and 11%, respectively and 7% federally.
Younger adults account for the majority of admissions to correctional services
- In 2014/2015, adults under 35 years old accounted for 58% of admissions to provincial/territorial corrections (Chart 2).Note 15 This was unchanged from five years earlier.
- The findings for custodial admissions to federal correctional services were similar with the majority (54%) of adults admitted being under 35 years of age.
- Young adults are overrepresented in admissions to adult correctional services given that individuals between 18 and 34 years of age represent 20% of the Canadian adult population.Note 16
Aboriginal adults account for one in four admissions to provincial/territorial correctional services
- Aboriginal adultsNote 17 are overrepresented in admissions to provincial/territorial correctional services, as they accounted for one-quarter (25%) of admissionsNote 18 in 2014/2015 while representing about 3% of the Canadian adult populationNote 19 (Table 5). The findings for custodial admissions (26%) were similar to community admissions (24%) in the provinces and territories.
- With regard to federal correctional services, Aboriginal adults accounted for 22% of admissions to sentenced custody in 2014/2015.
- The overrepresentation of Aboriginal adults was more pronounced for females than males. Aboriginal females accounted for 38% of female admissions to provincial/territorial sentenced custody, while the comparable figure for Aboriginal males was 24%. In the federal correctional services, Aboriginal females represented 31% while Aboriginal males accounted for 22% of admissions to sentenced custody.
Time spent in provincial/territorial custody continues to be short
- The length of time spent in custody tends to be short. In 2014/2015, more than half (53%) of adult offenders releasedNote 20 from remand in the 12 reporting provinces and territories were held for one week or less and more than three-quarters (78%) were held for one month or less (Chart 3).Note 21
- In 2014/2015, 28% of adult offenders released from provincial/territorial sentenced custody served a term of one week or less, and about six in ten adult offenders (59%) were held for terms of one month or less (Chart 3).
- The distribution of time spent in sentenced custody for 2014/2015 was very similar to five years earlier, although the proportion of offenders spending one week or less was somewhat lower (26%) in 2010/2011.
Operating expenditures for adult correctional services reached more than $4 billion in 2014/2015
- In 2014/2015, adult correctional services operating expenditures in Canada totalled over $4.6 billion, a slight decline of 0.7% from the previous year after adjusting for inflation.Note 22
- Slightly more than half (52%) of all correctional service expenditures in 2014/2015 were in the federal system, while the remaining 48% were in the provincial and territorial systems. In the provincial/territorial system, custodial services accounted for 80% of all correctional expenditures while community supervision services accounted for 15% (Table 6).
- Total operating expendituresNote 23 for correctional services was equivalent to $130 for each person in the Canadian population. Of this amount, a little over half ($68) was spent for federal correctional services, with the remainder being spent for provincial and territorial correctional services.
- The costs for keeping adults in custody are typically higher for the federal system. On average, in 2014/2015, institutional expenditures amounted to about $302 per day for federal offenders, compared to about $199 per day for provincial and territorial offenders (Table 6).
End of text box
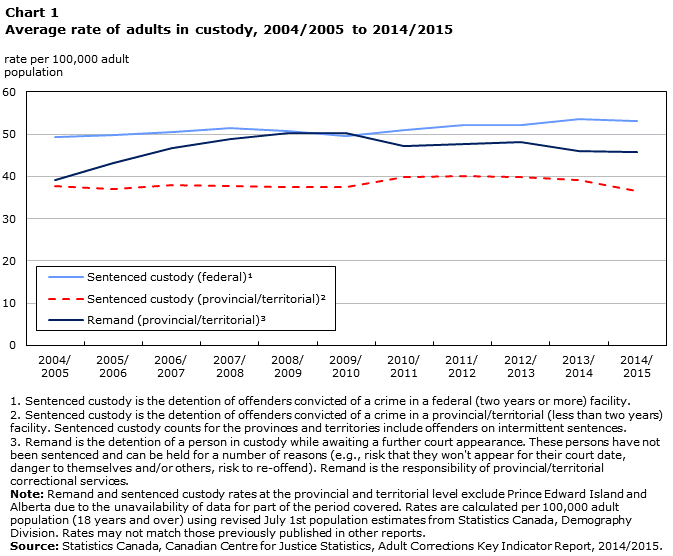
Description for Chart 1
| Years | Sentenced custody (federal)1 | Sentenced custody (provincial/territorial)2 | Remand (provincial/territorial)3 |
|---|---|---|---|
| 2004/2005 | 49 | 38 | 39 |
| 2005/2006 | 50 | 37 | 43 |
| 2006/2007 | 51 | 38 | 47 |
| 2007/2008 | 51 | 38 | 49 |
| 2008/2009 | 51 | 37 | 50 |
| 2009/2010 | 50 | 37 | 50 |
| 2010/2011 | 51 | 40 | 47 |
| 2011/2012 | 52 | 40 | 48 |
| 2012/2013 | 52 | 40 | 48 |
| 2013/2014 | 54 | 39 | 46 |
| 2014/2015 | 53 | 36 | 46 |
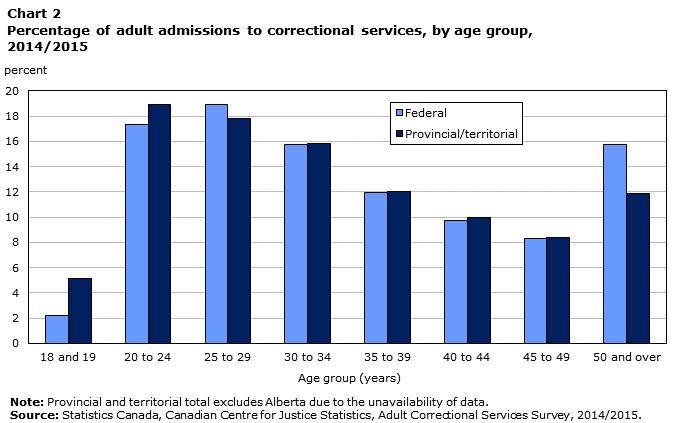
Description for Chart 2
| Age group (years) | Federal | Provincial/territorial |
|---|---|---|
| 18 and 19 | 2 | 5 |
| 20 to 24 | 17 | 19 |
| 25 to 29 | 19 | 18 |
| 30 to 34 | 16 | 16 |
| 35 to 39 | 12 | 12 |
| 40 to 44 | 10 | 10 |
| 45 to 49 | 8 | 8 |
| 50 and over | 16 | 12 |

Description for Chart 3
| Time served | Sentence custody | Remand |
|---|---|---|
| 1 week or less | 28 | 53 |
| Greater than 1 week to 1 month | 30 | 25 |
| Greater than 1 month to 6 months | 31 | 18 |
| More than 6 months | 10 | 4 |
Detailed data tables
Table 1 Average counts of adults in correctional services, by jurisdiction, 2014/2015
Table 6 Operating expenditures of the adult correctional system, by jurisdiction, 2014/2015
Start of text box
Text box 1
Average counts, initial entry and admissions
Average counts provide a snapshot of the adult correctional population and represent the number of adults in custody or under community supervision on any given day. Corrections officials typically perform daily counts of adults in their facilities and monthly counts of adults under community supervision. These are used to calculate the annual average daily custody and community counts as well as average daily inmate costs.
Initial entry represents the first point at which an adult commences an uninterrupted period of supervision within the adult corrections system. Each person is counted only once during his or her period of involvement with correctional services, regardless of subsequent changes in legal status.
Admissions for Canadian Centre for Justice Statistics surveys are counted each time a person begins any period of supervision in a correctional institution or in the community. These data describe and measure the flow of persons through correctional services over time. The same person may be included several times in the admission counts where he/she moves from one correctional program to another (e.g., from remand to sentenced custody) or re-enters the system later in the same year. Admissions therefore represent the number of entries of persons, during a fiscal year, to remand, sentenced custody or a community supervision program, regardless of the previous legal status. These data are administrative data. Although the correctional services surveys report according to nationally agreed upon, standardized concepts and definitions, limitations in jurisdictional comparability exist due to differences in their operations which can affect the uniform application of the definitions. Therefore, caution is required when making comparisons between jurisdictions.
End of text box
Start of text box
Text box 2
Characteristics of adult offenders admitted to correctional services
The characteristics (sex, age and Aboriginal identity) of adults involved in correctional services are available for the admissions data. Given the method by which admissions are counted, the same person may be represented several times in the data as he or she moves from one type of correctional supervision to another. As a result, caution should be used when interpreting the survey results for age, sex and Aboriginal status of adults under correctional supervision.
End of text box
Survey description
The Adult Correctional Services (ACS) Survey collects aggregate data on the number and case characteristics (e.g., sex, age group, Aboriginal identity, length of time served) of admissions to and releases from adult correctional services. The following jurisdictions responded to the ACS in 2014/2015: Prince Edward Island, Quebec, Manitoba, Yukon, the Northwest Territories and Nunavut.
The Integrated Correctional Services Survey (ICSS) collects microdata on adults and youth under the responsibility of the federal and provincial/territorial correctional systems. Data include socio-demographic characteristics (e.g., age, sex, Aboriginal identity) as well as information pertaining to correctional supervision, including admissions and releases by legal hold status (e.g. remand, sentenced, probation). The following jurisdictions responded to the ICSS in 2014/2015: Newfoundland and Labrador, Nova Scotia, New Brunswick, Ontario, Saskatchewan, British Columbia and Correctional Service Canada.
The Adult Corrections Key Indicator Report collects aggregate data on average daily custody counts and month-end supervised community corrections counts in the provincial/territorial and federal adult systems. The following exclusions are noted for historical data: Newfoundland and Labrador (2009/2010 for data on community supervision); Prince Edward Island (2005/2006); Nova Scotia (2006/2007 to 2014/2015 for data on community supervision); Alberta (2013/2014 all data and 2014/2015 for data on community supervision); and, the Northwest Territories (2003/2004 to 2007/2008 for data on community supervision).
- Date modified: