
Police-reported hate crime in Canada, 2009

Archived Content
Information identified as archived is provided for reference, research or recordkeeping purposes. It is not subject to the Government of Canada Web Standards and has not been altered or updated since it was archived. Please "contact us" to request a format other than those available.
By Mia Dauvergne and Shannon Brennan
- Police-reported hate crimes increase substantially in 2009
- Increases mainly in large census metropolitan areas
- Race or ethnicity most common motivation for hate crime
- Blacks continue to be the most commonly targeted racial group
- Most religiously motivated hate crimes target the Jewish faith
- Hate crimes motivated by sexual orientation often violent
- Hate crime rates highest for youth and young adults
- Hate crimes usually committed by strangers
- Few court cases involve hate crimes
- Summary
- Detailed data tables
- References
- Data sources
- Notes
The composition of Canada's cultural, social, linguistic and religious population is rapidly changing. Between the two most recent census years (2001 and 2006), for example, the proportion of visible minorities1 in Canada grew 27% while those whose mother tongue was neither French nor English rose 18% (Statistics Canada 2008). Over the same period, the number of same-sex couples, including legally married and common-law partners, increased 33% (Milan, Vézina and Wells 2009). Furthermore, between 1991 and 2001, Canada's religious make-up changed, with some of the largest increases among those who reported Muslim, Hindu, Sikh and Buddhist denominations (Statistics Canada 2003).2
With such diversity in the country, discrimination or bias can arise (Boeckmann and Turpin-Petrosino 2002). Some of these incidents may occur in the form of hate crimes, defined as criminal offences motivated by hate towards an identifiable group. Hate crimes may target race, colour, national or ethnic origin, religion, sexual orientation, mental or physical disability, language, sex, age, or any other similar factor (such as profession or political beliefs).3
The importance of collecting data on hate crimes has been recognized throughout the world. According to the Organization for Security and Co-operation in Europe,4 47 of 56 participating countries across North America, Europe and Asia compile at least some data on hate crimes (OSCE 2010). In Canada, data on hate crimes are collected by Statistics Canada via the Uniform Crime Reporting (UCR) Survey.
Data from the UCR Survey reflect hate crimes that have come to the attention of police and have been substantiated through investigation. Police-reported hate crime data have been collected on an annual basis since 2006 and cover 87% of the population of Canada.5,6 This Juristat article focuses on 2009 data, the most up-to-date information available on the extent and nature of police-reported hate crime in Canada.7
It is important to note that these data may under-estimate the true extent of hate crime in Canada as not all incidents are reported to police. Self-reported information from the 2009 General Social Survey suggests that about one-third (34%) of incidents perceived by respondents to have been motivated by hate were subsequently reported to police. It is quite likely that had all incidents been reported to police, at least some would have been determined to meet the legal definition and evidentiary requirements of a hate crime.
Police-reported hate crimes increase substantially in 2009
In 2009, police services covering 87% of the population of Canada reported 1,473 hate crimes, representing less than 1% of all Criminal Code incidents.8 Expressed as a rate, there were 5 police-reported hate crimes for every 100,000 Canadians in 2009. The number of hate crimes in 2009 reflected the second increase in a row (Chart 1), up by 437 incidents or 42% from 2008 (Table 1).
Chart 1
Police-reported hate crimes, 2006 to 2009

Notes: In total, information reflects data reported by police services which, in 2009, covered 87% of the population of Canada.
Source: Statistics Canada, Canadian Centre for Justice Statistics, Uniform Crime Reporting Survey.
Data from a subset of police services covering half of the country shows that the increase in police-reported hate crimes in 2009 occurred largely among non-violent offences, predominantly mischief (e.g. graffiti, vandalism to religious property) which accounted for more than half (54%) of all hate crime incidents in 2009 (Chart 2).9 While the number of violent crimes also rose in 2009, the difference was less substantial than for non-violent hate crimes. Among violent hate crimes, minor assaults (13%), in which little to no physical harm was caused to the victim, and uttering threats (10%) were the most common types of offences. Police reported no hate-motivated homicides in 2009.10
Chart 2
Police-reported hate crimes, by type of offence, 2009
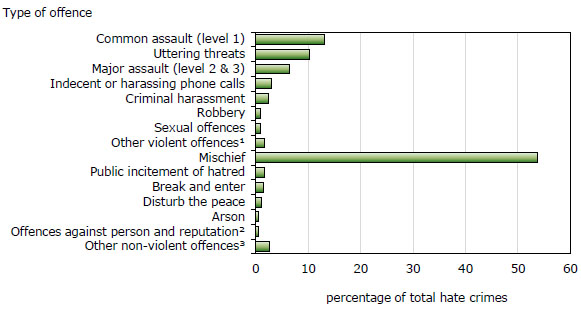
1. Includes, for example, assaults not otherwise specified, intimidation and extortion.
2. Includes, for example, defamatory libel.
3. Includes, for example, threats against property or animals and advocating genocide.
Notes: Data are based upon information reported by police services covering 51% of the population of Canada. Counts are based upon the most serious offence in the incident. One incident may involve multiple violations.
Source: Statistics Canada, Canadian Centre for Justice Statistics, Uniform Crime Reporting Survey.
Increases mainly in large census metropolitan areas
The increase in police-reported hate crimes in 2009 was driven largely by a greater number of incidents reported in several of Canada's largest census metropolitan areas (CMAs) (Table 2).11 More specifically, there were four CMAs that accounted for most of the increase between 2008 and 2009: Ottawa (+83 incidents), Toronto (+79 incidents), Kitchener–Cambridge–Waterloo (+62 incidents) and Montréal (+61 incidents).
Despite relatively large increases in Toronto and Montréal, these census metropolitan areas were not among those with the highest rates in the country. At just under 18 incidents per 100,000 population, Kitchener–Cambridge–Waterloo reported the highest rate of police-reported hate crimes followed closely by Guelph (17 incidents per 100,000) whose rate was also the second highest in 2008.12 Peterborough reported the third highest rate (15 per 100,000), just above the rate in Ottawa (14 per 100,000) (Chart 3).
It is important to note that year-to-year changes in the rates of police-reported hate crimes are not necessarily indicative of increases or decreases in the actual incidence of this type of offence as the number of incidents reported in a given year can be influenced by many factors. For example, the existence (or absence) of specialized hate crime units within police services, training initiatives, zero tolerance policies, victim assistance programs, hot-lines and community awareness campaigns can influence whether victims choose to report a hate crime to police and how police subsequently respond. In other words, the rate of hate crime in a given area may be more indicative of reporting practices by the public and local police services rather than of prevalence levels.
Chart 3
Police-reported hate crimes, by census metropolitan area (CMA)1, 2, 3, 2009
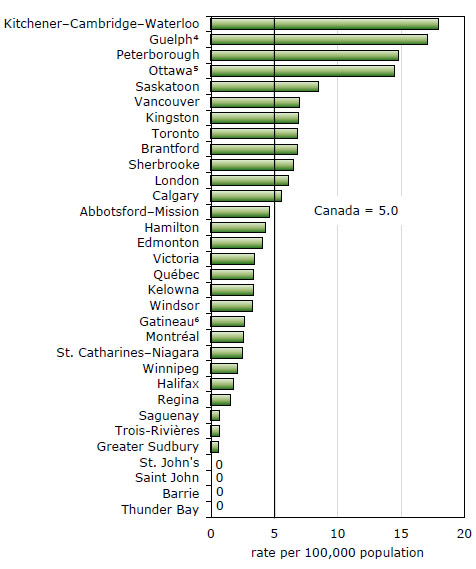
1. A census metropolitan area (CMA) consists of one or more neighbouring municipalities situated around an urban core. A CMA must have a total population of at least 100,000 of which 50,000 or more live in the core. To be included in the CMA, other adjacent municipalities must have a high degree of integration with the urban core, as measured by commuting flows derived from census data.
2. A CMA typically comprises more than one police service. Populations have been adjusted to follow policing boundaries. The Oshawa CMA is excluded from this table due to the incongruity between the police service jurisdictional boundaries and the CMA boundaries. The Moncton CMA is excluded as police services in this area were unable to extract hate crime data from their records management systems.
3. In 2009, coverage for each CMA exceeded 90% except for the following: Winnipeg (88%), Saskatoon (84%), Hamilton (74%), Barrie (70%) and Edmonton (70%). CMA populations have been adjusted to reflect coverage.
4. Information from the Guelph Police Service reflects 2009 data as of March 31, 2011. At the time of this publication, some additional incidents were still under investigation as possible hate crimes.
5. Ottawa refers to the Ontario part of the Ottawa–Gatineau CMA.
6. Gatineau refers to the Quebec part of the Ottawa–Gatineau CMA.
Note: In total, information reflects data reported by police services covering 87% of the population of Canada.
Source: Statistics Canada, Canadian Centre for Justice Statistics, Uniform Crime Reporting Survey.
As in previous years, provincial level data on police-reported hate crimes were only available in Quebec, Ontario and British Columbia as a result of limitations in coverage in other areas of the country.13 Between 2008 and 2009, each of these provinces reported an increase, most notably in Quebec where the rate doubled. That said, as in 2008, the 2009 rates in Ontario and British Columbia were substantially higher than in Quebec.
| Province | 2008 | 2009 | percent change in number from 2008 to 2009 | ||
|---|---|---|---|---|---|
| number | rate | number | rate | ||
| Quebec | 94 | 1.2 | 198 | 2.5 | 110.6 |
| Ontario | 629 | 5.0 | 901 | 7.0 | 43.2 |
| British Columbia | 191 | 4.4 | 219 | 5.0 | 14.7 |
|
Note: Information reflects data reported by police services covering virtually 100% of the population of Quebec, Ontario and British Columbia. Information for other provinces is unavailable as the Royal Canadian Mounted Police outside British Columbia was unable to extract hate crime data from its records management systems. Source: Statistics Canada, Canadian Centre for Justice Statistics, Uniform Crime Reporting Survey. |
|||||
Race or ethnicity most common motivation for hate crime
For each hate crime, police services are asked to indicate the primary motive for the incident. As in previous years, there were three motivations that accounted for the vast majority of hate crime in 2009 (Chart 4). With 762 incidents, the most common was race or ethnicity (Table 3), accounting for more than half (54%) of all incidents. Among the 10 largest census metropolitan areas, Hamilton and Calgary reported the largest proportions of this type of hate crime (Table 4), as was also the case in 2008.
The two other primary motivations for police-reported hate crime were religion (29%) and sexual orientation (13%). The proportion of hate crimes motivated by religion was highest in Winnipeg and Montréal whereas the proportion motivated by sexual orientation was highest in Vancouver. The remaining 4% of incidents targeted a variety of other factors, such as language, mental or physical disability, sex or other factors (e.g. profession or political beliefs).
Chart 4
Police-reported hate crimes, by type of motivation, 2008 and 2009

1. Includes mental or physical disability, language, sex and other similar factors (e.g. profession or political beliefs).
Note: In total, information reflects data reported by police services which, in 2009, covered 87% of the population of Canada. Percentages have been calculated excluding unknown motivations.
Source: Statistics Canada, Canadian Centre for Justice Statistics, Uniform Crime Reporting Survey.
Between 2008 and 2009, increases in the number of incidents were reported among each of the three most common motivations. Proportionately, however, the largest increase was for hate crimes motivated by religion, up by 55% (or 145 incidents). The number of racially motivated hate crimes rose by 35% (or 199 incidents) and those motivated by sexual orientation rose by 18% (or 29 incidents).
Blacks continue to be the most commonly targeted racial group
Data from police services provide additional details on the motivation surrounding hate crimes. With 272 incidents, Blacks were the most commonly targeted racial group, accounting for almost 4 in 10 (38%) racially motivated incidents in 2009 (Table 3). This finding was consistent with results from previous years.
Another 13% of racially motivated incidents were against South Asians (including people of East Indian or Pakistani descent); 10% were against Arabs or West Asians; 10% were against East and Southeast Asians (including Chinese, Japanese, Korean, Vietnamese and Indonesian people); 5% were against Caucasians and 4% were against Aboriginal people.14 The remaining 21% of incidents involved other races or targeted multiple races or ethnicities.
While the number of hate crimes against all racial groups rose in 2009, proportionately the largest increase involved hate crimes against Arabs or West Asians. The number of hate crimes against this racial group doubled from 37 incidents in 2008 to 75 in 2009 (Chart 5).
Chart 5
Police-reported hate crimes, by type of race, 2008 and 2009
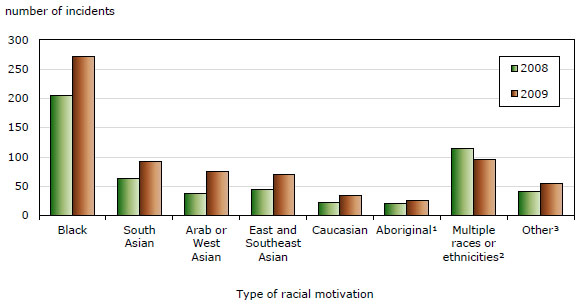
1. The number of hate crimes against Aboriginal people may be under-reported due to the unavailability of data from police services in the territories and the Prairie provinces where the proportion of the Aboriginal population in Canada is highest.
2. Includes hate crimes that target more than one race or ethnic group.
3. Includes motivations based upon race or ethnicity not otherwise stated (e.g. Latin American, South American).
Note: In total, information reflects data reported by police services which, in 2009, covered 87% of the population of Canada.
Source: Statistics Canada, Canadian Centre for Justice Statistics, Uniform Crime Reporting Survey.
Most religiously motivated hate crimes target the Jewish faith
Also consistent with previous years was the finding that about 7 in 10 religiously motivated hate crimes in 2009 targeted the Jewish faith. There were 283 such hate crimes in 2009 (Chart 6), up by 71% from the previous year (Table 3). International research by the OSCE has also found anti-Semitic motivations to be among the most common (OSCE 2010).
Hate crimes against the Muslim faith (Islam) also increased in 2009, up from 26 incidents in 2008 to 36 incidents in 2009 (+38%). There were 33 hate crimes against the Catholic religion, 3 more than in 2008 (+10%).
Chart 6
Police-reported hate crimes, by type of religion, 2008 and 2009
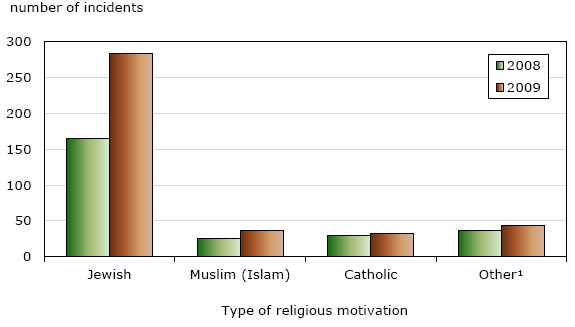
1. Includes motivations based upon religions not otherwise stated (e.g. Sikh, Hindu, and Buddhist).
Note: In total, information reflects data reported by police services which, in 2009, covered 87% of the population of Canada.
Source: Statistics Canada, Canadian Centre for Justice Statistics, Uniform Crime Reporting Survey.
Hate crimes motivated by sexual orientation often violent
As in previous years, incidents motivated by sexual orientation, predominantly homosexuality, were more likely than those driven by other motivations to involve violence. In 2009, three-quarters (74%) of incidents motivated by sexual orientation involved a violent offence, usually assault. In comparison, 39% of racially motivated incidents and 21% of religiously motivated incidents were classified by police as violent in nature.15
Victims of incidents motivated by sexual orientation were more likely than other victims of hate crime to suffer physical injuries. In 2009, 63% of victims of violent hate crimes motivated by sexual orientation were injured compared to 39% of victims of racially motivated incidents and 23% of victims of religiously motivated incidents. The injuries suffered by most victims (90%) of hate crimes motivated by sexual orientation were relatively minor in nature (i.e. may have required some first aid).
Hate crime rates highest for youth and young adults
In 2009, hate crime rates were generally highest among youth and young adults. For both victims and persons accused of police-reported hate crime in 2009, the rate peaked among those aged 12 to 17 years and generally decreased with increasing age (Chart 7). This finding is consistent with results from previous years.
Hate crimes typically involved males, particularly as accused persons. In 2009, 92% of those accused and 73% of victims of hate crime were male. In comparison, 76% of those accused and 49% of victims of overall crime were male.
Chart 7
Victims and persons accused of police-reported hate crimes, by age group, 2009
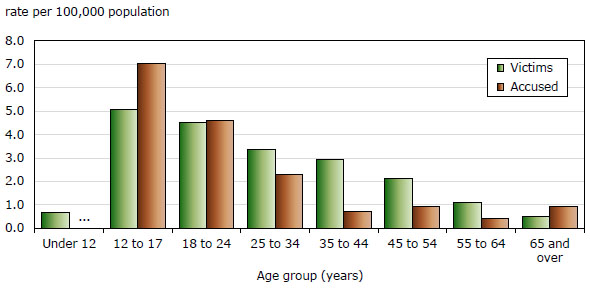
… not applicable
Note: Data are based upon information reported by police services covering 51% of the population of Canada. Populations have been adjusted to reflect coverage.
Source: Statistics Canada, Canadian Centre for Justice Statistics, Uniform Crime Reporting Survey.
Hate crimes usually committed by strangers
In general, most violent crimes solved by police are committed by someone known to the victim, usually a family member or an acquaintance. Violent crimes motivated by hate, however, more typically involved strangers, accounting for more than two-thirds (68%) of all incidents in 2009. This finding is consistent with information reported by police each year since 2006.
Text box 1
Self-reported victimization data on hate-motivated incidents
Information on self-reported victimization is collected by the General Social Survey (GSS) every five years. This survey asks a sample of Canadians, aged 15 years and older, if they had been a victim in the previous 12 months of any of the following offences: sexual assault, robbery, physical assault, break and enter, theft of motor vehicles or parts, theft of household property, theft of personal property and vandalism. If respondents indicate that they had been victimized, they are subsequently asked if they believed that the incident had been motivated by hate and, if so, to state the motivation(s).1
It is important to note that data collected by the GSS differ from data reported by police. Information from the GSS is based upon the perceptions of individuals regarding whether or not a crime occurred and what the motivation for the crime may have been. Information from police, on the other hand, is based upon strict legal criteria for incidents that have been substantiated through investigation. Data on self-reported victimization provide information on incidents that may not have come to the attention of police.
Overall, 5% of all incidents (or close to 399,000 incidents) reported to the GSS in 2009 were believed by victims to have been motivated by hate, up from 3% (or about 262,000 incidents) in 2004, the last time self-reported data were collected by the GSS.2 As in 2004, race was the most common motivation for incidents perceived to be motivated by hate, cited by close to two-thirds (65%) of victims. Other motivations included age (30%), sex (22E%), religion (16E%) and sexual orientation (11E%).3
Information collected by the GSS suggests that the emotional consequences for victims of crimes motivated by hate are greater than for victims of crimes not motivated by hate. In 2009, in 91% of crimes perceived to have been motivated by hate, the victim said the incident had affected them emotionally, compared to 81% of victims of crimes not motivated by hate. The most common emotional reactions to crimes perceived to have been motivated by hate were anger (38%), feeling upset, confused or frustrated (25%) and fear (20E%). Also, for 4 in 10 crimes perceived to have been motivated by hate, the victim stated that they found it difficult or impossible to carry out their everyday activities (e.g. work), double the proportion of crimes that had not been motivated by hate.
The financial loss reported by victims of household crime (break and enter, theft of motor vehicles or parts, theft of household property and vandalism) also tended to be greater when the incident was perceived to be motivated by hate. In 2009, 33E% of hate-motivated household crimes resulted in a financial loss in excess of $1,000. This compares to 17% of incidents not motivated by hate.
Notes:
E use with caution
1. Information on victimization in the territories was collected using a different methodology and is therefore not included in this article. For further information on the methodology of the 2009 General Social Survey on Victimization, see Perreault and Brennan, 2010.
2. In addition to being asked about criminal incidents motivated by hate, GSS respondents were asked whether they had experienced discrimination in the five years preceding the survey. Overall, about 4.2 million Canadians, or 15% of the population aged 15 or older, reported having experienced some form of discrimination. Incidents of discrimination based upon race, ethnicity, colour or culture were the most common.
3. Victims were asked to indicate all motivations that applied to each incident. In 2009, more than one motivation was indicated in more than half (53%) of hate crimes.
End of text box.
Few court cases involve hate crimes
In Canada, sentencing provisions allow for increased penalties when hate is determined to be an aggravating factor in any criminal offence. In addition, there are four specific offences recognized in the Criminal Code as hate crimes: advocating genocide, public incitement of hatred, wilful promotion of hatred and mischief in relation to religious property.
While there are currently no data available on the use of sentencing provisions related to hate crime, it is possible to examine the number of court cases that involve charges for hate crime offences.16 This information shows that relatively few hate crime cases are completed in Canadian courts.
In 2009/2010, adult courts completed 14 cases involving at least one hate crime charge. Wilful promotion and public incitement of hatred were the most common hate crime charges to be heard in adult court (10 cases), followed by mischief to religious property (3 cases) and advocating genocide (1 case). Of these fourteen cases, hate crime charges accounted for the most serious charge in just two cases, both of which resulted in the accused person being found guilty and subsequently sentenced to probation.
In addition, youth courts completed five cases involving at least one hate crime charge, four of which involved mischief to religious property and one which involved a charge of wilful promotion of hatred. In all five cases, the hate crime charges were not determined to be the most serious offence.
Summary
In 2009, Canadian police services reported 1,473 hate crimes, up substantially from the year before. The increase in police-reported hate crimes in 2009 was largely the result of a higher number of incidents in Ottawa, Toronto, Kitchener–Cambridge–Waterloo, and Montréal. As in previous years, three motivations accounted for most hate crimes: race/ethnicity (with Blacks being targeted most often), religion (usually against the Jewish faith) and sexual orientation (predominantly against homosexuality). While mischief was the most common type of police-reported hate crime in 2009, violent offences accounted for about 4 in 10 hate crimes and were particularly common among incidents motivated by sexual orientation. Rates of hate crime tend to be highest among youth and young adults for both victims and persons accused.
Detailed data tables
Table 1 Police-reported hate crimes, 2006 to 2009
Table 2 Police-reported hate crimes, by census metropolitan area, 2008 and 2009
Table 3 Police-reported hate crimes, by type of motivation, 2008 and 2009
References
Boeckmann, Robert J. and Carolyn Turpin-Petrosino. 2002. "Understanding the harm of hate crime." Journal of Social Issues, Vol. 58, no. 2. p. 207-225.
Milan, Anne, Mireille Vézina and Carrie Wells. 2009. "2006 Census: Family portrait: continuity and change in Canadian families and households in 2006: Findings." Demography Division 2006 Analysis Series. Statistics Canada Catalogue no. 97-553-XWE2006001. Statistics Canada, Ottawa.
(accessed February 9, 2011)
Organization for Security and Co-operation in Europe (OSCE). 2010. Hate crimes in the OSCE region–incidents and responses: Annual Report for 2009. OSCE Office for Democratic Institutions and Human Rights. Warsaw: Poland.
Perreault, Samuel and Shannon Brennan. 2010. "Criminal victimization in Canada, 2009." Juristat. Vol. 30, no.2. Statistics Canada Catalogue no. 85-002-XPE. Statistics Canada, Ottawa.
(accessed February 9, 2011)
Silver, Warren, Karen Mihorean and Andrea Taylor-Butts. 2004. "Hate crime in Canada." Juristat. Vol. 24, no. 4. Statistics Canada Catalogue no. 85-002-XPE. Statistics Canada, Ottawa.
(accessed February 7, 2011)
Statistics Canada. 2008. Ethnocultural Portrait of Canada Highlight Tables, 2006 Census. Statistics Canada Catalogue no. 97-562-XWE2006002. Statistics Canada, Ottawa.
(accessed February 7, 2011)
Statistics Canada. 2003. 2001 Census Analysis Series: Religions in Canada. Statistics Canada Catalogue no. 96F0030XIE2001015. Statistics Canada, Ottawa.
(accessed February 7, 2011)
Data sources
Uniform Crime Reporting Survey
The incident-based Uniform Crime Reporting (UCR2) Survey is a microdata survey that captures detailed information on crimes reported to and substantiated by police, including the characteristics of victims, accused persons and incidents. In response to changing information needs, the survey was modified in 2005 (UCR2.2) to enable the identification of incidents motivated by hate based on race, national or ethnic origin, language, colour, religion, sex, age, mental or physical disability, sexual orientation or any other similar factor (such as occupation or political beliefs). In 2009, police services reporting to the UCR2.2 Survey covered 51% of the population of Canada.
A supplemental survey has been conducted each year since 2006 as a means of obtaining information on hate-motivated crimes from those police services reporting microdata but who had not yet converted their electronic reporting systems to the newest UCR2.2 version. These respondents were asked to identify those criminal incidents that had been motivated by hate and to manually provide the detailed characteristics of each incident to Statistics Canada.
Combined, coverage from the UCR2.2 Survey and the supplemental survey in 2009 is estimated at 87% of the population of Canada. The RCMP, outside of British Columbia, was unable to provide information. In addition, a small number of police services still reporting to the old aggregate version of the UCR survey, were unable to respond.
Notes
- Visible minority persons are defined as persons, other than Aboriginal people, who are non-Caucasian in race or non-white in colour.
- Reflects the most recent information collected by the Census.
- The definition of hate crime was developed in consultation with Justice Canada, Public Safety Canada and the Canadian Association of Chiefs of Police and is based upon the criteria established in the Criminal Code.
- The Organization for Security and Co-operation in Europe is an ad hoc organization of the United Nations with a mandate that includes issues related to arms control, human rights, freedom of the press and fair elections.
- Information was collected from the vast majority of all municipal and provincial police services in Canada as well as the Royal Canadian Mounted Police (RCMP) in British Columbia. The RCMP were unable to provide 2009 hate crime data outside British Columbia due to ongoing changes in their records management systems.
- Police-reported data on hate crime were released in 2005 for two police services. Also, a pilot study on hate crimes from 12 police services was conducted in 2001 and 2002. For further information on the results from this pilot study, see Silver, Mihorean and Taylor-Butts, 2004.
- The collection of police-reported hate crime data as well as the production of this analytical report were supported by funding from Citizenship and Immigration Canada.
- Of the total number of incidents, 1,198 (or 81%) were confirmed by police to be hate crimes. The remaining 275 incidents (or 19%) were deemed by police to be "suspected" hate crimes. These proportions differed slightly from those reported in 2008 at 92% and 8%, respectively.
- Information pertaining to the type of offence involved in hate crime is based upon information from police services covering 51% of the population of Canada in 2009.
- Detailed information on hate-motivated homicides in Canada is collected by Statistics Canada's Homicide Survey.
- A census metropolitan area (CMA) consists of one or more neighbouring municipalities situated around an urban core. A CMA must have a total population of at least 100,000 of which 50,000 or more live in the urban core. To be included in the CMA, other adjacent municipalities must have a high degree of integration with the urban core, as measured by commuting flows derived from census data. A CMA typically comprises more than one police service.
- Information from the Guelph Police Service reflects 2009 data as of March 31, 2011. At the time of this publication, some additional incidents were still under investigation as possible hate crimes.
- Provincial analysis is limited due to the unavailability of data from the RCMP outside of British Columbia.
- The number of hate crimes against Aboriginal people may be under-reported due to the unavailability of data from police services in the territories and the Prairie provinces where the proportion of the Aboriginal population in Canada is highest.
- See Note 9.
- Information on court cases involving hate crimes is collected by Statistics Canada's Integrated Criminal Court Survey.
- Date modified: