
Statistics Canada
www.statcan.gc.ca
Common menu bar links
Canadian Crime Statistics, 2007

Archived Content
Information identified as archived is provided for reference, research or recordkeeping purposes. It is not subject to the Government of Canada Web Standards and has not been altered or updated since it was archived. Please "contact us" to request a format other than those available.
by Mia Dauvergne
Introduction
2007 Crime
Violent crime
Property crime
Other offences
Youth crime
Data source
Detailed data tables
References
Notes
Introduction
Each July, the Canadian Centre for Justice Statistics (CCJS) releases its annual report on police-reported crime in Canada. This report presents information on the short and long-term trends in overall, violent, property-related and drug crime at the national, provincial/territorial and census metropolitan area (CMA) levels.1
The data are drawn from the Uniform Crime Reporting (UCR) Survey, a census survey of all crime known to and substantiated by police services. These crime statistics conform to a nationally-approved set of common crime categories and definitions and have been systematically reported by police services and submitted to the CCJS each year since 1962.
Police-reported crime statistics represent one way to measure the nature and extent of crime in Canada. A complementary source of information can be obtained from the General Social Survey (GSS) on victimization. Information obtained from the GSS reflects self-reported data from a sample of Canadians, aged 15 years or older, who report having been victimized by a crime. The GSS is conducted every five years and collects crime data on eight offences: sexual assault, robbery, assault, break and enter, theft of personal property, theft of household property, motor vehicle/parts theft, and vandalism.
Typically, the GSS yields much higher rates of criminal victimization than the UCR Survey. Reasons for the disparity have been well-documented and include the fact that not all incidents are reported to police. According to the 2004 GSS, about one-third (34 %) of criminal victimizations were reported to police. For further information on the findings from the GSS on victimization, see Gannon and Mihorean, 2005.
2007 Crime
Police-reported crime reaches its lowest level since 1977
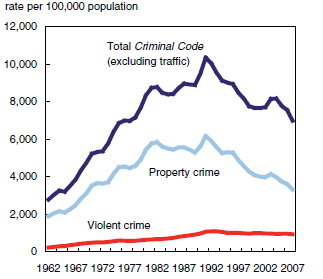
Following a near 30-year low in 2006, the national crime rate2 fell again in 2007, marking its lowest point since 1977 (Table 1). The 7 % drop represented the third consecutive annual decrease and continues the general decline seen in police-reported crime since the rate peaked in 1991 (Chart 1).
Canadian police services reported approximately 2.3 million Criminal Code incidents in 2007 (Table 2). About half (48 %) of all incidents were property-related, 13 % were violent and 39 % were classified as other offences (such as mischief and bail violations).
Ten crime types accounted for about 8 in 10 police-reported incidents in 2007: theft under $5,000 (25 %); mischief (16 %); break and enter (10 %); common assault (8 %); motor vehicle theft (6 %); disturbing the peace (5 %); bail violations (5 %); fraud (4 %); counterfeiting currency (2 %); and, assault with a weapon (2 %).
The 2007 drop in crime was driven by decreases in virtually all of these high-volume, predominately non-violent offences (Table 2). Most notably, there were nearly 64,000 fewer incidents of counterfeiting currency. There were also about 38,600 fewer thefts under $5,000, 20,500 fewer break and enters and 12,500 fewer motor vehicle thefts in 2007.
Crime falls in most provinces and territories
Chart 1
Crime rate, Canada, 1962 to 2007
Violent crime rate, Canada, 1962 to 2007

Source: Statistics Canada, Canadian Centre for Justice Statistics, Uniform Crime Reporting Survey.
The drop in crime occurred in all provinces and territories other than the Northwest Territories (+6 %), Yukon (+3 %) and Newfoundland and Labrador (+3 %) (Table 3). The most substantial decreases were reported by police in Prince Edward Island (-12 %) and Quebec ( -10 %).
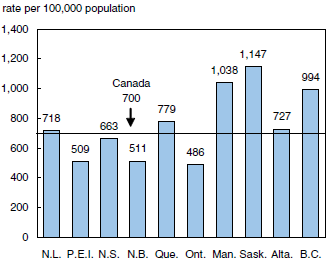
Continuing the pattern observed over the past 30 years, the highest provincial crime rates in 2007 were reported in the west. Despite a 4 % decline, Saskatchewan recorded the highest rate among the provinces for the tenth year in a row, followed by Manitoba, British Columbia and Alberta (Chart 2). Crime rates in the territories were well above the rest of Canada, also consistent with findings from previous years. For the fourth year in a row, Ontario and Quebec reported the lowest 2007 police-reported crime rates.
Drops in crime were also reported in most of Canada’s census metropolitan areas (CMAs),3 including the nine largest (Table 4). The most substantial decreases occurred in Kitchener (-17 %), Montréal (-14 %) and Winnipeg (-13 %). The only areas to report increases were the smaller CMAs of St. John’s, Saguenay, Saint John and Gatineau.4
As in previous years, the highest crime rates were in the western CMAs: Regina, Saskatoon, Abbotsford, Winnipeg, Edmonton, Victoria and Vancouver. In contrast, the lowest crime rates were in the central part of the country: Saguenay, Toronto and Trois- Rivières.
Chart 2
Crime rate by province, 2007

Source: Statistics Canada, Canadian Centre for Justice Statistics, Uniform Crime Reporting Survey.
Violent crime
Violent crime reaches a near 20-year low
Violent crime, accounting for about 1 in 8 criminal incidents, decreased in 2007, although to a lesser extent than did property crime and other non-violent offences. The 3 % drop continued the downward trend in violent crime evident since the early 1990s and marked the lowest rate in nearly 20 years (Table 1).
The drop in total violent crime was due to decreases in common assault, robbery and sexual assault (Table 2). Common assault, the most frequent form of violent crime, fell by 3 %, the seventh consecutive annual decline.
Other serious violent crimes, including homicide, attempted murder and abduction, also decreased while aggravated assault, assault with a weapon and forcible confinement remained stable. The stable rate of assault with a weapon follows seven years of previous increases.
Newfoundland and Labrador was the only province to report an increase in violent crime, up by 11 %. This rise was driven primarily by an increase in common assaults. In line with the province as a whole, St. John’s reported the largest increase in violent crime among all CMAs, up by 20 %.
As in 2006, the lowest rate of violent crime in 2007 was in Prince Edward Island, followed by Quebec and Ontario. The rates in the western provinces, particularly Saskatchewan, were higher than those in the eastern and central parts of the country. The CMAs of Saint John, Thunder Bay and Halifax were exceptions to the general pattern, each reporting violent crime rates that were similar to or higher than those in the west.
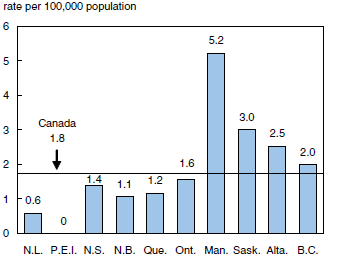
Manitoba reports a record high in homicide
The homicide rate decreased for the second year in a row, down by 3 % in 2007. Police reported 594 victims, 12 fewer than in 2006, representing a rate of 1.8 homicides per 100,000 population (Table 3). The homicide rate has been generally declining since the mid-1970s (Chart 3).
Chart 3
Homicide and attempted murder rate, Canada,
1977 to 2007

Source: Statistics Canada, Canadian Centre for Justice Statistics, Uniform Crime Reporting Survey.
Declines in homicide were reported in all provinces except New Brunswick, Ontario and Manitoba. The largest drop was in British Columbia, with 20 fewer homicides than in 2006, resulting in the lowest rate in that province since 1964. The rate in Quebec also reached its lowest point in over 40 years.
These decreases, however, were offset by a substantial increase in Manitoba where 62 homicides were reported, 23 more than the year before. The increase in Manitoba resulted in a rate of 5.2 victims per 100,000 population, the highest in Canada (Chart 4) and the highest rate in that province since recording began in 1961. The increase in Manitoba was primarily the result of a higher number of homicides committed in small urban and rural areas.
Chart 4
Homicide rate by province, 2007
0 true zero or a value rounded to zero
Source: Statistics Canada, Canadian Centre for Justice Statistics, Uniform Crime Reporting Survey.
With 111 homicides in 2007, Toronto reported the most homicides of any CMA and its highest rate (2.0) since 1992. However, when population differences were taken into account, homicide rates were higher in Saskatoon, Winnipeg, Edmonton, Calgary, Trois-Rivières, Greater Sudbury, Regina and Vancouver.
For the first time since recording began in 1981, the CMA of Québec reported no homicides. The rates in the smaller CMAs of St. John’s, Kingston, Gatineau, Saguenay and St. Catherine’s- Niagara were each below 1 victim per 100,000 population.
There were 35 fewer attempted murders in 2007, resulting in a 5 % decline in the rate for this offence. Manitoba and British Columbia were the only provinces to report increases, up by 53 % and 19 % respectively. Although the rate of attempted murder has remained consistently higher than that of homicide since 1978, it has generally paralleled the gradual decline seen in homicide (Chart 3).
Firearm-related robberies reach a 30-year low
With about 30,000 incidents, the rate of robbery was 5 % lower in 2007 than in 2006. In general, robbery rates declined throughout the 1990s and, despite annual fluctuations, have remained relatively stable since 2000 (Chart 5).
Chart 5
Robbery rate, Canada, 1977 to 2007

Source: Statistics Canada, Canadian Centre for Justice Statistics, Uniform Crime Reporting Survey.
Declines in the rate of robbery in 2007 were reported in all provinces except Newfoundland and Labrador (+17 %), Alberta (+5 %), British Columbia (+3 %) and New Brunswick (+1 %). Of particular note was a 40 % drop in the rate of robbery in Prince Edward Island and a 25 % drop in Nova Scotia.
Led by Manitoba and Saskatchewan, robbery rates in the western provinces were well above the rest of Canada (Chart 6). Manitoba has reported the highest robbery rate since 1994, while Saskatchewan has reported the second highest rate since 2003.
Chart 6
Robbery rate by province, 2007
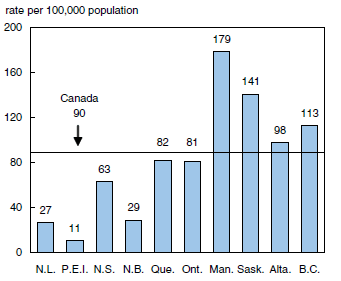
Source: Statistics Canada, Canadian Centre for Justice Statistics, Uniform Crime Reporting Survey.
Most robberies in 2007 were committed without the use of a weapon (60 %). The rate of robberies involving firearms, which accounted for about 11 % of all robbery incidents, fell in all provinces except Manitoba and British Columbia. As a result, the national firearm-related robbery rate was at its lowest point since this information became available in 1977.
Property crime
Property-related offences at lowest level in nearly 40 years
In 2007, police-reported property offences dropped 8 % from the year before and reached their lowest rate since 1969 (Table 1). Historically, property offences accounted for about two-thirds of all crime; however, beginning in the mid-1980s, the proportion began to shift. In 2007, property offences accounted for just under half (48 %) of all criminal incidents.
The four most common types of property-related offences all declined in 2007: break and enter (-9 %), theft of motor vehicle (-9 %), theft under $5,000 (-7 %) and fraud (-6 %) (Table 2). The only property-related offence category not to decrease in 2007 was theft over $5,000 which remained stable.
Break and enters reach lowest point in four decades
The 2007 rate of break and enter was at its lowest point in four decades and 55 % lower than its peak in 1991 (Chart 7). Police reported about 231,000 break and enters, of which nearly 6 in 10 were residential. Another 30 % were businesses and 11 % were other locations such as schools, sheds and detached garages. Long-term data show that the rates for all three categories of break and enter have generally declined since the early 1990s.
Chart 7
Break and enter and motor vehicle theft rate, Canada,
1977 to 2007
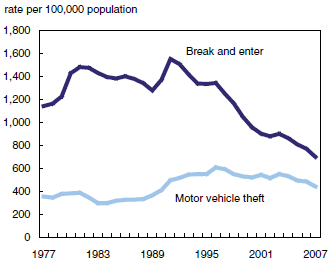
Source: Statistics Canada, Canadian Centre for Justice Statistics, Uniform Crime Reporting Survey.
Declines in the rate of break and enter were reported in all provinces, ranging from 3 % in Newfoundland and Labrador and Manitoba to 15 % in New Brunswick. As has been the case for the past 10 years, Saskatchewan reported the highest rate of break and enter (Chart 8).
Chart 8
Break and enter rate by province, 2007
Source: Statistics Canada, Canadian Centre for Justice Statistics, Uniform Crime Reporting Survey.
Some of the decrease in break and enters may be related to specialized policing programs as well as an increasing use of home security devices, such as burglar alarms, motion detectors and new locks/security bars (Gannon and Taylor-Butts, 2006). Increases in insurance deductibles could also be related to fewer break and enters being reported to police (Fedorowycz, 2004).
Motor vehicle thefts decrease in all provinces except PEI
While most crimes peaked in the early 1990s, motor vehicle theft climbed until 1996 and has gradually declined since, including a 9 % drop in 2007 (Chart 7). Between 2006 and 2007, decreases were reported in every province except Prince Edward Island. The most substantial decline among the provinces occurred in Nova Scotia, down by 23 %.
Part of the overall decrease in motor vehicle theft over the past 10 years may be due to such factors as increased use of antitheft devices (e.g. car alarms, vehicle immobilizers), specialized enforcement teams within some police services and targeted initiatives, such as the “bait car” program.5
As has been the case for the past decade, the 2007 rate in Manitoba was the highest in the country, despite a 10 % drop (Chart 9). About 86 % of Manitoba’s motor vehicle thefts occurred in the CMA of Winnipeg.6
Chart 9
Motor vehicle theft rate by province, 2007

Source: Statistics Canada, Canadian Centre for Justice Statistics, Uniform Crime Reporting Survey.
Other offences
Counterfeiting currency drops by half
“Other” Criminal Code offences represent a general catch-all category of crimes that are classified as neither violent nor property-related. There are four high-volume crime types included in this group, three of which remained relatively stable in 2007: mischief under $5,000, bail violations, and disturbing the peace. The fourth major category is counterfeiting currency. This offence is somewhat unique in that, for a relatively high-volume offence, it is subject to large year-to-year fluctuations. For example, between 2002 and 2004, the rate increased by 147 %. Since then, the rate has declined by 73 %, including a 54 % drop between 2006 to 2007.
The large decrease in counterfeiting in recent years may be partially attributed to enhanced security features that make the replication of bills more difficult, increased education and awareness by merchants and retailers in detecting counterfeit bills, and to law enforcement efforts. In 2006, the RCMP partnered with the Bank of Canada and created strategically located enforcement teams to combat organized crime counterfeiting operations (Bank of Canada, 2007).
Drug and impaired driving offences increase in 2007
Drug crimes, including possession, trafficking, importing, exporting and production-related offences, fall under the authority of the Controlled Drugs and Substances Act and are not included inthe calculation of the overall crime rate. Drug crime rates tend to vary considerably from year to year as police charging practices can be influenced by changes in local enforcement initiatives and available resources.
In 2007, there were about 101,000 drug offences reported to police, a 4 % increase from 2006 (Table 5). Drug offences generally increased throughout the 1990s, and have been relatively stable since. Consistent with reporting rates since the early 1980s, the rate of drug offences was far higher in British Columbia than in any other province.
The overall rate of drug offences was driven by cannabis offences, which accounted for about 6 in 10 drug offences. Possession of cannabis, which comprised three-quarters of all cannabis offences in 2007, rose 6 % (Chart 10). Following five consecutive increases, cocaine offences remained stable while other drug offences, such as heroin, crystal meth and ecstasy, were up by 6 % (Table 5).
Chart 10
Drug offences, Canada, 1977 to 2007

Source: Statistics Canada, Canadian Centre for Justice Statistics, Uniform Crime Reporting Survey.
Similar to drug-related crimes, the number of impaired driving offences reported by police can be influenced by many factors including legislative changes, enforcement practices (e.g. increased use of roadside suspensions), shifts in demographics and changing attitudes on drinking and driving. Although the 2007 rate of impaired driving offences increased by 3 %, the rate of this offence has been generally declining over the past 25 years.
Among the provinces, Newfoundland and Labrador (+25 %) and Alberta (+19 %) reported the most substantial increases in 2007. With a 4 % increase, Saskatchewan reported the highest rate for the 16th straight year.
Youth crime7
Youth crime relatively stable since 1998
There were about 176,000 youth (aged 12 to 17 years) accused8 of a criminal offence in 2007 (Table 6). The rate of youth accused (the youth crime rate) decreased by 2 % in 2007, following a 3 % increase in 2006. Following substantial declines after peaking in 1991, the youth crime rate has remained relatively stable over the past decade (Chart 11).
As with crime in general, the highest rate of youth crime was in Saskatchewan. The rate in Saskatchewan was nearly double the rates reported in Manitoba and Nova Scotia, the next highest provinces.
In contrast to the pattern of the youth crime rate, the rate of violent youth crime has been steadily increasing since the mid-1980s9 (Chart 11). While the 2007 rate was stable compared to the previous year, it was double the rate from 20 years ago. The rise in violent crime can be largely attributed to increases in common assault, which comprise approximately 6 in 10 violent incidents committed by youth.
Following a record high in the youth homicide rate in 2006, the number of youth accused of homicide in 2007 decreased from 85 to 74, representing a 13 % drop in the rate.10 Despite this decrease, the 2007 youth homicide rate was the second highest since 1961. The rates in Manitoba and Saskatchewan, reached record highs (Table 7). It is important to note that youth homicide rates can vary considerably from year-to-year due to the relatively small number of youth who commit this offence.
One of the key objectives of the Youth Criminal Justice Act (YCJA), enacted in 2003, is to divert youth who have committed non-violent and less serious crimes away from the formal criminal justice system by encouraging the use of extrajudicial (non-court) measures (Department of Justice, 2003). These measures include taking no further action, informal police warnings, referrals to community programs, formal police cautions, Crown cautions and extrajudicial sanctions programs. In 2007, the rate of youth cleared by other means, such as diversion programs, dropped 4 %.
In 2007, the rate of youth against whom charges had been laid or recommended by police increased by 2 %. Despite this increase, the proportion of youth charged or recommended for charging by police for property or “other” criminal offences has fallen from 54 % in 2002 (pre-YCJA) to 40 % in 2007. For serious violent crimes (excluding common assaults), about 7 in 10 youth were charged or recommended for charging by police in 2007, also lower than in 2002 (79 %).
Chart 11
Youth accused, 1987 to 2007
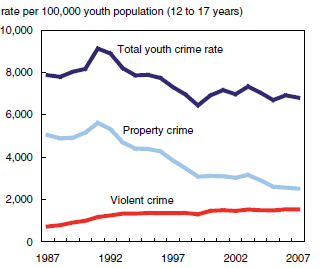
Youth accused of violent crime, 1987 to 2007

Note: Comparable youth crime data are available beginning in 1986 following the implementation of uniform jurisdictional age classifications
in April 1985.
Source: Statistics Canada, Canadian Centre for Justice Statistics, Uniform Crime Reporting Survey.
Factors affecting crime rates
As mentioned periodically throughout this report, many factors can influence crime rates. These may include, but are certainly not limited to, local enforcement strategies, different reporting mechanisms among police services and various social and economic factors.
For example, a recent study examining patterns in crime data found that shifts in inflation were associated with changes in financially-motivated crimes (namely robbery, break and enter and motor vehicle theft) and that alcohol consumption and unemployment rates were correlated with homicide rates (Pottie- Bunge, Johnson and Baldé, 2005). Other studies have found an association between neighbourhood crime rates and income levels (Savoie, 2008).
Crime statistics can also be affected by changes in societal responses and perceptions of certain crimes (such as sexual assault or spousal violence) which can lead to differences in reporting rates to police. Similarly, changes to the criminal justice system, such as the introduction of a new offence, can impact the number of police-reported criminal incidents.
Differences in the reporting structures of police services can also influence crime rates. For example, some police services maintain call centres to receive and record criminal incidents, while others require victims to report crimes in person. The ease of public reporting can impact whether a criminal incident becomes known to police and subsequently reported to the CCJS through the UCR Survey.
Data source
Uniform Crime Reporting (UCR) Survey
The Uniform Crime Reporting (UCR) Survey was established in 1962 with the co-operation and assistance of the Canadian Association of Chiefs of Police. The survey is a compilation of police-reported crimes that have been substantiated through investigation from all federal, provincial and municipal police services in Canada.
There are currently two versions of the UCR survey: aggregate and incident-based microdata. Data from the aggregate version are used in this report and include the number of actual offences, offences cleared by charge or cleared otherwise, persons charged (by sex and by adult/youth breakdown) and youth not charged. It does not include victim or incident characteristics (which are available from the incident-based version). Coverage of the UCR aggregate data reflects virtually 100 % of the total caseload for all police services in Canada.
Detailed data tables
Table 1 Rates of Criminal Code incidents, Canada, 1962 to 2007
Table 2 Selected Criminal Code incidents, by most serious offence, Canada, 2006 and 2007
Table 3 Selected Criminal Code incidents, Canada and the provinces/territories, 2007
Table 4 Rates of selected Criminal Code incidents, by census metropolitan area (CMA), Canada, 2007
Table 5 Drug and impaired driving incidents, Canada and the provinces/territories, 2007
References
Bank of Canada. 2007. “Fighting counterfeiting crime through education.” Anti-Counterfeiting Connections. Summer 2007.
Department of Justice. 2003. The Youth Criminal Justice Act: Summary and Background. Ottawa. http://www.justice.gc.ca/eng/ pi/yj-jj/ycja-lsjpa/back-hist.html (accessed June 24, 2008).
Fedorowycz, Orest. 2004. “Breaking and entering in Canada – 2002.” Juristat. Vol. 24, no. 5. Statistics Canada Catalogue no. 85-002-XIE. Ottawa.
Gannon, Marie and Andrea Taylor-Butts. 2006. “Canadians’ use of crime prevention measures, 2004.” Canadian Centre for Justice Statistics Profile Series. No. 12. Statistics Canada Catalogue no. 85F0033MIE. Ottawa.
Gannon, Maire and Karen Mihorean. 2005. “Criminal victimization in Canada, 2004.” Juristat. Vol.25, no.7. Statistics Canada Catalogue no. 85-002-XPE. Ottawa.
Pottie-Bunge, Valerie, Holly Johnson and Thierno Baldé. 2005. “Exploring crime patterns in Canada.” Crime and Justice Research Paper Series. No. 005. Statistics Canada Catalogue no. 85-561-MIE. Ottawa.
Savoie, Josée. 2008. “Neighbourhood characteristics and the distribution of crime: Edmonton, Halifax and Thunder Bay.” Crime and Justice Research Paper Series. No. 010. Statistics Canada Catalogue no. 85-561-MIE. Ottawa.
Taylor-Butts, Andrea and Angela Bressan. 2008. “Youth crime in Canada, 2006.” Juristat. Vol. 28, no. 3. Statistics Canada Catalogue no. 85-002-XIE. Ottawa.
Notes
- The data presented in this report reflect aggregate counts of crime. More detailed information from the UCR Incident-based Survey are available upon request.
- The crime rate is based upon total Criminal Code incidents, excluding traffic offences and other federal statute violations such as drug offences.
- A CMA refers to a large urban core (at least 100,000 population) combined with adjacent urban and rural areas that have a high degree of economic and social integration. In 2007, there were 27 CMAs in Canada, representing almost two-thirds of the Canadian population. Due to an incongruity between the police service jurisdictional boundaries and the CMA boundaries, the Oshawa CMA is excluded from this analysis.
- Part of the 2007 increase in crime in St. John’s and Saint John can be attributed to changes in police reporting practices rather than actual increases in criminal activity.
- Bait car programs use police-owned decoy vehicles that, if stolen, are monitored through surveillance and GPS tracking, enabling police to observe, follow and apprehend offenders.
- It should be noted that approximately half of the vehicle thefts in Winnipeg in 2007 were “attempts”, higher than the national average of about 15 %. Both the decrease in the number of “completed” vehicle thefts in Winnipeg, as well as the increase in “attempted” thefts, may be attributed to the new provincial requirement for specific high-risk vehicles to be equipped with immobilizers, rendering these vehicles much more difficult to steal.
- For a detailed analysis of 2006 youth crime in Canada, see Taylor-Butts and Bressan, 2008.
- Includes youth formally charged or recommended to the Crown for charging as well as youth cleared by means other than the laying of a charge (e.g. extrajudicial sanctions). Also includes a small number of young persons under the age of 12 years.
- Comparable youth crime data are available beginning in 1986 following the implementation of uniform jurisdictional age classifications in April 1985.
- Persons under 12 years of age have been excluded and will therefore not match the youth homicide data presented in Tables 6 and 7.