
Health Fact Sheets
Lower body bone structure and muscle function in Canadian older adults and seniors, 2016-2019

Introduction
Many might consider bones to be simply the scaffolding that holds the body together, however, they are living and active tissues with several tasks. They protect vital organs, act as a storage area for minerals and allow people to moveNote 1. It has been said that the human bone mass is proportional to its typical mechanical useNote 2. In other words, to support high and repeated pressure loads while avoiding fractures, bones must be regularly used at different intensities, hence the significant link between muscle function and bone structure.
Bone and muscle mass as well as muscle force and power follow a rising path from birth reaching a maximal value around age 40, followed by a decrease. After the age of 40, bone mass tends to decrease by about 0.5% or more per yearNote 3 whereas, by the age of 80, many people have lost nearly 50 percent of their muscle massNote 3. This downward slope may lead to chronic disorders such as osteoporosis (i.e. low bone density), sarcopenia (i.e. loss of muscle mass) and dynapenia (i.e. loss of strength, power and force).
According to the Public Health Agency of Canada, in 2009, 29% of women and 33% of men 40 years of age or older were at risk for osteoporotic fractures and 1.5 million (10%) Canadians reported having been diagnosed with osteoporosisNote 4. These numbers have only gotten worse over the years with approximatively 2.2 million (11.9%) of Canadians aged 40 years or older being diagnosed with osteoporosis in 2015-2016, from which about 80% were womenNote 5. A Statistics Canada Health Report also concluded that people with reduced muscular strength had significantly higher odds of impaired mobility, poor or fair self-rated health, moderate-to-severe disability and increased the risk of fallsNote 6. Since Canadians aged 65 and over reported an increase in falls (from 865,484 in 2008-2009 to 1,081,400 in 2018-2019)Note 7, screening tests to prevent and reduce the severity of these muscle and bone complications in older Canadians could be used.
Bone structure
To collect the bone data, between 2016 and 2019, the Canadian Health Measures Survey (CHMS) used a peripheral quantitative computed tomography (pQCT) scanner, which allows the measure of the amount of mineral contained in a certain volume of bone, commonly called volumetric bone mineral density as well as muscle density in milligram per cubic centimeter (mg/cm3). The pQCT also separately analyses trabecular (porous bone) and cortical (dense outer surface) bones, which allow the examination of bone distribution, structure and geometry at fracture-prone sitesNote 8.
Age has a negative effect on bone structure as well as muscle density
Consistent with what we would have expected, both men and women had lower trabecular bone density (i.e. amount of mineral contained in the porous bone) among seniors (60-79 years old) compared with older adults (40-59 years old), (men: 235.9 mg/cm3 versus 236.4 mg/cm3 respectively; women: 209.2 mg/cm3 versus 222.3 mg/cm3). A difference was also observed in cortical bone (i.e. amount of mineral contained in the dense outer surface) and muscle density among both men and women, with seniors having a lower density than older adults. This may be explained by the considerable changes the skeletal system undergoes over the life span. While in children, old bones are replaced by new bones, allowing growth, and the new bones are being formed faster than the older bones are resorbed. This process becomes much slower over the yearsNote 9.
Older men and women have different bone structure and similar muscle density, but senior men have a higher bone density and a lower muscle density than senior women
It is recognized that men and women do not have the same body musculature and bone structure. While older men (40-59 years) have higher trabecular bone mineral density of the tibia compared to women, for the cortical bone mineral density of the tibia the opposite results were found. Women had a higher cortical density than men (1170.0 mg/cm3 versus 1157.1 mg/cm3, respectfully). Despite these differences in bone structure, there was no difference in muscle density of the tibial section between older men and women (76.3 mg/cm3 versus 76.4 mg/cm3, respectively).
Similar for trabecular bone density senior men had a higher cortical bone density than senior women (1150.4 mg/cm3 versus 1132.9 mg/cm3, respectively). However, the muscle density of the tibial section was higher in senior women (74.6 mg/cm3) than in senior men (73.9 mg/cm3).
Muscle function
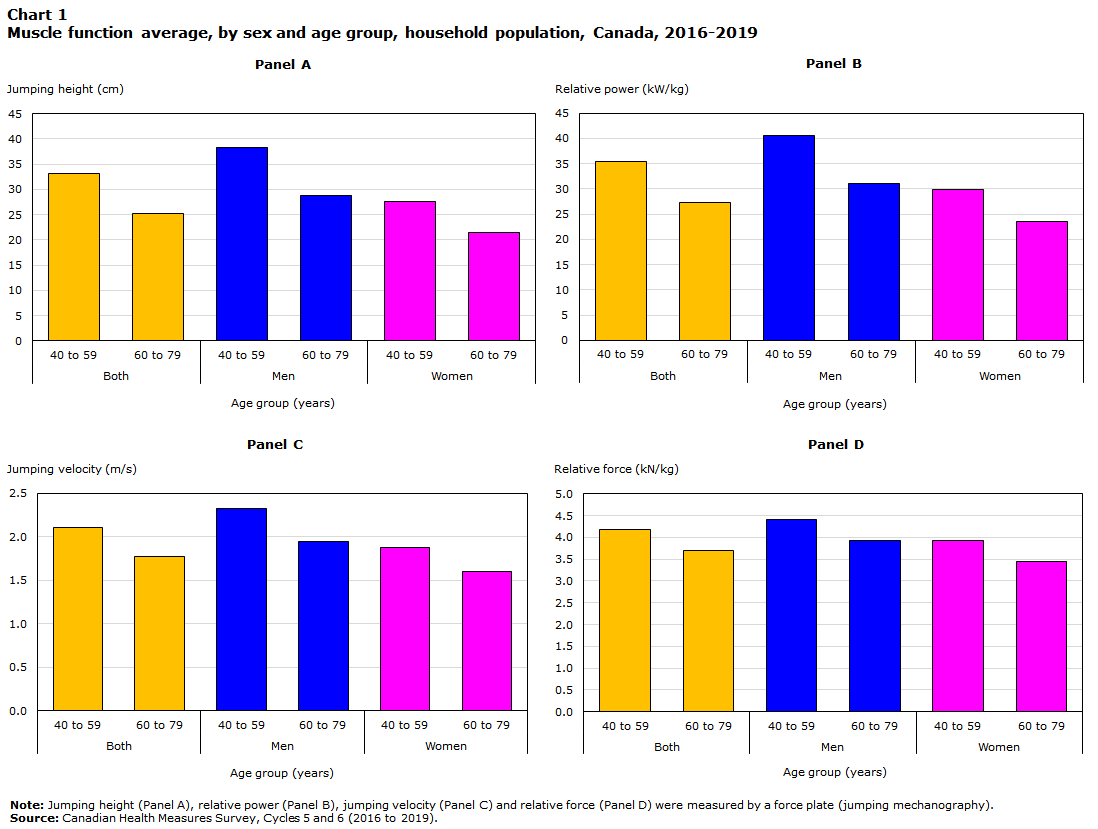
Muscle function can be evaluated with the following parameters: jumping height, jumping velocity, relative power, and relative force. Jumping mechanography is an accurate method to determine these parameters, and measured by jumping on a platform.
Older adults are better jumpers than seniors
Around the age of 40, a decrease in strength and power can occur as a result of disuse but may also occur as a result of typical biological (e.g. hormonal) changes. As expected, the CHMS data shows this decreases in lower limb muscle function with aging. The relative power output of older men (40.65 kW/kg) and women (29.98 kW/kg) was shown to be higher than their senior counterparts (men: 31.12 kW/kg; women: 23.54 kW/kg). This same trend, between the older adults and seniors, was noticed for jumping height, jumping velocity and relative force (Chart 1).
Men’s lower limbs are stronger and more powerful than women’s
Compared to women, men between the ages of 40 and 59 produced higher relative power, jumped higher during a maximal jump (38.35 cm versus 27.66 cm) and possessed a higher maximal jumping velocity (2.33 m/s versus 1.88 m/s). Men also developed higher relative force compared with women (4.40 kN/kg and 3.92 kN/kg, respectively) (Chart 1).
The relative power generated by senior men was also higher than senior women. Higher results were also noted in senior men for jumping height (28.80 cm versus 21.43 cm), jumping velocity (1.95 m/s versus 1.60 m/s) and relative force (3.93 kN/kg versus 3.45 kN/kg) (Chart 1).
Data table for Chart 1
| Panel A | Panel B | Panel C | Panel D | |
|---|---|---|---|---|
| Jumping height (cm) | Relative power (kW/kg) | Jumping velocity (m/s) | Relative force (kN/kg) | |
| Both | ||||
| 40 to 59 | 33.18 | 35.48 | 2.11 | 4.17 |
| 60 to 79 | 25.14 | 27.36 | 1.78 | 3.69 |
| Men | ||||
| 40 to 59 | 38.35 | 40.65 | 2.33 | 4.40 |
| 60 to 79 | 28.80 | 31.12 | 1.95 | 3.93 |
| Women | ||||
| 40 to 59 | 27.66 | 29.98 | 1.88 | 3.92 |
| 60 to 79 | 21.43 | 23.54 | 1.60 | 3.45 |
|
Note: Jumping height (Panel A), relative power (Panel B), jumping velocity (Panel C) and relative force (Panel D) were measured by a force plate (jumping mechanography). Source: Canadian Health Measures Survey, Cycles 5 and 6 (2016 to 2019). |
||||
Stabilising muscle function: the key to reinforce bone structure to limit the risks of falls and osteoporosis fractures?
Despite the higher muscle and cortical bone density in older women, senior men (60-79 years old) were as good jumpers as older women (40-59 years old). This suggests that men’s lower limb muscle function have a better longevity than women’s and that muscle and cortical bone density of the tibial section does not improve the muscle function in this area. It would even seem, in senior women, that muscle density was detrimental for their jumping proficiency, which might seem contrary to what is normally conveyed. Additional research would be needed to confirm this observation.
According to a Health Reports article, using CHMS data, while an overall increase in falls was noted among Canadians aged 65 and older, the majority (56.8%) were reported by womenNote 6. This result is alarming considering 19.2% of women (compared to 3.4% of men) aged 50 or older and 31.1% of women (compared to 6.4% in men) aged 71 or older reported having been diagnosed with osteoporosisNote 10. Furthermore, not only do older and senior women have a higher frequency of falls and are more likely to be affected by osteoporosis, but they also are more prone to osteoporotic fractures. As stated by Osteoporosis Canada, at least “1 in 3 women with osteoporosis will suffer from an osteoporotic fracture during their lifetime compared to 1 in 5 men”Note 11. Older and senior men therefore fall less, but also are less affected by osteoporosis and osteoporotic fractures than women of the same age. While sex differences in bone structure vary over the years, differences in muscle function do not.
Although, this is only a limited measure of muscle function, these results summarise the negative effect of aging on muscle strength in the Canadian population.
About bone structure and muscle function
According to the Mechanostat theory, the human bone mass is proportional to its typical mechanical useNote 12, as bone must be strong enough to withstand peak forces in order to prevent fractures under normal useNote 13. Impaired muscle forces may then contribute to low bone mass, as muscle force is strongly correlated with measures of bone strengthNote 14.
Since it is currently impossible to directly measure the intensity of a muscular contraction or bone composition in a living organism, estimates of muscle and bones mass or size as well as estimates of dynamic muscle contractions have been frequently used insteadNote 6.
With its low radiation dose, peripheral quantitative computed tomography (pQCT) has emerged as a non-invasive imaging modalityNote 8 which enables bone parameters of the peripheral skeleton (e.g. tibia and femur) to be investigated in detailsNote 9.
Jumping mechanography is designed to provide ground reaction forces in kilonewtons (kN), power in kilowatts (kW), maximal jumping velocity in meters per seconds (m/s) and maximal vertical jump in centimeters (cm). It does not require any external weights or loading, can detect even small displacements of the center of gravity in people as long as they can lift-off from the platform for those with substantial impairmentNote 15 and is reproducible across a broad age range from children to frail older populationsNote 16Note 17.
The jumping mechanography assessment is comprised of two tests: the multiple two-leg hopping test which consisted in 10 consecutive hops on both forefeet with stiff knees and the single two-leg jump which was simply one maximal jump.
The multiple two-leg hopping test is the protocol commonly used to measure force or, more precisely, ground reaction forcesNote 18, in kilonewtons (kN). Force is a physical phenomenon and is the fundamental result of an interaction between two objects. In other words, the multiple two-leg hopping test assesses specifically the energy produced by the body to counter the effect of gravity by pushing it up. The single two-leg jump is rather for the assessment of power. Measured in kilowatt (kW), power is an expression of the energy consumed (force) per unit of time. It considers the time it takes to the body to produce as much force as possible over a certain distance in the opposite direction of gravity ( ).
To obtain force or power measurements that are independent of growth and maturation, indexing these parameters by body mass (kN/kg or kW/kg) is a method often used. This practice is particularly appealing as body mass reflects the difference in variables such as muscle density as well as bone mineral density. Although it has been suggested that body mass alone does not eliminate the effect of growth and maturation on force and power, this relative measure is easy to use and is still more appropriate than the unadjusted measure.
Start of text boxThe Canadian Health Measures Survey (CHMS) is the only ongoing nationally-representative data source for measured bone health and muscle function in Canada and thus represents an important mechanism to track changes in musculoskeletal health.
Since 2009, the CHMS has been using grip strength as an indicator of muscular strength. Although this measurement is strongly reflective of total body strengthNote 15, it only assesses the upper body and limbs (isometric force)Note 16, leaving out important components of muscle function (e.g. dynamic force, velocity, power). Considering the emergence and added value these measures provide and the constant increase of the age of CanadiansNote 19, the CHMS began to collect muscle function and bone structure data through new assessments in 2016.
All reported differences are statistically significant.
The 2016-2019 reference period refers to combined results from Cycle 5 (2016 and 2017) and Cycle 6 (2018 and 2019) of the CHMS.
The target population for the CHMS consists of persons 3 to 79 years of age living in the 10 provinces. The observed population excludes: persons living in the three territories; persons living on reserves and other Indigenous settlements in the provinces; full-time members of the Canadian Forces; the institutionalized population and residents of certain remote regions. Altogether these exclusions represent approximately 3% of the target population.
Survey weight and bootstrap weight files and instructions are available for combining Cycle 6 CHMS data (where possible) with equivalent data from Cycle 5.
Definitions, data sources and methods: survey number 5071.
CODR Table available: 13-10-0827-01
Contact information
For more information, or to enquire about the concepts, methods or data quality of this release, contact us (toll-free 1-800-263-1136; 514-283-8300; STATCAN.infostats-infostats.STATCAN@canada.ca) or Media Relations (613-951-4636; STATCAN.mediahotline-ligneinfomedias.STATCAN@canada.ca).
- Date modified: