
Health Fact Sheets
Cholesterol levels of adults, 2016-2019

Archived Content
Information identified as archived is provided for reference, research or recordkeeping purposes. It is not subject to the Government of Canada Web Standards and has not been altered or updated since it was archived. Please "contact us" to request a format other than those available.

The Canadian Health Measure Survey (CHMS) has been collecting blood cholesterol data since 2007. Cholesterol is a fat-like substance that is essential to bodily functions. Cholesterol is produced by the liver and also comes from the diet. There are different types of cholesterol circulating in the blood stream. High-density lipoprotein cholesterol (HDL-cholesterol) is commonly known as the ‘good’ cholesterol because it removes excess cholesterol from the bloodstream.Note 1 Low-density lipoprotein cholesterol (LDL-cholesterol) and non-HDL-cholesterol, or ‘bad’ cholesterol, can form fatty deposits in the arteries.Note 1High levels of LDL-cholesterol and non-HDL-cholesterol, along with low levels of HDL-cholesterol increase risk for cardiovascular disease.Note 1 Note 2 Unhealthy levels of cholesterol can be inherited and can also result from lifestyle choices. For example, a diet rich in trans-fat and saturated fat, obesity, diabetes, a lack of exercise, and smoking could increase the risk of having high levels of blood cholesterol.Note 1 To limit trans-fat intake as much as possible in the diet, the Government of Canada has prohibited the use of partially hydrogenated oils by the food industry.Note 3
Recent CHMS results show that, despite elevated blood cholesterol being a well-known and documented risk factor for cardiovascular disease, there is a fair percentage of the Canadian population who are showing high levels of LDL-cholesterol and non-HDL-cholesterol.
Average cholesterol levels
LDL-cholesterol
Results from the 2016-2019Note 4 CHMS indicate that in adults aged 18 to 79, the average blood concentration of LDL-cholesterol was 2.77 mmol/L. The blood concentrations of LDL-cholesterol that are considered healthy or non-healthy for a person depend on their cardiovascular risk, which is determined by taking into account risk factors such as age, hypertension, smoking, diabetes, etc. LDL-cholesterol levels greater than 3.5 mmol/L are considered elevated for some people at low cardiovascular risk and most individuals at intermediate risk and may need behavior modifications and/or pharmacological treatmentNote 5 (see About cholesterol). The average blood concentration of LDL-cholesterol for the 18 to 39 age group (2.51 mmol/L) was significantly lower than the one measured in the 40 to 59 age group (3.02 mmol/L) and the 60 to 79 age group (2.80 mmol/L) (Chart 1); this was consistent with data analyzed in the previous Fact Sheet using Cycle 3 data (2012-2013).
HDL-cholesterol
The HDL levels are considered ideal when greater than 1.3 mmol/L for females and greater than 1.0 mmol/L for males.Note 1 The CHMS 2016-2019Note 4 results show that adults aged 18 to 79 have an average blood concentration of HDL-cholesterol of 1.59 mmol/L for females and 1.27 mmol/L for males (data not shown), and was similar across all age groups (data not shown).
Non-HDL-cholesterol
According to the 2021 Canadian Cardiovascular Society Guidelines, non-HDL-cholesterol should be considered as an alternate blood measure for the screening of individuals requiring treatment of unhealthy blood cholesterol.Note 5 Non-HDL-cholesterol is derived from the calculation of total cholesterol minus HDL-cholesterol. Non-HDL-cholesterol levels are considered healthy for some individuals at low cardiovascular risk and most individuals at intermediate risk when below 4.2 mmol/L. Management by behavior change and/or pharmacological treatment is recommended when non-HDL-cholesterol is at or above 4.2 mmol/L.Note 5 The average non-HDL-cholesterol was 3.39 mmol/L for adults aged 18 to 79 (Chart 1). Those aged 18 to 39 years had a significantly lower average concentration of non-HDL-cholesterol (3.06 mmol/L) than the 40 to 59 and 60 to 79 age groups (3.68 mmol/L and 3.47 mmol/L, respectively).

Data table for Chart 1
| Age groups | LDL-cholesterol | non-HDL-cholesterol |
|---|---|---|
| mmol/L | ||
| Total (18 to 79 years) | 2.77 | 3.39 |
| 18 to 39 years | 2.51 | 3.06 |
| 40 to 59 years | 3.02 | 3.68 |
| 60 to 79 years | 2.80 | 3.47 |
|
Note: Non-HDL-cholesterol is derived from total cholesterol minus HDL-cholesterol. Source: Canadian Health Measures Survey, Cycle 5 (2016 and 2017) and Cycle 6 (2018 and 2019). |
||
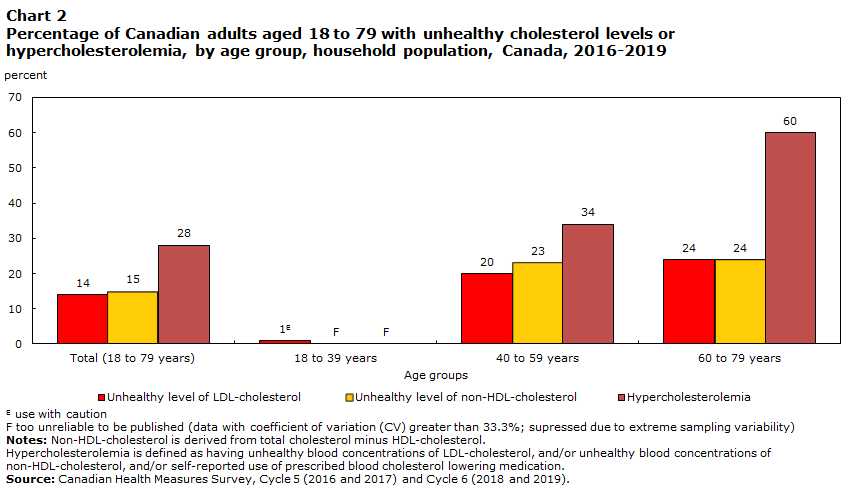
The proportion of individuals with unhealthy levels of LDL-cholesterol and non-HDL cholesterol is lower among the younger than the older people
Fourteen percent of Canadians aged 18 to 79 were living with unhealthy LDL-cholesterol levels and 15% were living with unhealthy non-HDL-cholesterol levels (Chart 2). Among the age groups, less than 1% of those aged 18 to 39 had unhealthy LDL-cholesterol levels, which was significantly lower than in the 40 to 59 (20%) and 60 to 79 (24%) age groups. The proportion of individuals with unhealthy non-HDL cholesterol levels were similar for the 40 to 59 and the 60 to 79 age groups (23% and 24%, respectively) (Chart 2).
Less than 1% of females in the 18 to 39 age group had unhealthy levels of LDL-cholesterol (data not shown). Males aged 40 to 59 year olds had the highest (29%) prevalence of unhealthy LDL-cholesterol levels (data not shown). The range was similar for unhealthy non-HDL-cholesterol levels, with less than 1% of females aged 18 to 39 and nearly a third of males aged 40 to 59 having unhealthy non-HDL-cholesterol levels (data not shown).
Data table for Chart 2
| Unhealthy level of LDL-cholesterol | Unhealthy level of non-HDL-cholesterol | Hypercholesterolemia | |
|---|---|---|---|
| percent | |||
| Total (18 to 79 years) | 14 | 15 | 28 |
| 18 to 39 years | 1Note E: Use with caution | Note F: too unreliable to be published | Note F: too unreliable to be published |
| 40 to 59 years | 20 | 23 | 34 |
| 60 to 79 years | 24 | 24 | 60 |
|
E use with caution F too unreliable to be published Notes: Non-HDL-cholesterol is derived from total cholesterol minus HDL-cholesterol. Hypercholesterolemia is defined as having unhealthy blood concentrations of LDL-cholesterol, and/or unhealthy blood concentrations of non-HDL-cholesterol, and/or self-reported use of prescribed blood cholesterol lowering medication. Source: Canadian Health Measures Survey, Cycle 5 (2016 and 2017) and Cycle 6 (2018 and 2019). |
|||
Hypercholesterolemia
Hypercholesterolemia is defined in this analysis as having unhealthy blood concentrations of LDL-cholesterol, and/or unhealthy blood concentrations of non-HDL-cholesterol, and/or self-reported use of prescribed blood cholesterol lowering medication (see About cholesterol).
Hypercholesterolemia was observed in 28% of Canadians aged 18 to 79. The prevalence of hypercholesterolemia increased with age. It was significantly higher for the 60 to 79 year olds (60%) compared to the 40 to 59 year olds (34%) (Chart 2).
Between the sexes, 34% of males aged 18 to 79 had hypercholesterolemia compared to 22% of females (data not shown).
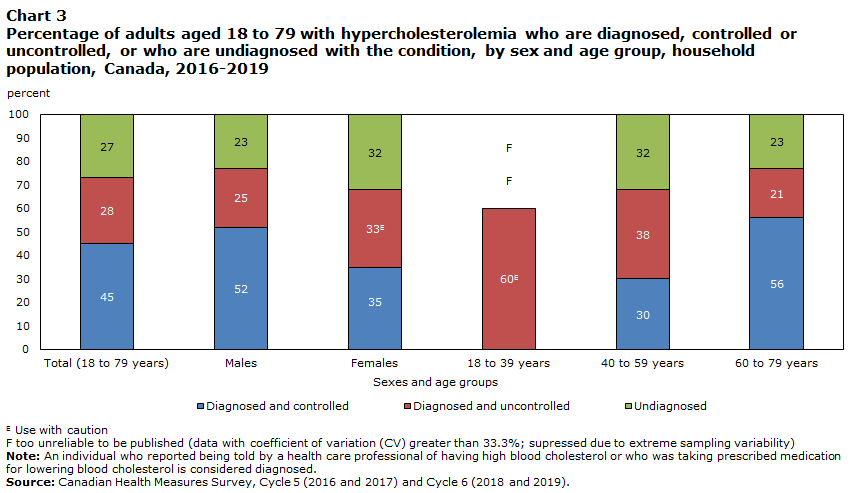
More than one-quarter of Canadians with hypercholesterolemia may be unaware they had uncontrolled cholesterol levels
Among Canadians 18 to 79 with hypercholesterolemia, 74% were diagnosed with the condition; 45% of them had controlled cholesterols levels, while 28% had uncontrolled cholesterol levels (Chart 3).
Older adults (60 to 79 years old) with hypercholesterolemia were significantly more likely to be diagnosed and have their cholesterol levels controlled (56%), compared with the 40 to 59 year olds (30%) (Chart 3).
More than half of all males with hypercholesterolemia were diagnosed and controlled (52%), which was significantly higher than females (35%)
The proportions of those who were diagnosed but had uncontrolled levels did not significantly differ between the sexes (25% of males and 33% of females) (Chart 3).
Data table for Chart 3
| Diagnosed and controlled | Diagnosed and uncontrolled | Undiagnosed | |
|---|---|---|---|
| percent | |||
| Total (18 to 79 years) | 45 | 28 | 27 |
| Males | 52 | 25 | 23 |
| Females | 35 | 33Note E: Use with caution | 32 |
| 18 to 39 years | Note F: too unreliable to be published | 60Note E: Use with caution | Note F: too unreliable to be published |
| 40 to 59 years | 30 | 38 | 32 |
| 60 to 79 years | 56 | 21 | 23 |
|
E use with caution F too unreliable to be published Note: An individual who reported being told by a health care professional of having high blood cholesterol or who was taking prescribed medication for lowering blood cholesterol is considered diagnosed. Source: Canadian Health Measures Survey, Cycle 5 (2016 and 2017) and Cycle 6 (2018 and 2019). |
|||
Cholesterol is an essential structural component within the human body and helps producing vitamin D and various hormones.Note 6 Cholesterol is carried through the blood attached to proteins. The molecules formed by cholesterol and these proteins are called lipoproteins. High-density lipoprotein cholesterol (HDL-cholesterol) is considered the “good” cholesterol because it removes excess cholesterol from the bloodstream and transports it to the liver.Note 1 Other cholesterol types are called ‘non-HDL-cholesterol’. Low-density lipoprotein cholesterol (LDL-cholesterol) is part of non-HDL-cholesterol and is referred to as “bad” cholesterol because it can form fatty deposits on arterial walls and increases the risk of cardiovascular disease.Note 1 The levels of these molecules determine whether someone has healthy or unhealthy blood cholesterol levels. Unhealthy blood cholesterol levels can have negative effects on blood vessels and cardiovascular health.Note 2 Unhealthy blood cholesterol levels can be inherited, but can also be the result of unhealthy lifestyle choices.
Certain people are at a higher risk of cardiovascular disease and thus require greater monitoring of cholesterol levels. These individuals include males and females aged 40 and older, post-menopausal females, people with atherosclerosis, diabetes, obesity, high blood pressure, abdominal aortic aneurysm, stigmata of dyslipidemia, chronic kidney disease, inflammatory diseases, HIV infection, erectile dysfunction, chronic obstructive pulmonary disease, history of hypertensive disorder of pregnancy and people who smoke or have a family history of dyslipidemia or premature cardiovascular disease.Note 5 Usually, high blood cholesterol levels can be treated with lifestyle changes and medication.Note 1
The CHMS measured the concentrations of HDL-cholesterol and total cholesterol in serum, which is a component of blood, in millimoles per litre (mmol/L) on a nationally representative sample. LDL-cholesterol in blood (mmol/L) was calculated using the Friedewald equationNote 7 for a selected subsample of respondents who had fasted for at least 10 hours prior to the blood draw.
For the purpose of this analysis, any self-reported medication determined to be a “lipid-modifying agent” (according to the Anatomic Therapeutic Classification system) except “Omega-3 triglycerides including other esters and acids” (C10AX06) was used to identify respondents being treated with blood cholesterol lowering medications. An individual who reported being told by a health care professional of having high cholesterol or who was taking prescribed medication for lowering blood cholesterol levels was considered diagnosed. Individuals who were diagnosed, could have controlled levels due to medication or to a change in lifestyle choices.
Unhealthy blood concentrations cut-offs of LDL-cholesterol and non-HDL-cholesterol levels were determined based on the Framingham risk score (FRS) calculation.Note 8 The FRS is a gender-specific calculation to estimate the 10-year cardiovascular disease (CVD) risk of an individual.Note 8 The respondent’s age, HDL-cholesterol, total cholesterol, systolic blood pressure, and if they smoke or have diabetes are taken into consideration to determine the risk level. The more an individual meets these risk factors the more risk points are obtained, resulting in a higher 10-year CVD risk (%). The risk level (low, intermediate or high risk) will guide the physicians in recommending the most appropriate approach for treatment. For this analysis, elevated blood cholesterol levels were cut off at LDL-cholesterol ≥3.5 mmol/L and/or non-HDL-cholesterol ≥4.2 mmol/L if the FRS was 5% or more. For a risk score below 5%, the cut-offs at LDL-cholesterol ≥5.0 mmol/L and/or non-HDL-cholesterol ≥5.8 mmol/L were applied.Note 5 The CHMS variables included in the risk score for this analysis were: age, gender, HDL-cholesterol, total cholesterol, systolic blood pressure (and self-reported using medication to treat high blood pressure), being a smoker (yes=occasional or daily), and self-reported diabetes.
Data
The Canadian Health Measures Survey (CHMS) is a two-step survey. The first step is a personal interview at the respondent's household. The second step is a visit to the CHMS mobile clinic where physical measurements and blood and urine samples are taken.
The 2016-2019 reference period refers to combined results from Cycle 5 (2016 and 2017) and Cycle 6 (2018 and 2019) of the CHMS.
The target population for the CHMS consists of persons 3 to 79 years of age living in the 10 provinces. The observed population excludes: persons living in the three territories; persons living on reserves and other Aboriginal settlements in the provinces; full-time members of the Canadian Forces; the institutionalized population and residents of certain remote regions. Altogether these exclusions represent approximately 3% of the target population.
Survey weight and bootstrap weight files and instructions are available for combining Cycle 6 Canadian Health Measures Survey data (where possible) with equivalent data from Cycles 1 to 5.
Canadian Health Measures Survey data related to this fact sheet are available in the data table 13-10-0326-01.
For more information on the Canadian Health Measures Survey, please contact Statistics Canada's Statistical Information Service (toll-free 1-800-263-1136; 514-283-8300; STATCAN.infostats-infostats.STATCAN@canada.ca).
- Date modified: